File:McCall Article 3 Figure 11.PNG
No higher resolution available.
McCall_Article_3_Figure_11.PNG (557 × 460 pixels, file size: 159 KB, MIME type: image/png)
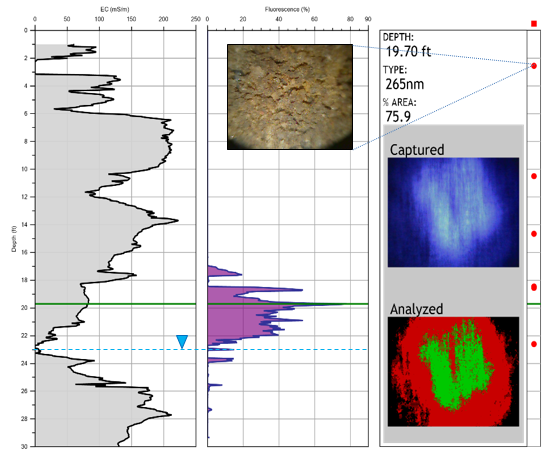
Figure 11: OIP log with EC plotted on left, % area of fluorescence plotted on the right graph (shaded). Example of a captured image displaying fluorescence (mid-right) and analysis of the image used to determine % area of fluorescence below. Fuel product is focused in the area of lower EC (higher permeability) above the water level at this site. Visible light image (top center) provides information on texture and color at the selected depth.
File history
Click on a date/time to view the file as it appeared at that time.
| Date/Time | Thumbnail | Dimensions | User | Comment | |
|---|---|---|---|---|---|
| current | 14:58, 29 August 2016 | | 557 × 460 (159 KB) | Debra Tabron (talk | contribs) | Figure 11: OIP log with EC plotted on left, % area of fluorescence plotted on the right graph (shaded). Example of a captured image displaying fluorescence (mid-right) and analysis of the image used to determine % area of fluorescence below. Fuel pro... |
- You cannot overwrite this file.
File usage
The following page links to this file: