File list
This special page shows all uploaded files.
| Date | Name | Thumbnail | Size | User | Description | Versions |
|---|---|---|---|---|---|---|
| 17:21, 1 February 2019 | 1988-Weston-field Demonstration - Composting Explosives at LAAP.pdf (file) | 6.34 MB | Debra Tabron | Weston, R.F. (1988) Field Demonstration—Composting Explosives-Contaminated Sediments at the Louisiana Army Ammunition Plant (LAAP). | 1 | |
| 17:23, 1 February 2019 | 1991-Weston-Optimization of Composting Explosives Contaminated soils.pdf (file) | 6.83 MB | Debra Tabron | Weston (1991) Optimization of Composting Explosives Contaminated Soils at Umatilla, U.S. Army Toxic and Hazardous Materials Agency Report No. CETHA-TS-CR-91053. | 1 | |
| 17:25, 1 February 2019 | 1993-Weston-Windrow Composting Demo for Explosives.pdf (file) | 11.69 MB | Debra Tabron | Weston (1993), Windrow Composting Demonstration for Explosives-Contaminated Soils at the Umatilla Depot Activity Hermiston, Oregon. U.S. Army Environmental Center Report No. CETHA-TS-CR-93043. | 1 | |
| 17:26, 1 February 2019 | 1993-AEC Technology Applicatons Analysis.pdf (file) | 921 KB | Debra Tabron | AEC (1993) Technology Applications Analysis: Windrow Composting of Explosives Contaminated Soils at Umatilla Army Depot Activity | 1 | |
| 17:27, 1 February 2019 | 1995-Craig-Bioremediation of explosives-Contaminated Soils.pdf (file) | 530 KB | Debra Tabron | Craig, H.D., Sisk, W.E., Nelson, M.D. and W.H. Dana (1995) Bioremediation of Explosives-Contaminated Soils: A Status Review. Proceedings of the 10th Annual Conference on Hazardous Waste Research | 1 | |
| 17:29, 1 February 2019 | 2002-EPA-Application, Performance, and Costs for Biotreatment Tech for Cont Soils.pdf (file) | 2.09 MB | Debra Tabron | EPA (2002) Application, Performance, and Costs for Biotreatment Technologies for Contaminated Soils. | 1 | |
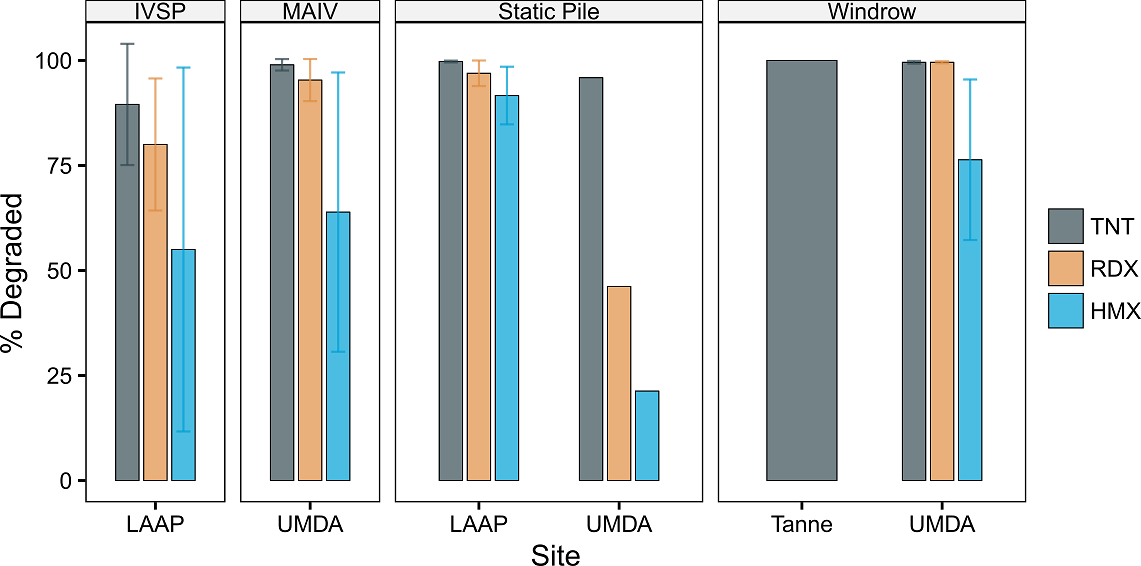
| 12:28, 5 February 2019 | Craig1w2 Fig1.png (file) |  |
38 KB | Debra Tabron | Figure 1: Compound reductions for different composting techniques using soils from contaminated ammunition production sites. Error bars are ± 1 standard deviation. IVSP = in-vessel static pile; MAIV = mechanically agitated in-vessel. Data compiled by... | 1 |
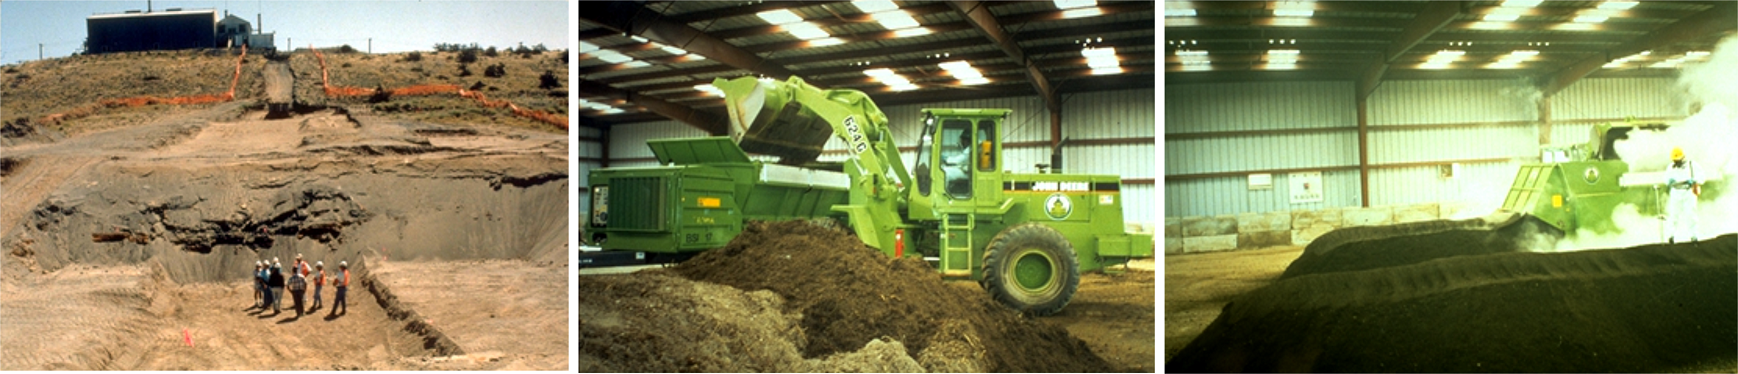
| 12:29, 5 February 2019 | Craig1w2 Fig2.png (file) | 1.21 MB | Debra Tabron | Figure 2: Key steps of windrow composting process at UMDA including: excavation of contaminated soil to 15 feet below ground surface (left), loading windrow machine with soil and amendments (middle), and periodically turning the windrows (right). | 1 | |
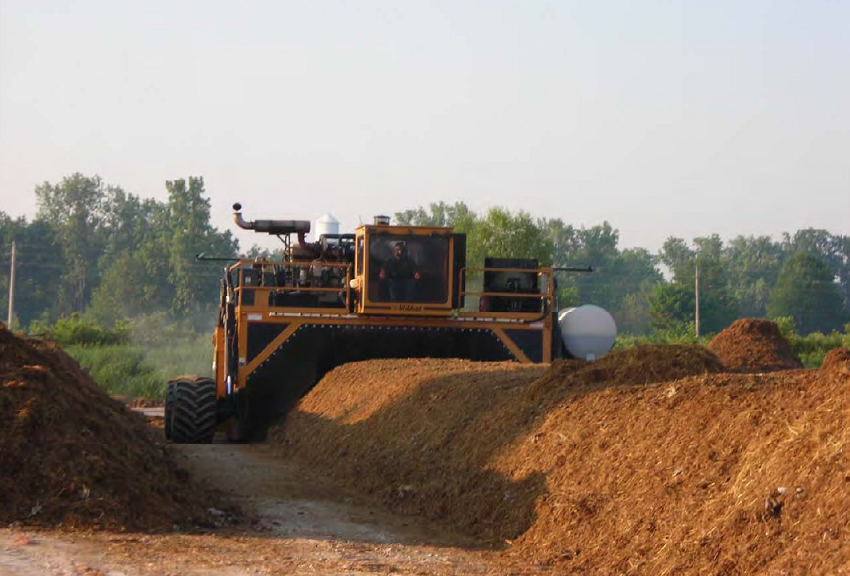
| 12:30, 5 February 2019 | Craig1w2 Fig3.png (file) |  |
650 KB | Debra Tabron | Figure 3: Windrow Turner at Plum Brook Ordinance Works | 1 |
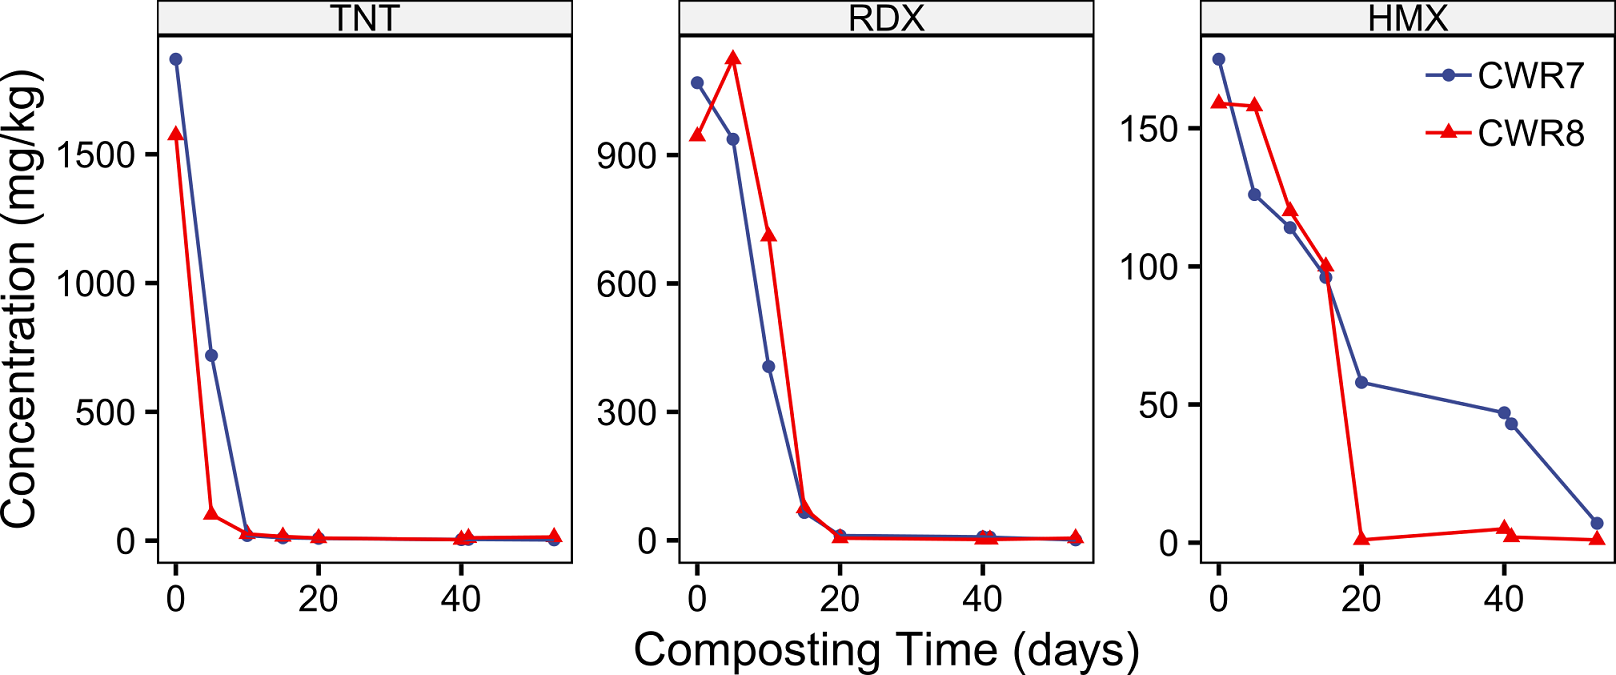
| 12:32, 5 February 2019 | Craig1w2 Fig4.png (file) |  |
146 KB | Debra Tabron | Figure 4: Degradation kinetics of three munitions contaminants in two UMDA windrows (modified from: Weston, 1993 | 1 |
| 18:11, 8 February 2019 | 2015-Hatzinger-Field Demonstration of Propane Biosparging.pdf (file) | 24.57 MB | Debra Tabron | Hatzinger, P.B., Lippincott, D., 2015. Field Demonstration of Propane Biosparging for In Situ Remediation of n-Nitrosodimethylamine (NDMA) in Groundwater. ESTCP Project ER-200828. | 1 | |
| 11:04, 11 February 2019 | 2014-USEPA-N-Nitrosodimethylamine fact sheet.pdf (file) | 118 KB | Debra Tabron | USEPA. 2014. Technical Fact Sheet - N-Nitroso-dimethylamine. USEPA Office of Solid Waste and Emergency Response. EPA 505-F-14-005. | 1 | |
| 13:23, 11 February 2019 | Hatzinger1w2 Fig1.png (file) |  |
19 KB | Debra Tabron | Figure 1. NDMA chemical structure | 1 |
| 13:24, 11 February 2019 | Hatzinger1w2 Fig2.png (file) |  |
390 KB | Debra Tabron | Figure 2. Field-Scale Propane-Fed FBR | 1 |
| 13:26, 11 February 2019 | Hatzinger1w2 Fig3.png (file) |  |
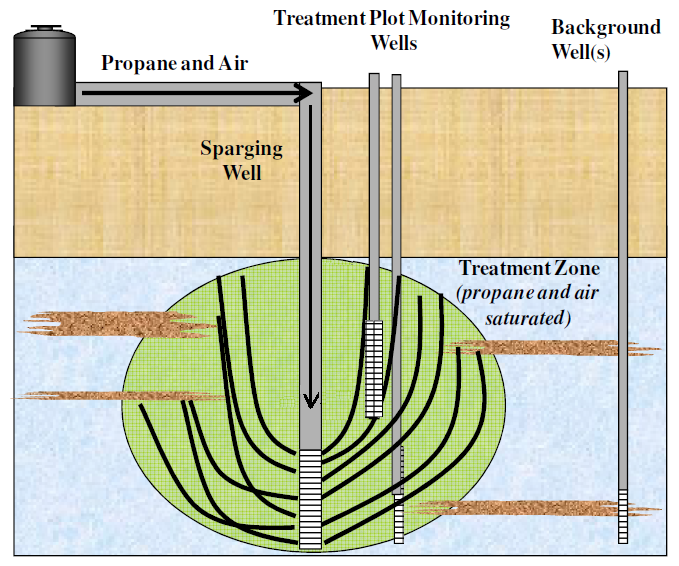
303 KB | Debra Tabron | Figure 3. Layout of biosparging system<ref name= "Hatzinger2015"/>. | 1 |
| 13:27, 11 February 2019 | Hatzinger1w2 Fig4.png (file) |  |
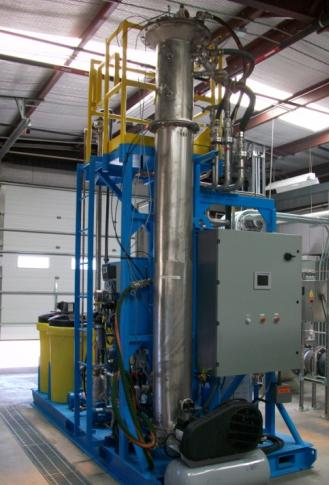
1,017 KB | Debra Tabron | Figure 4. Field-Scale In Situ Propane Biosparging System | 1 |
| 16:27, 18 February 2019 | 1990-Piwoni-Basic concepts sorption haz site EPA 540-4-90-053.pdf (file) | 45 KB | Debra Tabron | Piwoni, M.D., and Keeley, J.W., 1990. Basic Concepts of Contaminant Sorption at Hazardous Waste Sites. USEPA, Ground Water Issue, EPA/540/4-90/053. | 1 | |
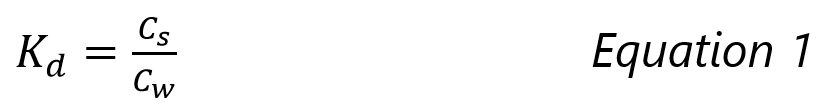
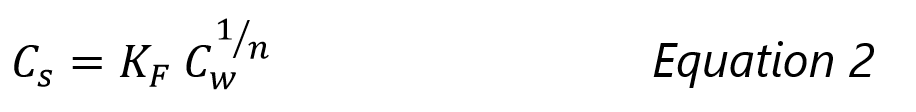
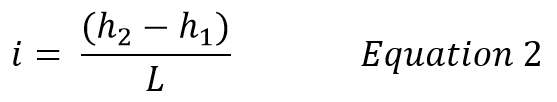
| 17:37, 18 February 2019 | Allen-King1w2 Eq1.png (file) | 5 KB | Debra Tabron | 1 | ||
| 17:39, 18 February 2019 | Allen-King1w2 Eq2.png (file) | 6 KB | Debra Tabron | 1 | ||
| 17:39, 18 February 2019 | Allen-King1w2 Eq3.png (file) | 18 KB | Debra Tabron | 1 | ||
| 17:41, 18 February 2019 | Allen-King1w2 Eq4.png (file) | 6 KB | Debra Tabron | 1 | ||
| 17:42, 18 February 2019 | Allen-King1w2 Eq5.png (file) | 8 KB | Debra Tabron | 1 | ||
| 17:43, 18 February 2019 | Allen-King1w2 Eq6.png (file) | 5 KB | Debra Tabron | 1 | ||
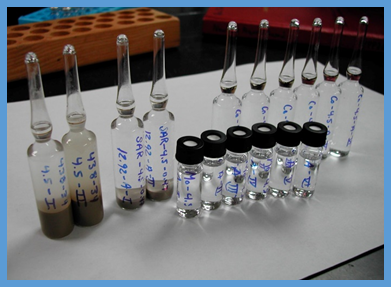
| 17:44, 18 February 2019 | Allen-King1w2 Fig1a.png (file) |  |
202 KB | Debra Tabron | Figure 1. Batch reactor experiments (a, top) to generate points on a sorption isotherm (b). Part (a) shows two samples prepared in duplicate with soil-free control vials and vials to verify the contaminant mass added to the systems. Part (b) shows lin... | 1 |
| 17:46, 18 February 2019 | Allen-King1w2 Fig1b.png (file) |  |
453 KB | Debra Tabron | 1 | |
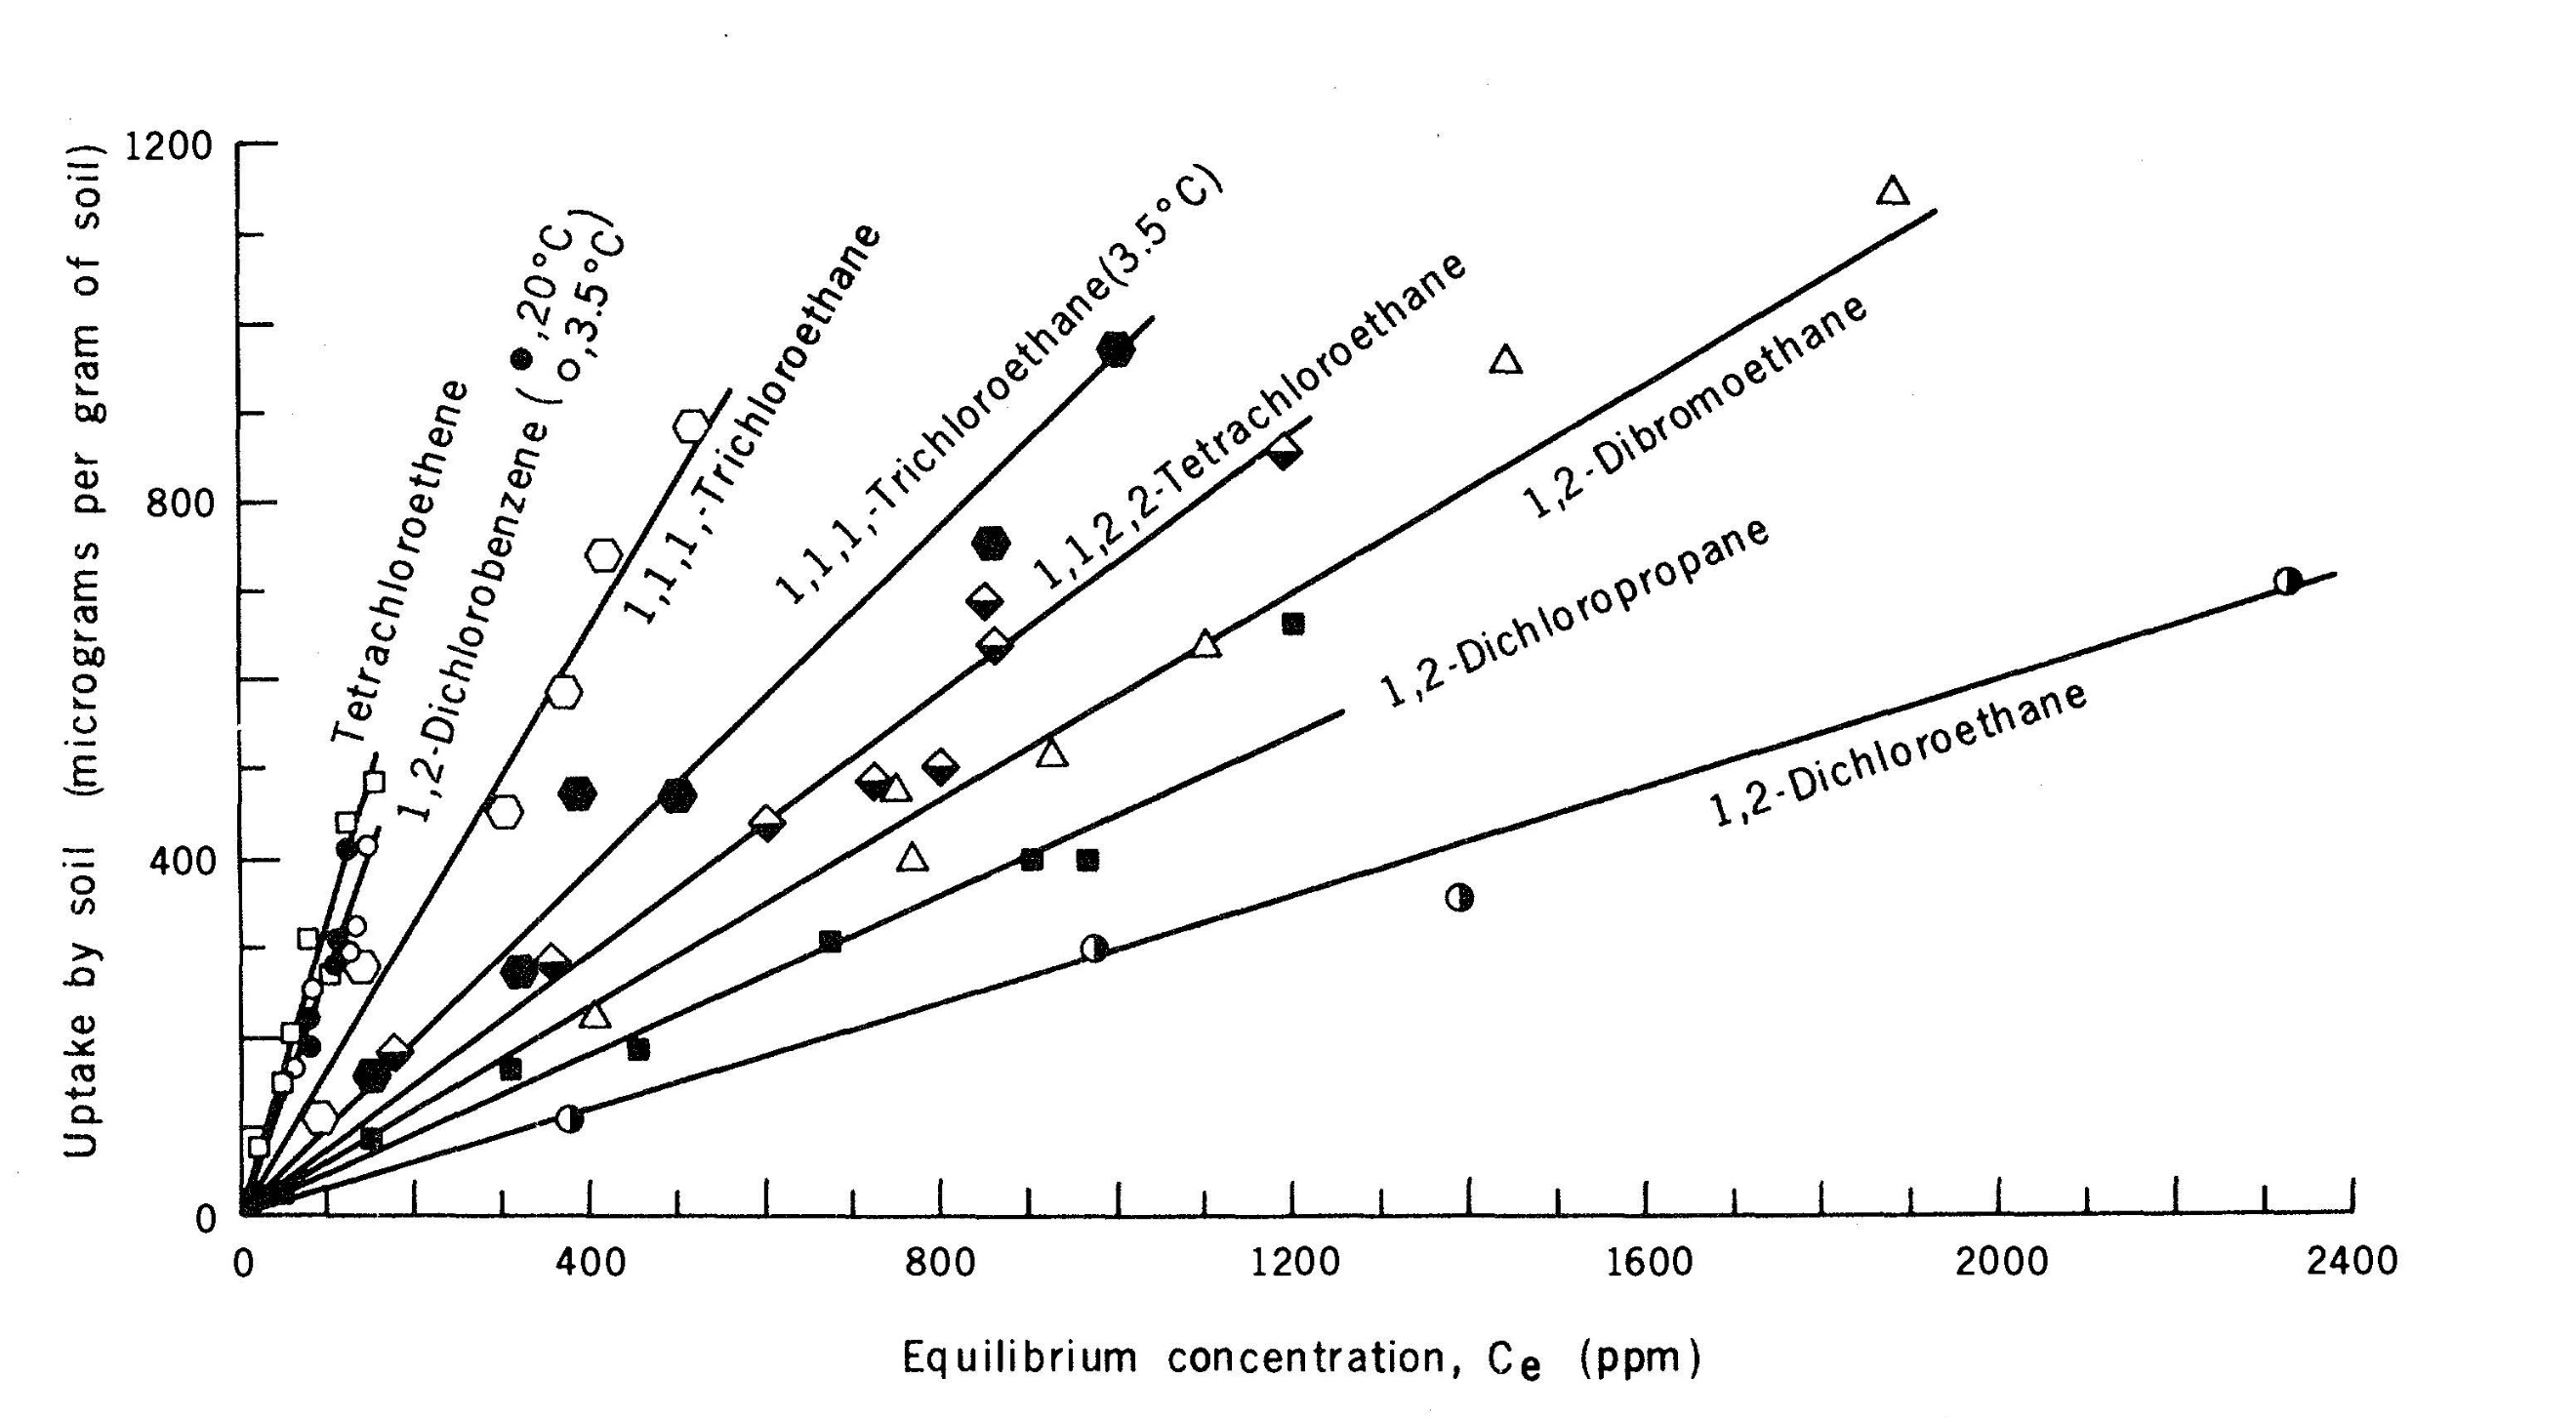
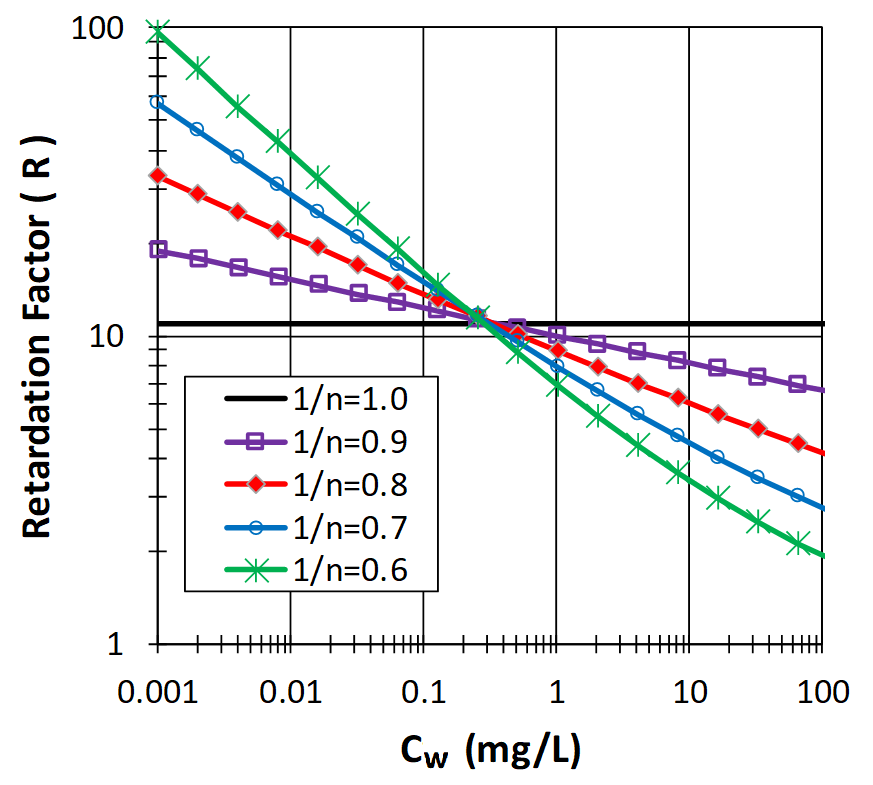
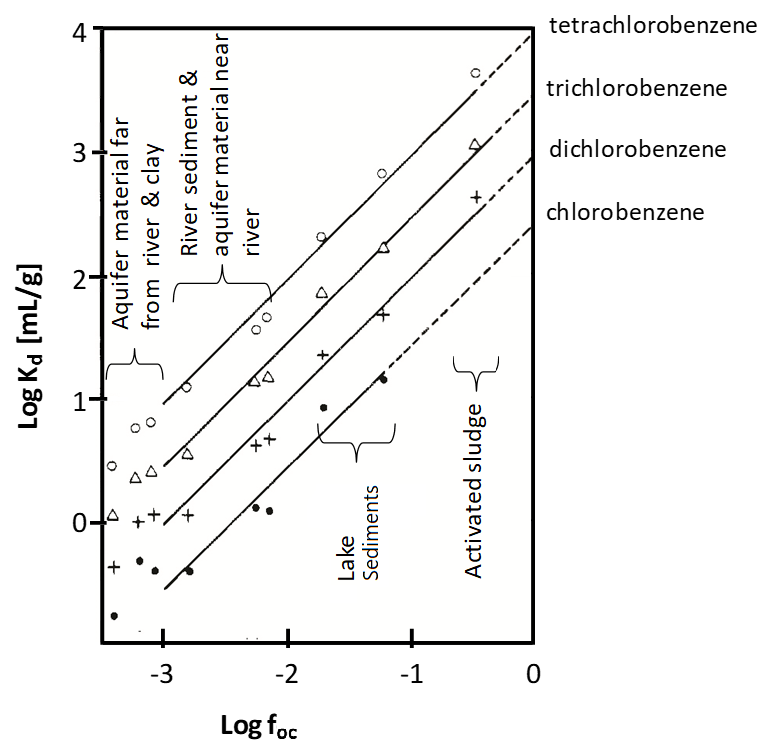
| 17:47, 18 February 2019 | Allen-King1w2 Fig2.png (file) |  |
75 KB | Debra Tabron | 1 | |
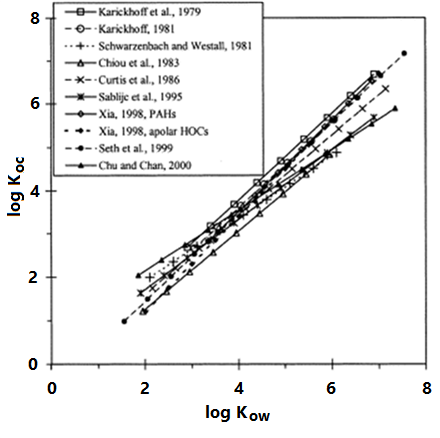
| 17:48, 18 February 2019 | Allen-King1w2 Fig3.png (file) |  |
115 KB | Debra Tabron | 1 | |
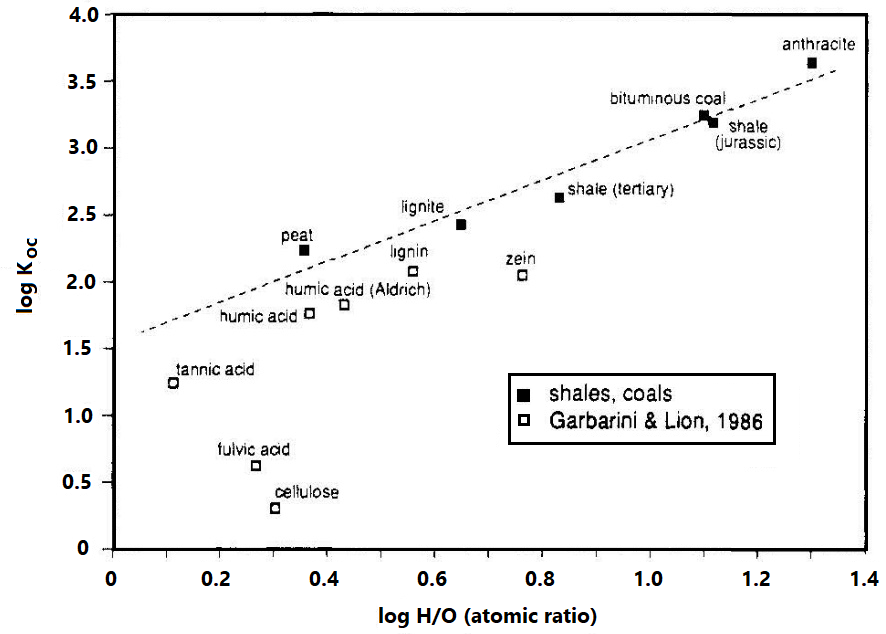
| 17:48, 18 February 2019 | Allen-King1w2 Fig4.png (file) |  |
57 KB | Debra Tabron | 1 | |
| 17:49, 18 February 2019 | Allen-King1w2 Fig5.png (file) |  |
126 KB | Debra Tabron | 1 | |
| 14:03, 5 March 2019 | Liu1w2 Eq1.png (file) | 3 KB | Debra Tabron | 1 | ||
| 14:04, 5 March 2019 | Liu1w2 Eq2.png (file) | 4 KB | Debra Tabron | 1 | ||
| 14:04, 5 March 2019 | Liu1w2 Eq3.png (file) | 4 KB | Debra Tabron | 1 | ||
| 14:05, 5 March 2019 | Liu1w2 Eq4.png (file) |  |
7 KB | Debra Tabron | 1 | |
| 14:07, 5 March 2019 | Liu1w2 Eq5.png (file) | 4 KB | Debra Tabron | 1 | ||
| 14:08, 5 March 2019 | Liu1w2 Eq6.png (file) | 6 KB | Debra Tabron | 1 | ||
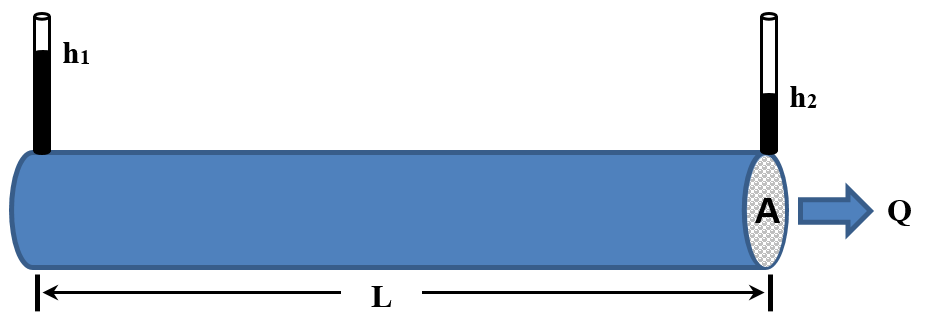
| 14:09, 5 March 2019 | Liu1w2 Fig1.png (file) |  |
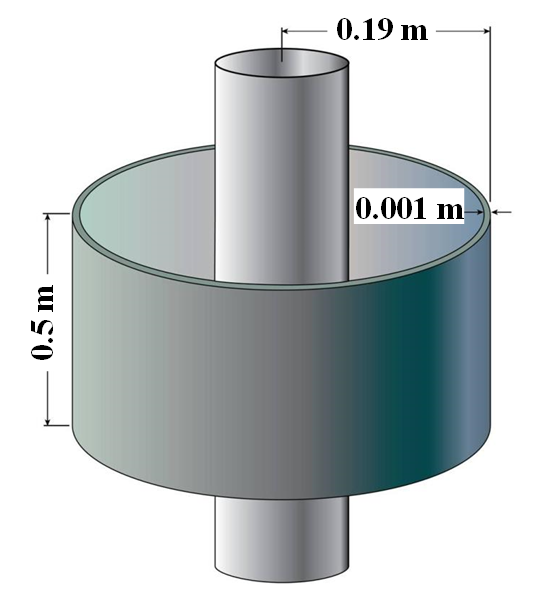
12 KB | Debra Tabron | Figure 1. Schematic of Darcy’s Law flow experiment. | 1 |
| 14:18, 5 March 2019 | Liu1w2 Fig2A.png (file) |  |
271 KB | Debra Tabron | Figure 2A. Schematic of a falling-head slug test (water flows from well into aquifer) performed in a multi-level slug-test system. Head change is introduced in standpipe, which is directly connected to the interval isolated by the straddle packers (not... | 1 |
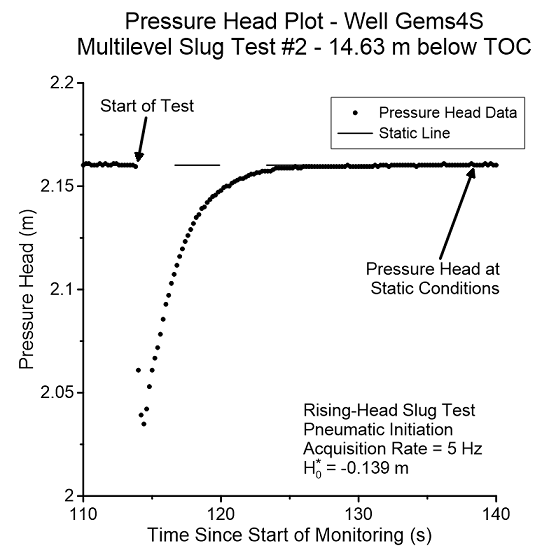
| 14:18, 5 March 2019 | Liu1w2 Fig2B.png (file) |  |
58 KB | Debra Tabron | Figure 2B. Example data plot from a multilevel slug test at GEMS. Test is initiated by sudden depressurization of a pressurized air column | 1 |
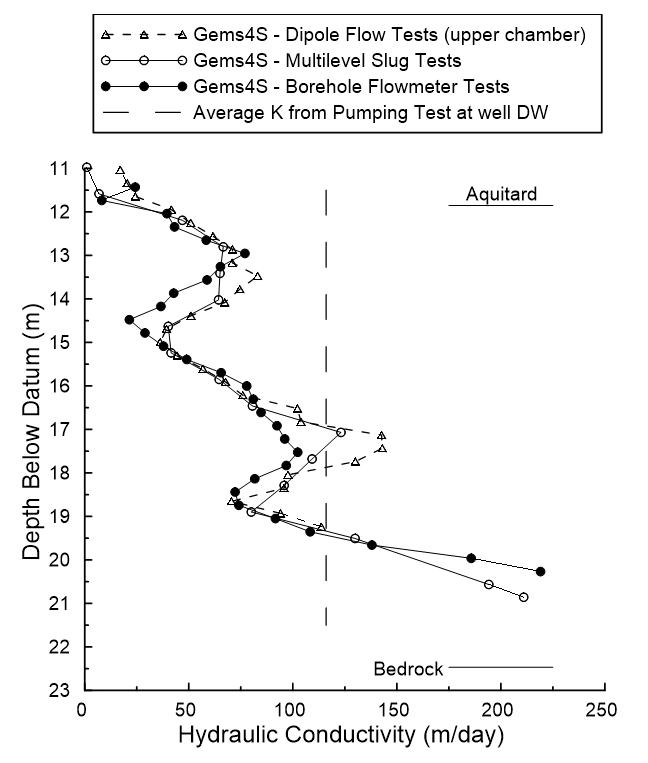
| 14:20, 5 March 2019 | Liu1w2 Fig3.png (file) |  |
49 KB | Debra Tabron | Figure 3. ''K'' estimates from different field methods at GEMS (Butler, 2005). Well DW is located 2 m east of GEMS4S. | 1 |
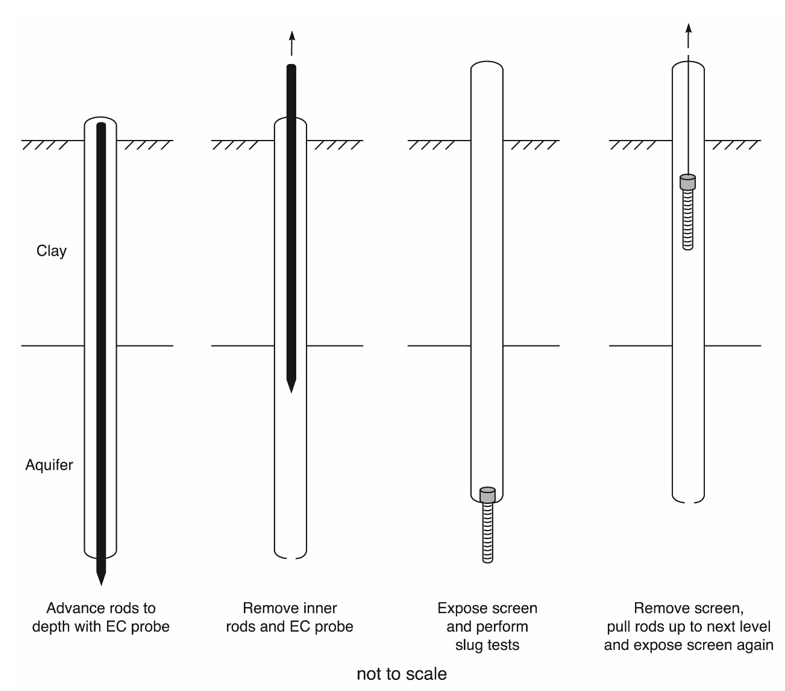
| 14:21, 5 March 2019 | Liu1w2 Fig4.png (file) |  |
59 KB | Debra Tabron | Figure 4. Schematic illustrating hydrostratigraphic profiling, the combination of electrical conductivity (EC) and multilevel slug test profiling (Sellwood et al., 2005). | 1 |
| 14:27, 5 March 2019 | Liu1w2 Fig5.png (file) |  |
75 KB | Debra Tabron | Figure 5. Schematic diagram showing the borehole flowmeter profiling procedure (Molz et al., 1989). | 1 |
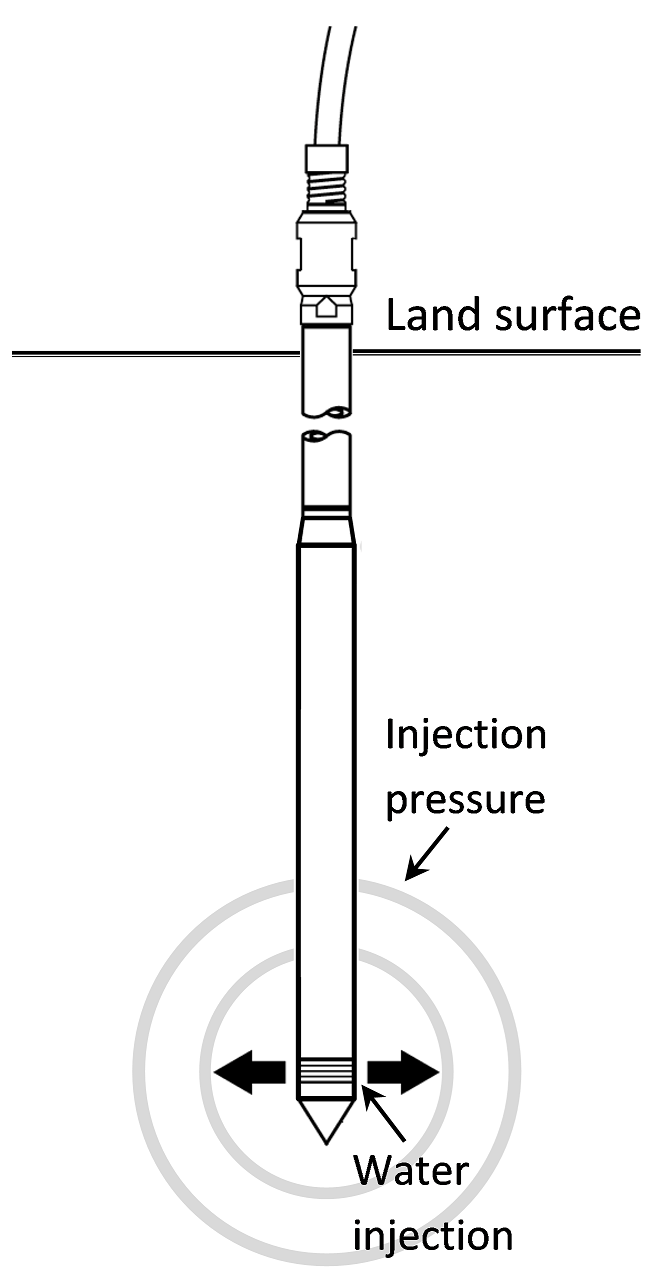
| 14:29, 5 March 2019 | Liu1w2 Fig6A.png (file) |  |
64 KB | Debra Tabron | Figure 6A. Schematic of the DPIL with a screen attached to the probe rod at its lower end (Liu et al., 2012). | 1 |
| 14:30, 5 March 2019 | Liu1w2 Fig6B.png (file) |  |
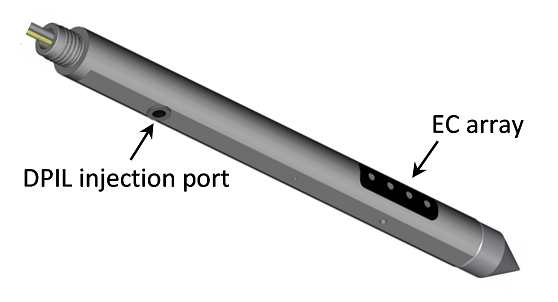
44 KB | Debra Tabron | Figure 6B. Artistic rendering of the HPT (continuous DPIL probe combined with an EC Wenner array) (Lessoff et al., 2010). | 1 |
| 14:31, 5 March 2019 | Liu1w2 Fig6C.png (file) |  |
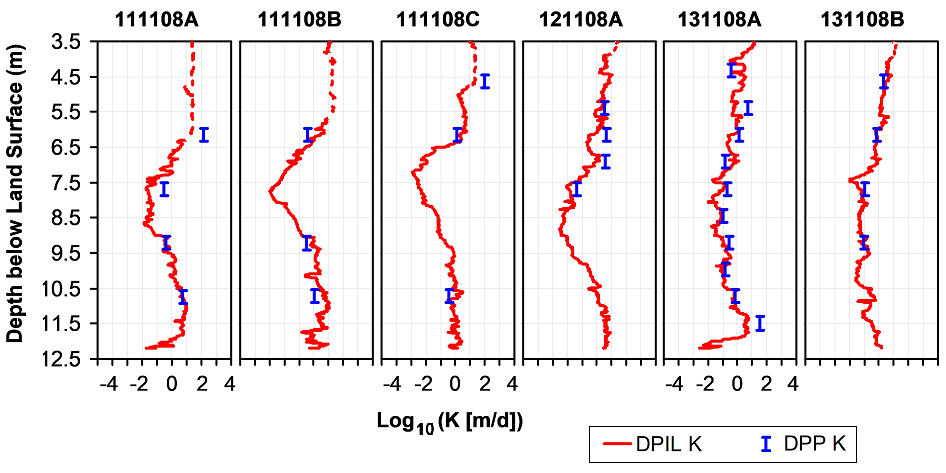
81 KB | Debra Tabron | Figure 6C. Six example DPIL (red curve) ''K'' profiles calibrated by collocated Direct Push Permeameter tests (blue bars) at the MacroDispersion Experiment (MADE) site, Columbus, MS. The dashed curves represent the upper ''K'' limit for continuous DPIL... | 1 |
| 14:33, 5 March 2019 | Liu1w2 Fig7B.png (file) |  |
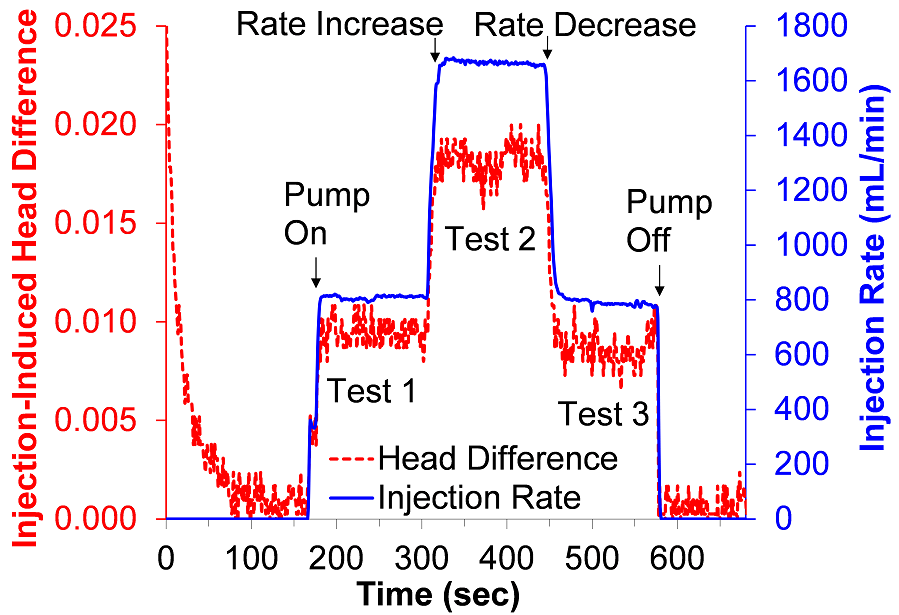
123 KB | Debra Tabron | Figure 7B. Example DPP test sequence at GEMS (Liu et al., 2012) | 1 |
| 14:34, 5 March 2019 | Liu1w2 Fig8.png (file) |  |
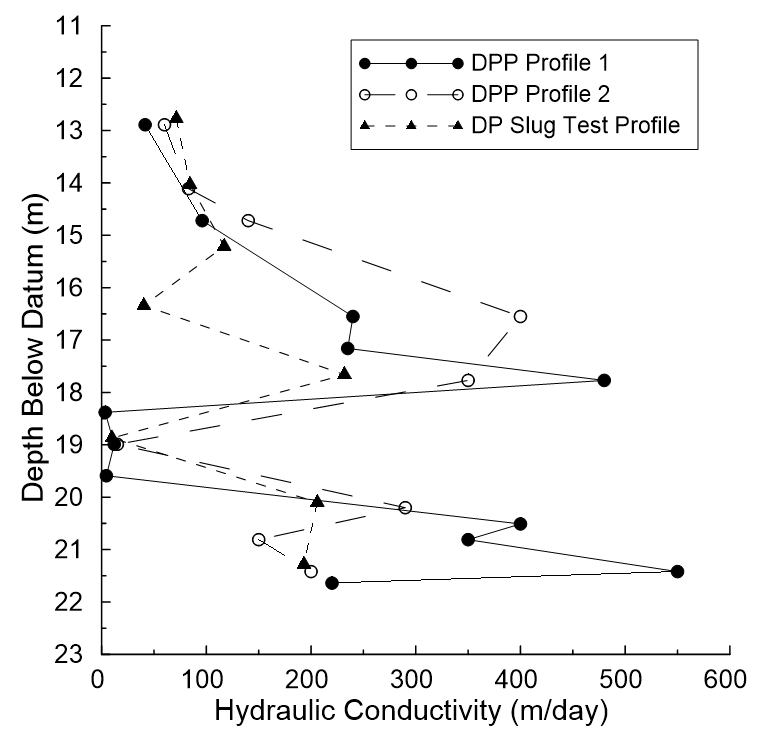
39 KB | Debra Tabron | Figure 8. Comparison of DPP and DP multilevel slug test ''K'' profiles at GEMS. The slug test profile is located 2 m northwest of DPP profile 1, and 2 m southeast of DPP profile 2. (Butler, 2005) | 1 |
| 14:35, 5 March 2019 | Liu1w2 Fig9A.png (file) |  |
88 KB | Debra Tabron | Figure 9A. Measurement domain around a NMR borehole probe. | 1 |
| 14:36, 5 March 2019 | Liu1w2 Fig9B.png (file) |  |
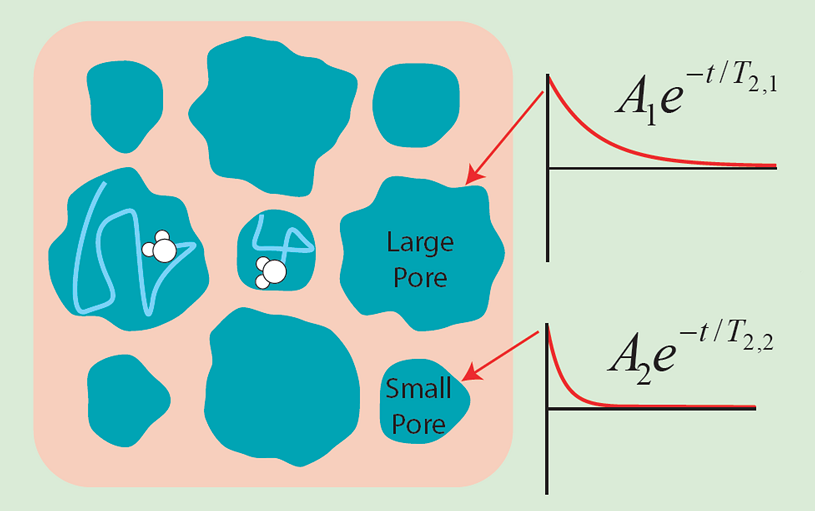
113 KB | Debra Tabron | Figure 9B. NMR responses as a function of pore size, where ''A'' is the initial magnetization, T<sub>2</sub> is NMR relaxation time. (Grunewald et al., 2011) | 1 |
| 14:37, 5 March 2019 | Liu1w2 Fig9C.png (file) |  |
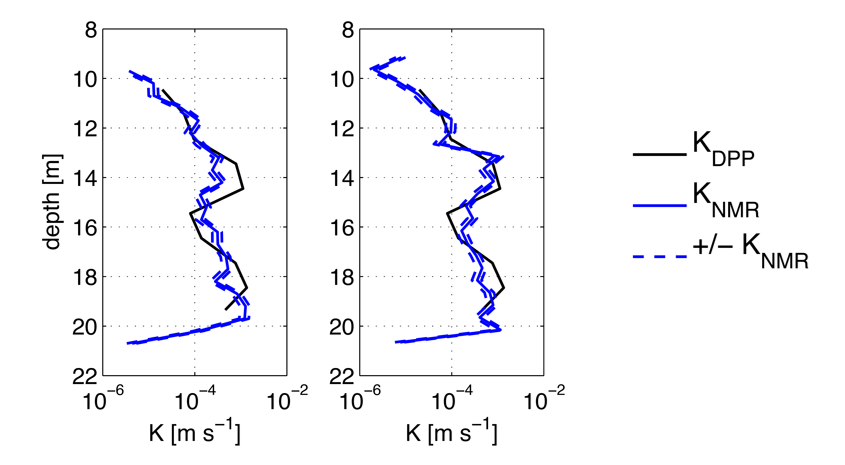
56 KB | Debra Tabron | Figure 9C. Comparison of NMR and DPP ''K'' estimates at two GEMS locations. The dash lines show the range of the NMR ''K'' estimates due to the uncertainty in the empirical parameters used in the pore size - ''K'' relationship. (Knight et al., 2016) | 1 |
| 16:26, 6 March 2019 | 2000-Yeh-Hydraulic Tomography..Development of a new aquifer test method.pdf (file) | 1.37 MB | Debra Tabron | Yeh, T.C.J., and S. Liu. 2000. Hydraulic tomography: Development of a new aquifer test method. Water Resources Research 36, no. 8: 2095-2105. | 1 |