File list
This special page shows all uploaded files.
| Date | Name | Thumbnail | Size | User | Description | Versions |
|---|---|---|---|---|---|---|
| 16:41, 15 July 2019 | 2010-Sherene-Mobility and transport of heavy metals i.pdf (file) | 153 KB | Debra Tabron | 28. Sherene T. (2010) Mobility and transport of heavy metals in polluted soil environment. Biological Forum – An International Journal. 2, 2, 112-121. | 1 | |
| 10:53, 16 July 2019 | 2011-Iyaka-Nickel in soils. A review of its distribution and impacts.pdf (file) | 100 KB | Debra Tabron | Iyaka Y.A. (2011) Nickel in soils: A review of its distribution and impacts. Scientific Research and Essays. 6, 33, 6774-6777. | 1 | |
| 16:12, 16 July 2019 | 2003-Ratnaike-Acute and chronic arsenic toxicity.pdf (file) | 84 KB | Debra Tabron | Ratnaike R.N. (2003) Acute and chronic arsenic toxicity. Postgrad. Med. J. 79, 933, 391-396. | 1 | |
| 08:51, 17 July 2019 | 2014-Mgmt of the Environmental Impact of Shooting Ranges The Finished Env..pdf (file) | 9.8 MB | Debra Tabron | Management of the Environmental Impact of Shooting Ranges, the Finnish Environment, | 1 | |
| 09:11, 17 July 2019 | Barker1w2 Fig1.png (file) |  |
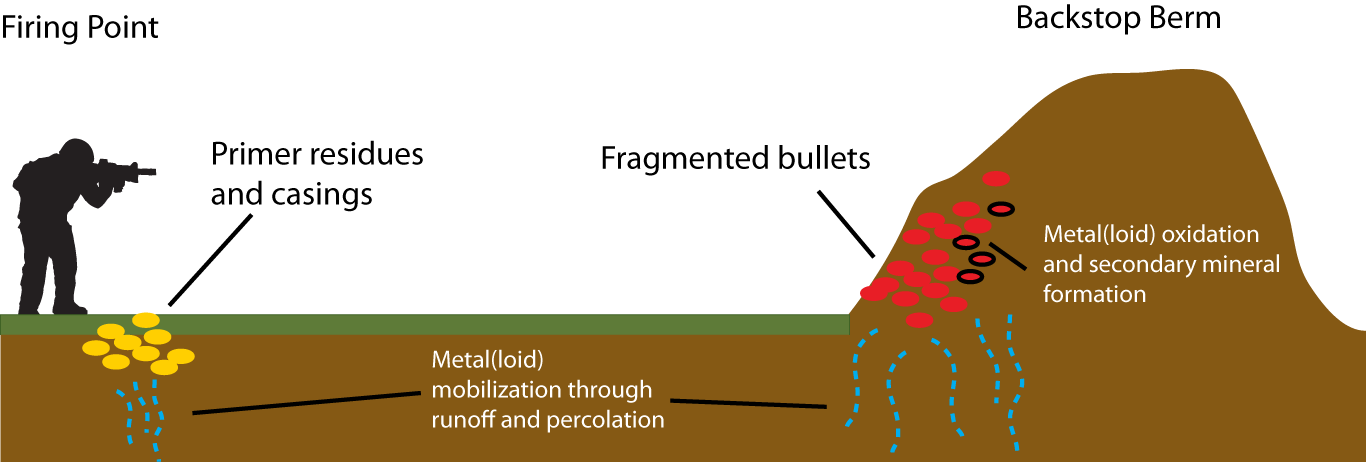
57 KB | Debra Tabron | Figure 1. Simplified schematic of shooting ranges with berm-style backstops that typically contain high loadings of metal(loid)s in the berm due to bullet fragmentation and also at the firing point as a result of residue and primer materials. | 1 |
| 09:12, 17 July 2019 | Barker1w2 Fig2.png (file) |  |
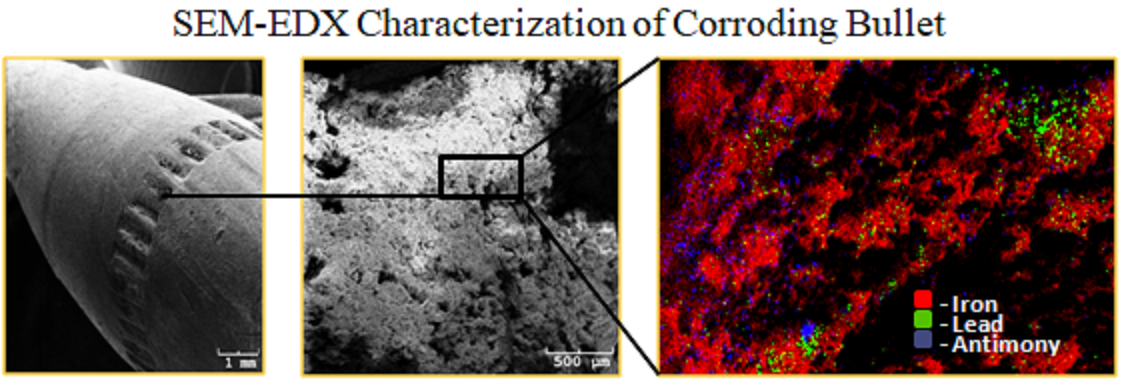
472 KB | Debra Tabron | Figure 2. Chemical characterization of a 5.56mm corroding bullet that underwent 15 years of weathering in Alaskan soils using scanning electron microscopy (SEM) and energy dispersive x-ray analysis (EDX). Relative concentrations for iron (red), lead (g... | 1 |
| 09:13, 17 July 2019 | Barker1w2 Fig3.png (file) |  |
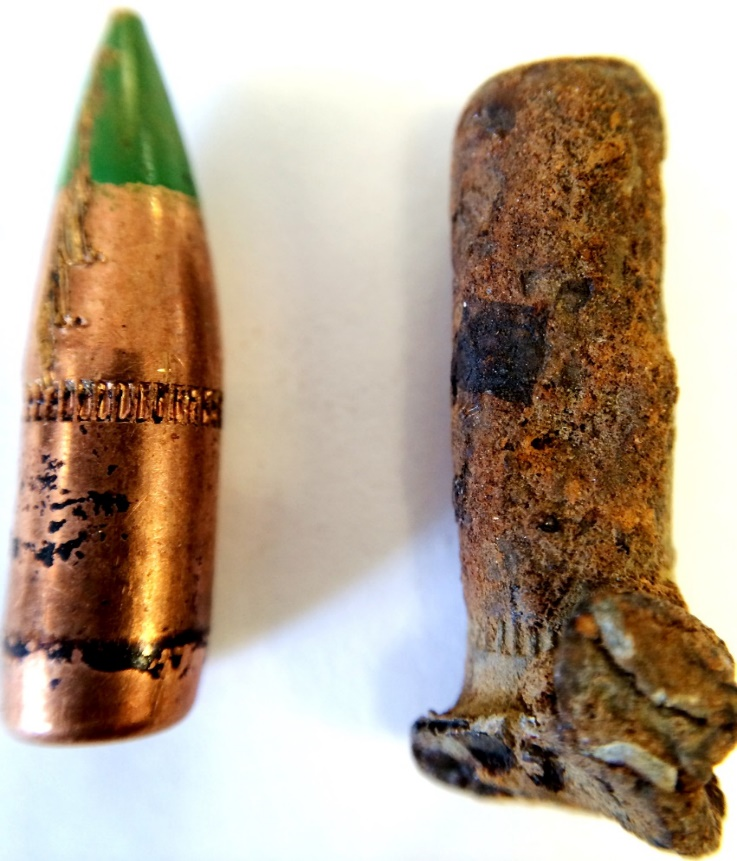
880 KB | Debra Tabron | Figure 3. Optical images of a new 5.56mm bullet (left) and a 5.56mm bullet that weathered for 15 years (right). The tip of the bullet fragmented and the weathering crust can be hundreds of microns thick and comprised of secondary mineral phases. Photo... | 1 |
| 09:14, 17 July 2019 | Barker1w2 Fig4.png (file) |  |
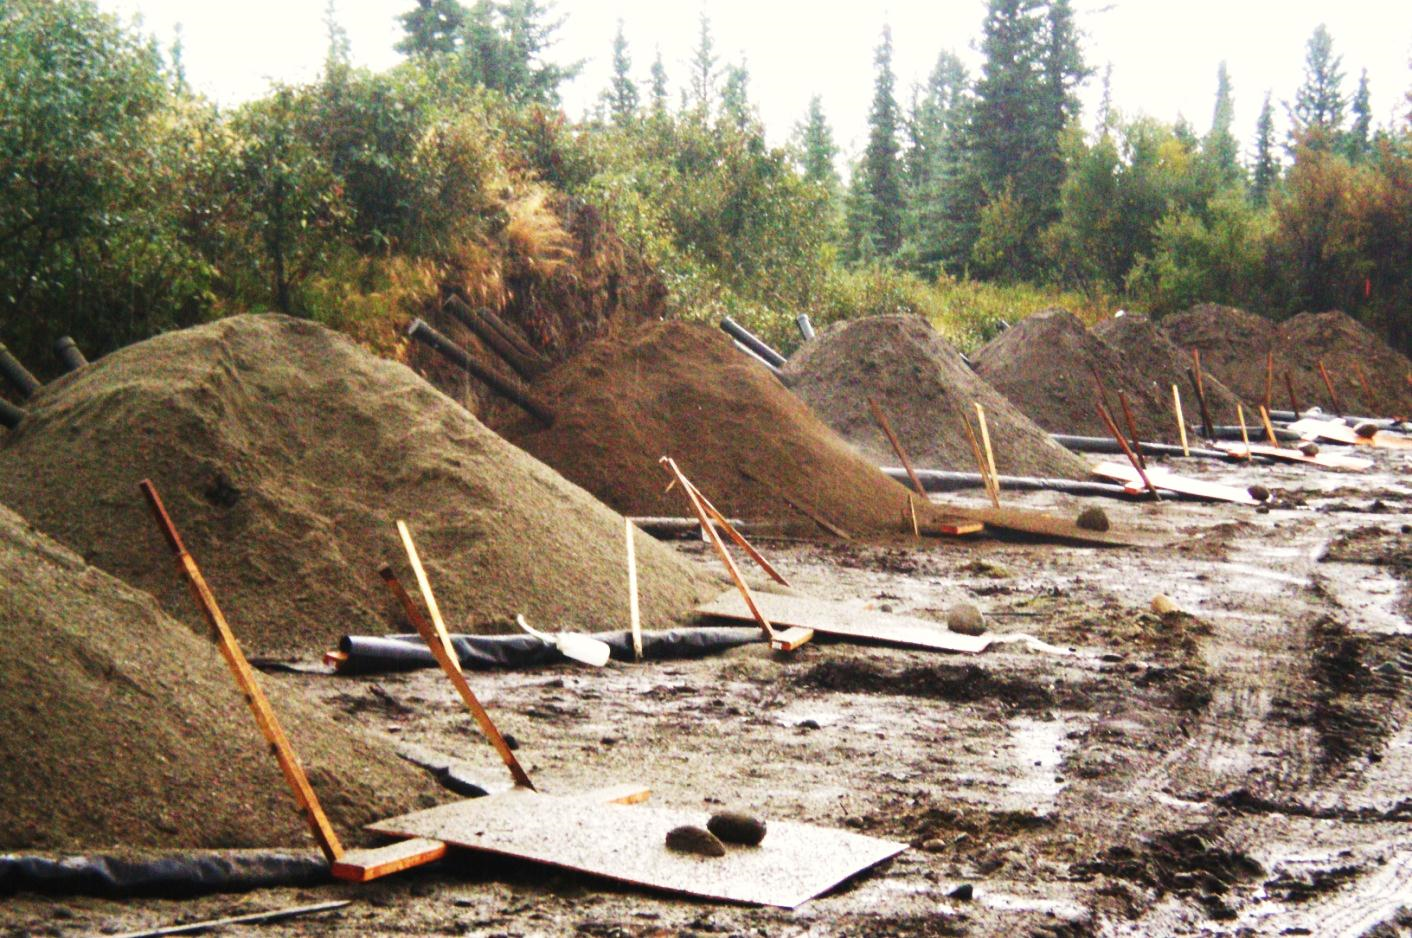
3.36 MB | Debra Tabron | Figure 4. Soil berms with high amounts of soil organic matter and clay minerals as shown in this picture tend to retain concentrations of metal(loid)s as a result of large surface area and active binding sites. Image shows constructed shooting range be... | 1 |
| 12:29, 3 August 2019 | NASZ featured 1.jpg (file) |  |
124 KB | Admin | 1 | |
| 12:30, 3 August 2019 | NASZ featured 2.jpg (file) |  |
66 KB | Admin | 1 | |
| 10:12, 14 August 2019 | 2017Adamson et al ER-2307.pdf (file) | 29.84 MB | Jhurley | 1 | ||
| 11:21, 14 August 2019 | 14D Plume Length.mp4 (file) | 19.35 MB | Jhurley | 1 | ||
| 12:10, 14 August 2019 | RemediationPerformance.mp4 (file) | 64.9 MB | Jhurley | 1 | ||
| 10:01, 16 August 2019 | Griffiths1w2 Fig1.png (file) |  |
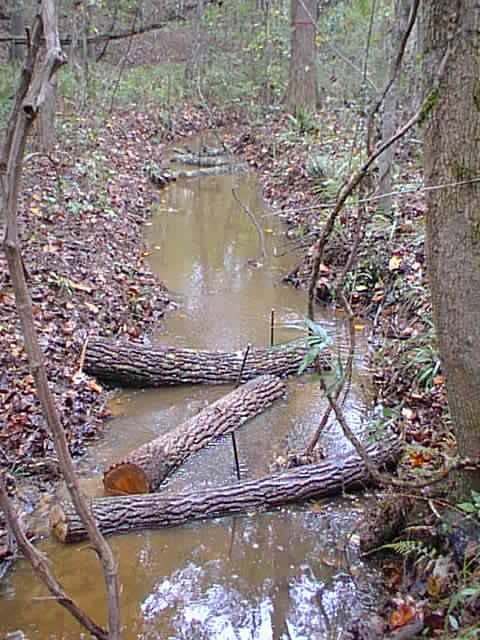
818 KB | Debra Tabron | Figure 1. CWD additions shortly after installation in a stream. | 1 |
| 10:01, 16 August 2019 | Griffiths1w2 Fig2.png (file) |  |
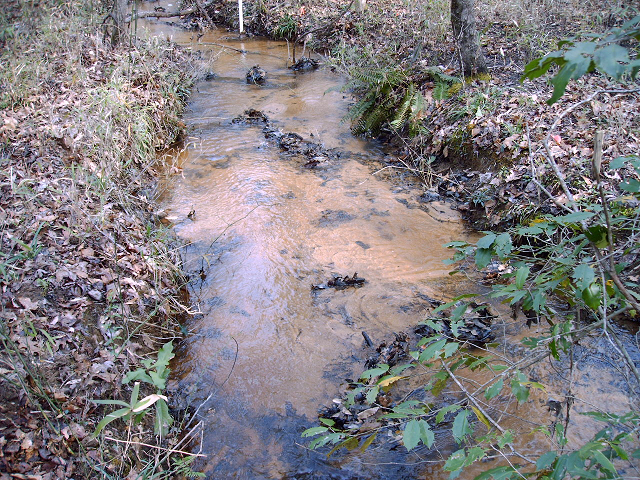
903 KB | Debra Tabron | Figure 2. Burial of CWD dams in a restored stream. (Photo taken in March 2006.) | 1 |
| 15:30, 16 August 2019 | 2006-Mulholland-Riparian Ecosystem Mgmt at Miitary Installations.pdf (file) | 1.97 MB | Debra Tabron | Mulholland, P.J., Feminella, J.W., Lockaby, B.G. and Hollon, G.L., 2007. Riparian Ecosystem Management at Military Installations: Determination of Impacts and Evaluation of Restoration and Enhancement Strategies. Final Technical Report SI-1186. Pp.161. | 1 | |
| 16:45, 28 August 2019 | 1995-Patt-Microbial degradation of chemical pollutants.pdf (file) | 551 KB | Debra Tabron | Patt, T.E. and Abebe, H.M., Upjohn Co, 1995. Microbial degradation of chemical pollutants. U.S. Patent 5,399,495. | 1 | |
| 14:44, 7 October 2019 | Griffiths1w2a Fig3.png (file) |  |
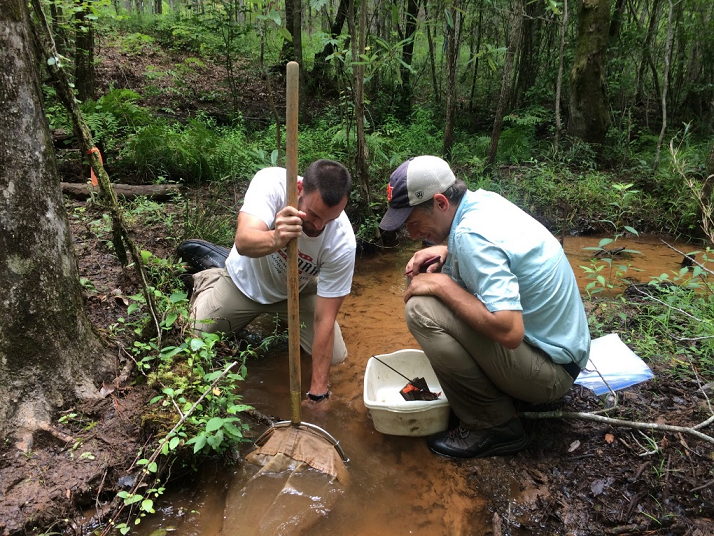
905 KB | Debra Tabron | Figure 3. Collection of macroinvertebrates in one of the study streams. | 1 |
| 14:47, 7 October 2019 | Griffiths1w2a Fig4.png (file) |  |
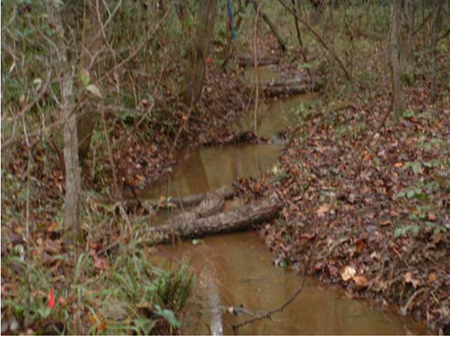
312 KB | Debra Tabron | CWD dams immediately after restoration. From Mulholland et al. 2007 | 1 |
| 14:52, 7 October 2019 | Griffiths1w2a Fig5.png (file) |  |
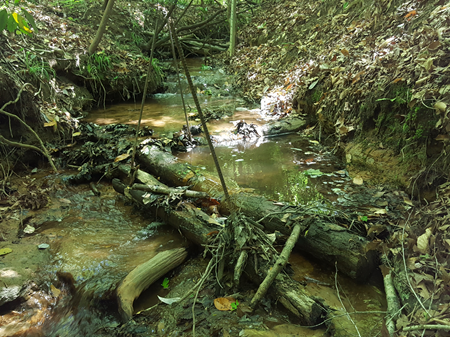
395 KB | Debra Tabron | CWD dams 14 years after restoration. These two images were not taken in the same location but rather are used to illustrate the condition of CWD additions immediately after and 14-years after restoration. Photo by Sam Bickley | 1 |
| 17:06, 15 October 2019 | Mahendra1w2 Fig1.png (file) |  |
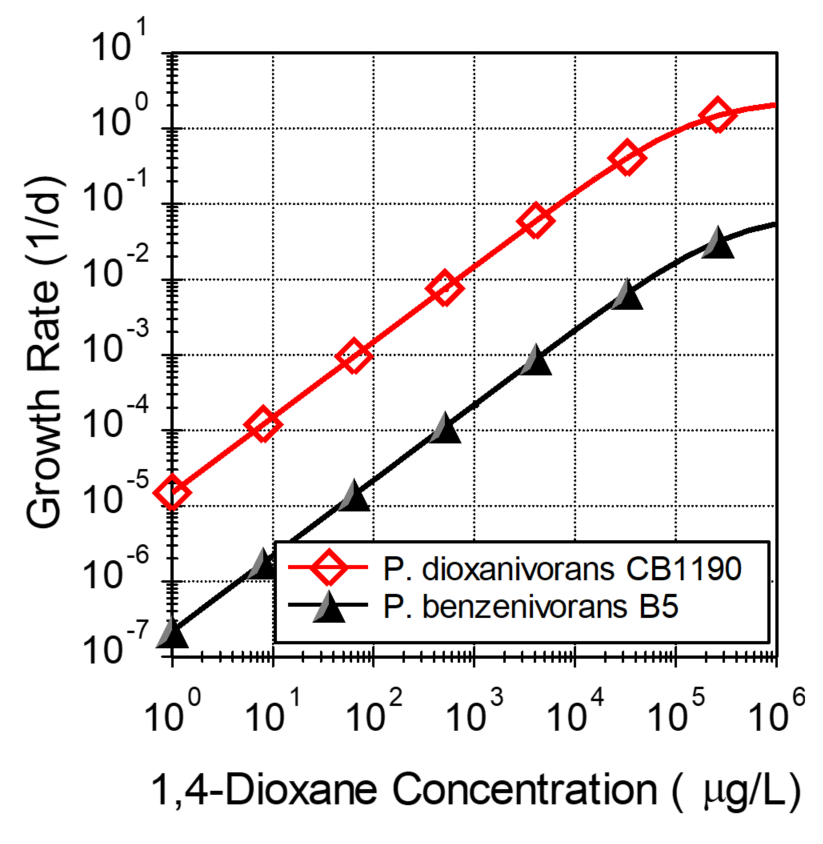
140 KB | Debra Tabron | Figure 1. Growth rates of two 14D metabolizers versus 14D concentration | 1 |
| 16:51, 17 October 2019 | ER-1422-FR (002).pdf (file) | 2.87 MB | Debra Tabron | ER-1422: Biodegradation of 1,4-Dioxane | 1 | |
| 15:17, 19 October 2019 | ISCO featured 1.png (file) |  |
63 KB | Admin | 1 | |
| 19:52, 23 October 2019 | 2018-Falta-REMChlor Modeling Matrix Diffusion Effects.pdf (file) | 2.69 MB | Admin | 1 | ||
| 15:57, 29 October 2019 | 2009-Magar-Technical Guide.pdf (file) | 22.01 MB | Debra Tabron | Magar, V.S., Chadwick, D.B., Bridges, T.S., Fuchsman, P.C., Conder, J.M., Dekker, T.J., Steevens, J.A., Gustavson, K.E. and Mills, M.A., 2009. Monitored natural recovery at contaminated sediment sites. ENVIRON INTERNATIONAL CORP ARLINGTON VA. | 1 | |
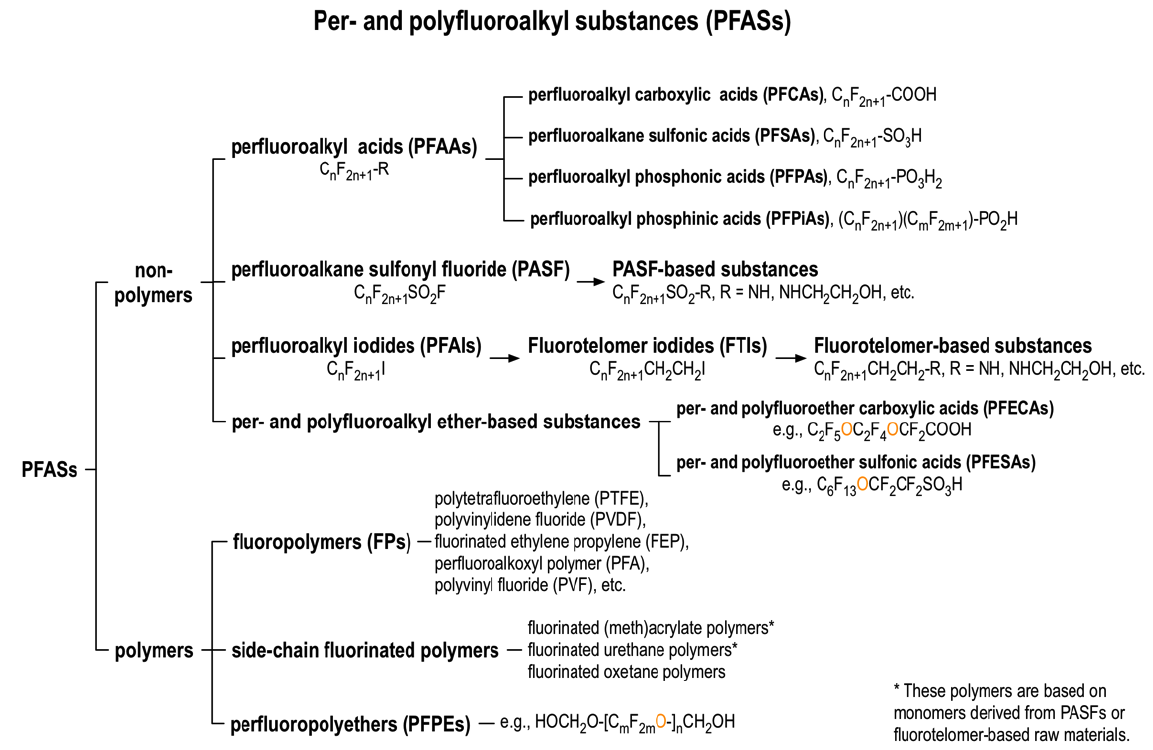
| 16:18, 29 October 2019 | PFASupdate2019Fig1.png (file) |  |
204 KB | Jhurley | 1 | |
| 12:02, 31 October 2019 | ITRCfactSheetPFAS.png (file) |  |
130 KB | Jhurley | 1 | |
| 12:41, 5 November 2019 | Falta1w2 Fig1.png (file) |  |
163 KB | Debra Tabron | Figure 1: Spread of CVOCs in the subsurface | 1 |
| 12:42, 5 November 2019 | Falta1w2 Fig2.png (file) |  |
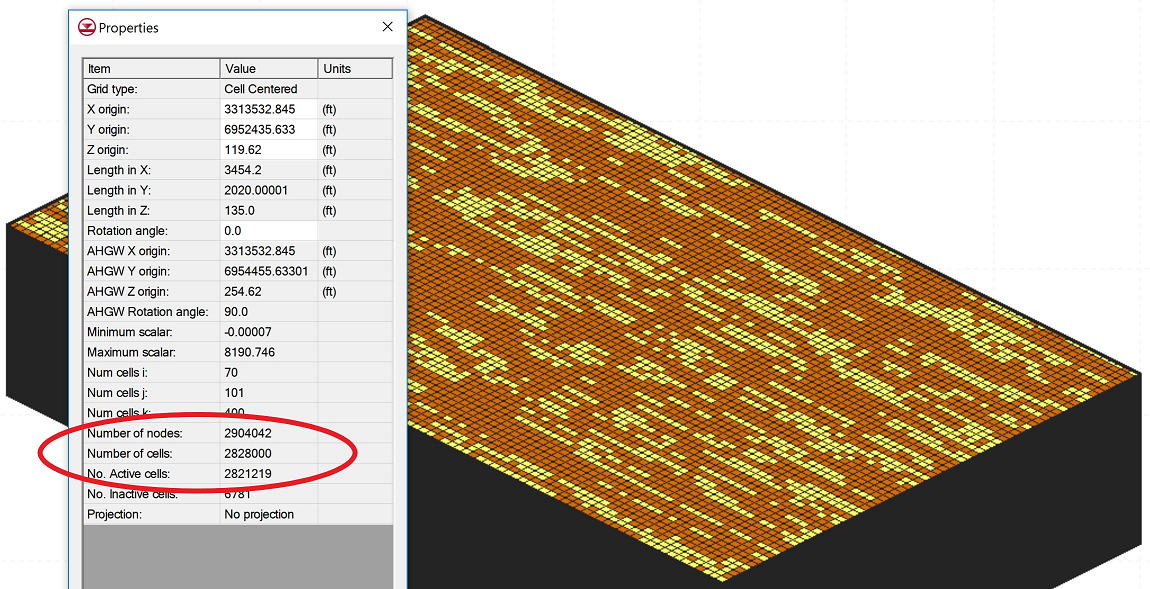
927 KB | Debra Tabron | Figure 2: A typical fine grid model capable of simulating matrix diffusion. | 1 |
| 12:44, 5 November 2019 | Falta1w2 Fig3.png (file) |  |
68 KB | Debra Tabron | Figure 3: Concentration profiles in fractures at 1, 49, 51 and 100 years. | 1 |
| 12:45, 5 November 2019 | Falta1w2 Fig4.png (file) |  |
57 KB | Debra Tabron | Figure 4: Simulated mass discharge at downstream edge of fine-grid MT3DMS and REMChlore-MDmodels. | 1 |
| 12:47, 5 November 2019 | Falta1w2 Fig5.png (file) |  |
171 KB | Debra Tabron | Figure 5: Top view (xy) of concentration contours computed with the fine-grid numerical model (top) and with REMChlor-MD (bottom) at 30 years. | 1 |
| 12:50, 5 November 2019 | Falta1w2 Fig6.png (file) |  |
156 KB | Debra Tabron | Figure 6: Top view (''xy'') of concentration contours computed with the fine-grid numerical model (top) and with REMChlor-MD (bottom) at 130 years. | 1 |
| 15:11, 5 November 2019 | Falta1w2 Fig2.PNG (file) |  |
261 KB | Debra Tabron | 1 | |
| 17:57, 11 November 2019 | Falta1w2 Fig7.mp4 (file) | 39.59 MB | Debra Tabron | Figure 7: Video tutorial demonstrating use of REMChlor-MD. | 1 | |
| 12:59, 13 November 2019 | Hall1w2Fig1.png (file) |  |
901 KB | Debra Tabron | Figure 1. Phytoplankton come in many shapes and sizes | 1 |
| 13:00, 13 November 2019 | Hall1w2Fig2.png (file) |  |
109 KB | Debra Tabron | Figure 1. Phytoplankton come in many shapes and sizes | 1 |
| 13:01, 13 November 2019 | Hall1w2Fig3.png (file) |  |
443 KB | Debra Tabron | Figure 3. Diagram showing the eutrophication process. | 1 |
| 16:16, 13 November 2019 | Falta1w2 Fig7.png (file) |  |
289 KB | Jhurley | 1 | |
| 17:07, 13 November 2019 | 1999-Bricker-National Estuarine Eutrophication Assessment.pdf (file) | 3.61 MB | Debra Tabron | Bricker, S.B., Clement, C.G., Pirhalla, D.E., Orlando, S.P., Farrow, D.R.G. 1999. National Estuarine Eutrophication Assessment: Effects of nutrient enrichment in the Nation’s estuaries. Silver Spring: NOAA, National Ocean Service, Special Projects Of... | 1 | |
| 11:05, 14 November 2019 | Beckley1w2 Fig3a.png (file) |  |
260 KB | Jhurley | 1 | |
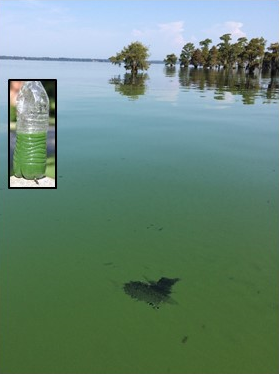
| 18:14, 18 November 2019 | 2016-Olson-Evaluating the effectiveness of water remediation techniques.pdf (file) | 491 KB | Debra Tabron | Olson, I., 2016. Evaluating the effectiveness of water remediation techniques for nutrient reduction and the control of cyanobacteria blooms in municipal drinking water reservoirs in the SE United States. | 1 | |
| 17:12, 22 November 2019 | 2011-ITRC incorporating bioavailability Considerations into the Evaluation of Contaminated Sediment Sites.pdf (file) | 5.53 MB | Debra Tabron | ITRC, 2011. Incorporating Bioavailability Considerations into the Evaluation of Contaminated Sediment Sites, accessed 29 August 2019 | 1 | |
| 17:29, 22 November 2019 | 2019-SERDP ESTCP-Managing Contaminated Sediments.pdf (file) | 210 KB | Debra Tabron | SERDP/ESTCP Managing Contaminated Sediments, accessed 29 August 2019. | 1 | |
| 17:40, 22 November 2019 | 1998-USEPA-EPA Contaminated Sediment Mgmt Strategy.pdf (file) | 6.31 MB | Debra Tabron | USEPA, 1998. EPA’s Contaminated Sediment Management Strategy. EPA-823-R-98-001. | 1 | |
| 11:55, 25 November 2019 | 2002-USEPA- Principles for Managing Contaminated Sediment Risks at Hazardous Waste Sites.pdf (file) | 733 KB | Debra Tabron | USEPA, 2002. Principles for Managing Contaminated Sediment Risks at Hazardous Waste Sites. OSWER Directive 9285.6–08. | 1 | |
| 12:10, 25 November 2019 | 2005-USEPA-Contaminated Sediment Remediation Guidance for Hazardous Waste Sites.pdf (file) | 2.98 MB | Debra Tabron | USEPA, 2005. Contaminated Sediment Remediation Guidance for Hazardous Waste Sites. EPA-540-R-05-012. OSWER 9355.0-85. | 1 | |
| 12:18, 25 November 2019 | 2017-USEPA-Contaminated Sediment Remediation Guidance for Hazardous Waste Sites.pdf (file) | 5.76 MB | Debra Tabron | USEPA, 2017. Remediating Contaminated Sediment Sites - Clarification of Several Key Remedial Investigation/Feasibility Study and Risk Management Recommendations, and Updated Contaminated Sediment Technical Advisory Group Operating Procedures. OLEM Dire... | 1 | |
| 17:50, 25 November 2019 | Ghosh1w2Fig3.png (file) |  |
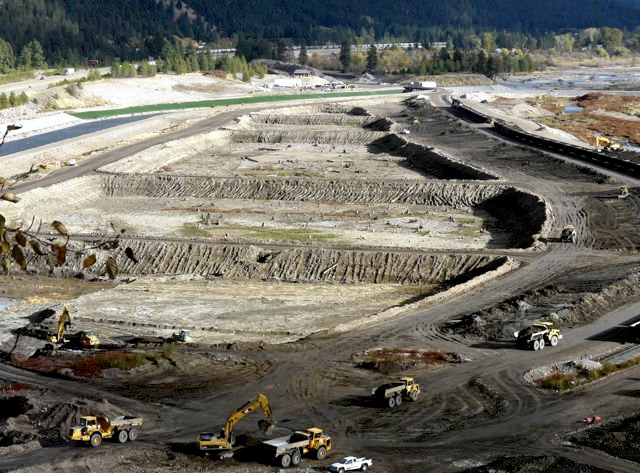
735 KB | Debra Tabron | Figure 3. Sediment removal being conducted at the Milltown Reservoir Sediments Superfund Site in Missoula County, Montana. | 1 |
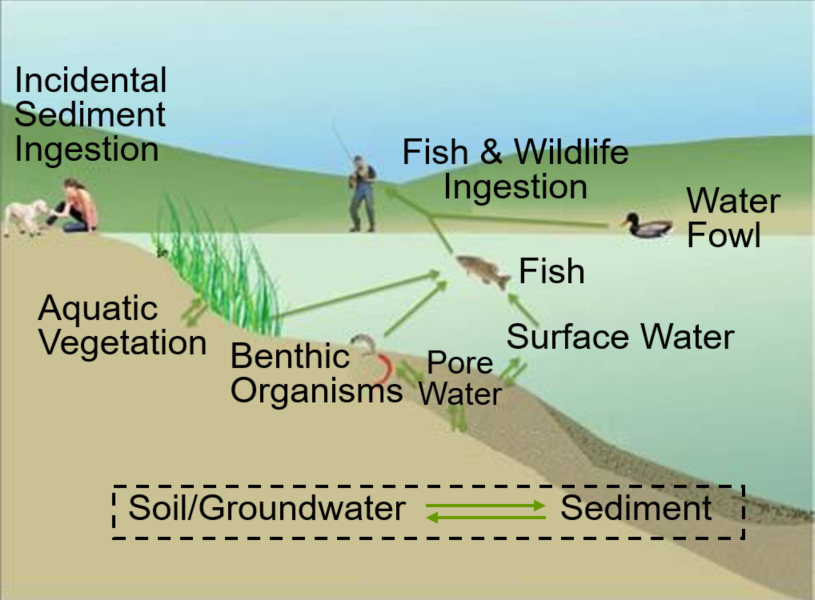
| 16:46, 12 December 2019 | Ghosh1w2Fig1.png (file) |  |
349 KB | Jhurley | 2 |