|
|
| Line 1: |
Line 1: |
| − | ==Downscaled High Resolution Datasets for Climate Change Projections== | + | ==PFAS Leaching Characterization with the Leaching Environmental Assessment Framework (LEAF)== |
| − | Global climate models (GCMs) have generated projections of temperature, precipitation and other important climate change parameters with spatial resolutions of 100 to 300 km. However, higher spatial resolution information is required to assess threats to individual installations or regions. A variety of “downscaling” approaches have been used to produce high spatial resolution output (datasets) from the global climate models at scales that are useful for evaluating potential threats to critical infrastructure at regional and local scales. These datasets enable development of information about projections produced from various climate models, about downscaling to achieve desired locational specificity, and about selecting the appropriate dataset(s) to use for performing specific assessments. This article describes how these datasets can be accessed and used to evaluate potential climate change impacts.
| + | [[Wikipedia: Firefighting_foam#Synthetic_foams | Aqueous film-forming foams (AFFFs)]] are a major source of [[Perfluoroalkyl and Polyfluoroalkyl Substances (PFAS) | per- and poly-fluoroalkyl substances (PFAS)]] impacts in soil and groundwater. Standardized tools are needed to rapidly assess the potential for retention, leaching, and transport of PFAS from the source zone to downgradient regions, so that this information can be applied towards critical facets of site management such as prioritizing PFAS-impacted sites for further investigation and remediation. Existing standard leaching methods were developed prior to concerns regarding PFAS. Therefore, studies are needed to ensure that leaching methods are compatible for use with PFAS and that resulting data are representative of the risk of PFAS leaching at impacted sites. |
| | <div style="float:right;margin:0 0 2em 2em;">__TOC__</div> | | <div style="float:right;margin:0 0 2em 2em;">__TOC__</div> |
| | | | |
| | '''Related Article(s):''' | | '''Related Article(s):''' |
| − | * [[Climate Change Primer]]
| |
| | | | |
| − | '''Contributor(s):''' [[Dr. Rao Kotamarthi]]
| + | *[[Perfluoroalkyl and Polyfluoroalkyl Substances (PFAS)]] |
| | + | *[[PFAS Sources]] |
| | + | *[[PFAS Transport and Fate]] |
| | | | |
| − | '''Key Resource(s):''' | + | '''Contributors:''' Dr. Jennifer L. Guelfo, Dr. David Kosson, Dr. Andy Garrabrants, Ms. Fangfei Liu, Mr. Darlington Yawson, Dr. Md. Isreq Real |
| − | * Use of Climate Information for Decision-Making and Impacts Research: State of our Understanding<ref name="Kotamarthi2016">Kotamarthi, R., Mearns, L., Hayhoe, K., Castro, C.L., and Wuebble, D., 2016. Use of Climate Information for Decision-Making and Impacts Research: State of Our Understanding. Department of Defense, Strategic Environmental Research and Development Program (SERDP), 55pp. Free download from: [https://www.serdp-estcp.org/content/download/38568/364489/file/Use_of_Climate_Information_for_Decision-Making_Technical_Report.pdf SERDP-ESTCP]</ref>
| |
| | | | |
| − | * Applying Climate Change Information to Hydrologic and Coastal Design of Transportation Infrastructure, Design Practices<ref name="Kilgore2019">Kilgore, R., Thomas, W.O. Jr., Douglass, S., Webb, B., Hayhoe, K., Stoner, A., Jacobs, J.M., Thompson, D.B., Herrmann, G.R., Douglas, E., and Anderson, C., 2019. Applying Climate Change Information to Hydrologic and Coastal Design of Transportation Infrastructure, Design Practices. The National Cooperative Highway Research Program, Transportation Research Board, Project 15-61, 154 pages. Free download from: [http://onlinepubs.trb.org/Onlinepubs/nchrp/docs/NCHRP1561_DesignProcedures.pdf The Transportation Research Board]</ref> | + | '''Key Resources:''' |
| | + | *Development of Leaching Tests for Materials Containing SVOCs and PFAS, EPA 600/R-23/382<ref name="GarrabrantsEtAl2024"/> |
| | | | |
| − | * Statistical Downscaling and Bias Correction for Climate Research<ref name="Maraun2018">Maraun, D., and Wildmann, M., 2018. Statistical Downscaling and Bias Correction for Climate Research. Cambridge University Press, Cambridge, UK. 347 pages. [https://doi.org/10.1017/9781107588783 DOI: 10.1017/9781107588783] ISBN: 978-1-107-06605-2</ref> | + | *[https://www.epa.gov/hw-sw846/leaching-environmental-assessment-framework-leaf-methods-and-guidance Leaching Environmental Assessment Framework (LEAF) Methods and Guidance] (EPA website) |
| | | | |
| − | * Downscaling Techniques for High-Resolution Climate Projections: From Global Change to Local Impacts<ref name="Kotamarthi2021">Kotamarthi, R., Hayhoe, K., Wuebbles, D., Mearns, L.O., Jacobs, J. and Jurado, J., 2021. Downscaling Techniques for High-Resolution Climate Projections: From Global Change to Local Impacts. Cambridge University Press, Cambridge, UK. 202 pages. [https://doi.org/10.1017/9781108601269 DOI: 10.1017/9781108601269] ISBN: 978-1-108-47375-0</ref>
| + | ==Introduction to LEAF== |
| | + | The [https://www.epa.gov/ U.S. Environmental Protection Agency (EPA)] [https://www.epa.gov/hw-sw846/leaching-environmental-assessment-framework-leaf-methods-and-guidance Leaching Environmental Assessment Framework (LEAF)] is a suite of standardized test methods for evaluating contaminant release from solids under environmentally relevant conditions (Table 1). The four leaching methods within LEAF were originally validated for inorganic constituents<ref>Garrabrants, A.C., Kosson, D.S., Stefanski, L., DeLapp, R., Seignette, P.F.A.B., van der Sloot, H.A., Kariher, P., Baldwin, M., 2012. Interlaboratory Validation of the Leaching Environmental Assessment Framework (LEAF) Method 1313 and Method 1316, EPA/600/R-12/623, U.S. Environmental Protection Agency, Air Pollution and Control Division. [[Media: EPA 600_R-12_623.pdf | Free Download EPA 600/R-12/623]]</ref><ref>Garrabrants, A.C., Kosson, D.S., DeLapp, R., Kariher, P., Seignette, P.F.A.B., van der Sloot, H.A., Stefanski, L., Baldwin, M., 2012. Interlaboratory Validation of the Leaching Environmental Assessment Framework (LEAF) Method 1314 and Method 1315, EPA/600/R-12/624, U.S. Environmental Protection Agency, Air Pollution and Control Division. [[Media: EPA 600_R-12_624.pdf | Free Download EPA 600/R-12/624]]</ref> and included as standard leaching methods EPA 1313 – 1316 within Update V of SW-846<ref>USEPA, 2026. Hazardous Waste Test Methods / SW-846. [https://www.epa.gov/hw-sw846 USEPA SW-846 website]</ref>. To address the need for standardized tests to evaluate PFAS leaching and mobility, LEAF methods have been optimized and demonstrated for use with PFAS (Methods 1313A-1316A)<ref name="GarrabrantsEtAl2024">Garrabrants, A.C., Liu, F., Warne, R., DeLapp, R., Brown, L., Rubin, Z., Yawson, D., Kosson, D.S., Guelfo, J.L., Real, M.I., van der Sloot, H.A., Touati, A., Thorneloe, S., 2024. Development of Leaching Tests for Materials Containing SVOCs and PFAS, EPA 600/R-23/382, USEPA, Washington, D.C. [[Media: EPA 600_R-23_382.PDF | Free Download EPA 600/R-23/382]]</ref>. This article will focus on Methods 1313A, 1314A, and 1316A. Demonstration of Method 1315A for compacted granular materials (including concrete and asphalt) is ongoing. |
| | | | |
| − | ==Downscaling of Global Climate Models==
| + | {| class="wikitable" style="float:right; margin-left:10px;" |
| − | Some communities and businesses have begun to improve their resilience to climate change by building adaptation plans based on national scale climate datatsets ([https://unfccc.int/topics/adaptation-and-resilience/workstreams/national-adaptation-plans National Adaptation Plans]), regional datasets ([https://www.dec.ny.gov/docs/administration_pdf/crrafloodriskmgmtgdnc.pdf New York State Flood Risk Management Guidance]<ref name="NYDEC2020">New York State Department of Environmental Conservation, 2020. New York State Flood Risk Management Guidance for Implementation of the Community Risk and Resiliency Act. Free download from: [https://www.dec.ny.gov/docs/administration_pdf/crrafloodriskmgmtgdnc.pdf New York State] [[Media: NewYorkState2020.pdf | Report.pdf]]</ref>), and datasets generated at local spatial resolutions. Resilience to the changing climate has also been identified by the US Department of Defense (DoD) as a necessary part of the installation planning and basing process ([https://media.defense.gov/2019/Jan/29/2002084200/-1/-1/1/CLIMATE-CHANGE-REPORT-2019.PDF DoD Report on Effects of a Changing Climate]<ref name="DoD2019">US Department of Defense, 2019. Report on Effects of a Changing Climate to the Department of Defense. Free download from: [https://media.defense.gov/2019/Jan/29/2002084200/-1/-1/1/CLIMATE-CHANGE-REPORT-2019.PDF DoD] [[Media: DoD2019.pdf | Report.pdf]]</ref>). More than 79 installations were identified as facing potential threats from climate change. The threats faced due to changing climate include recurrent flooding, droughts, desertification, wildfires and thawing permafrost.
| + | |+Table 1. EPA SW-846 methods that comprise the LEAF framework |
| − | | |
| − | Assessing the threats climate change poses at regional and local scales requires data with higher spatial resolution than is currently available from global climate models. Global-scale climate models typically have spatial resolutions of 100 to 300 km, and output from these models needs to be spatially and/or temporally disaggregated in order to be useful in performing assessments at smaller scales. The process of producing higher spatial-temporal resolution climate model output from coarser global climate model outputs is referred to as “downscaling” and results in climate change projections (datasets) at scales that are useful for evaluating potential threats to regional and local communities and businesses. These datasets provide information on temperature, precipitation and a variety of other climate variables for current and future climate conditions under various greenhouse gas (GHG) emission scenarios. There are a variety of web-based tools available for accessing these datasets to evaluate potential climate change impacts at regional and local scales.
| |
| − | | |
| − | ==Methods for Downscaling==
| |
| − | {| class="wikitable" style="float:right; margin-left:10px;text-align:center;" | |
| − | |+Table 1. Two widely used methods for developing downscaled higher resolution climate model projections | |
| | |- | | |- |
| − | !Dynamical Downscaling | + | !Method |
| − | !Statistical Downscaling | + | !Description |
| | |- | | |- |
| − | |Deterministic climate change simulations that output</br>many climate variables with sub-daily information ||Primarily limited to daily temperature and precipitation | + | | 1313 || Liquid-solid partitioning as a function of '''''extract pH''''' using a parallel batch extraction (i.e., equilibrium) procedure (Figure 1) |
| | |- | | |- |
| − | |Computationally expensive; hence, limited number of simulations – both</br>GHG emission scenarios and global climate models downscaled||Computationally efficient; hence, downscaled data typically</br>available for many different global climate models and GHG emission scenarios | + | | 1314 || Liquid-solid partitioning as a function of '''''liquid-solid ratio (L/S)''''' for constituents in solid materials using an up-flow '''''percolation''''' column procedure (Figure 3) |
| | |- | | |- |
| − | |May require additional bias correction||Method incorporates bias correction | + | | 1315 || '''''Mass transfer rates''''' of constituents in monolithic or compacted granular materials using a semi-dynamic tank leaching procedure |
| | |- | | |- |
| − | |Observational data at the downscaled location are not necessary</br>to obtain the downscaled output at the location||Best suited for locations with 30 years or more of observational data | + | | 1316 || Liquid-solid partitioning as a function of '''''L/S''''' using a parallel batch extraction (i.e., '''''equilibrium''''') procedure (Figure 2) |
| | |- | | |- |
| − | |Does not assume stationarity or in other words the model</br>simulates the future regardless of what has happened in the past||Stationarity assumption - assumes that the statistical relationship between global</br>climate model and observations will remain constant in the future | + | | colspan="2" style="background:white;" | Note: Text shown in '''''bold''''' indicates primary condition evaluated in each method. |
| | |} | | |} |
| − | There are two main approaches to downscaling. One method, commonly referred to as “statistical downscaling”, uses the empirical-statistical relationships between large-scale weather phenomena and historical local weather data. In this method, these statistical relationships are applied to output generated by global climate models. A second method uses physics-based numerical models (regional-scale climate models or RCMs) of weather and climate that operate over a limited region of the earth (e.g., North America) and at spatial resolutions that are typically 3 to 10 times finer than the global-scale climate models. This method is known as “dynamical downscaling”. These regional-scale climate models are similar to the global models with respect to their reliance on the principles of physics, but because they operate over only part of the earth, they require information about what is coming in from the rest of the earth as well as what is going out of the limited region of the model. This is generally obtained from a global model. The primary differences between statistical and dynamical downscaling methods are summarized in Table 1.
| |
| − |
| |
| − | It is important to realize that there is no “best” downscaling method or dataset, and that the best method/dataset for a given problem depends on that problem’s specific needs. Several data products based on downscaling higher level spatial data are available ([https://cida.usgs.gov/gdp/ USGS], [http://maca.northwestknowledge.net/ MACA], [https://www.narccap.ucar.edu/ NARCCAP], [https://na-cordex.org/ CORDEX-NA]). The appropriate method and dataset to use depends on the intended application. The method selected should be able to credibly resolve spatial and temporal scales relevant for the application. For example, to develop a risk analysis of frequent flooding, the data product chosen should include precipitation at greater than a diurnal frequency and over multi-decadal timescales. This kind of product is most likely to be available using the dynamical downscaling method. SERDP reviewed the various advantages and disadvantages of using each type of downscaling method and downscaling dataset, and developed a recommended process that is publicly available<ref name="Kotamarthi2016"/>. In general, the following recommendations should be considered in order to pick the right downscaled dataset for a given analysis:
| |
| | | | |
| − | * When a problem depends on using a large number of climate models and emission scenarios to perform preliminary assessments and to understand the uncertainty range of projections, then using a statistical downscaled dataset is recommended. | + | ==Method Development for PFAS== |
| − | * When the assessment needs a more extensive parameter list or is analyzing a region with few long-term observational data, dynamically downscaled climate change projections are recommended. | + | Complete details of the development of LEAF Methods 1313A, 1314A, and 1316A for use with PFAS are available in Garrabrants ''et al.'', 2024<ref name="GarrabrantsEtAl2024"/>. Representative method modifications include: |
| | + | * Materials of construction for experimental apparatus: containers used for leaching vessels (Methods 1313A, 1316A) and column construction materials (Method 1314A) evaluated for background PFAS and PFAS uptake. |
| | + | * Reagents and eluant composition: eluant composition was optimized to use 1 mM CaCl2 to reduce formation of colloidal matter; Method 1313A pH adjustment now conducted with nonoxidizing HCl. |
| | + | * Experimental conditions: Longer equilibration times (e.g., Method 1313, 1316) may be required due to slow desorption kinetics of certain PFAS from soil and organic matrices, implementation of settling to facilitate separation of solids from eluates. |
| | + | * Eluate processing (all methods): Use of centrifugation in lieu of eluate filtering, sonication of bottle prior to eluate subsampling. |
| | | | |
| − | ==Uncertainty in Projections== | + | ==Batch Test Demonstration Studies== |
| − | A primary cause of uncertainty in climate change projections, especially beyond 30 years into the future, is the uncertainty in the greenhouse gas (GHG) emission scenarios used to make climate model projections. The best method of accounting for this type of uncertainty is to apply a climate change model to multiple GHG emission scenarios (see also: [[Wikipedia: Representative Concentration Pathway]]).
| + | PFAS-specific adaptations were tested in batch test demonstration studies, which included triplicate implementation of Methods 1313A and 1316A in four AFFF-impacted site soils. |
| | | | |
| − | The uncertainties in climate projections over shorter timescales, less than 30 years out, are dominated by something known as “internal variability” in the models. Different approaches are used to address the uncertainty from internal variability<ref name="Kotamarthi2021"/>. A third type of uncertainty in climate modeling, known as scientific uncertainty, comes from our inability to numerically solve every aspect of the complex earth system. We expect this scientific uncertainty to decrease as we understand more of the earth system and improve its representation in our numerical models. As discussed in [[Climate Change Primer]], numerical experiments based on global climate models are designed to address these uncertainties in various ways. Downscaling methods evaluate this uncertainty by using several independent regional climate models to generate future projections, with the expectation that each of these models will capture some aspects of the physics better than the others, and that by using several different models, we can estimate the range of this uncertainty. Thus, the commonly accepted methods for accounting for uncertainty in climate model projections are either using projections from one model for several emission scenarios, or applying multiple models to project a single scenario.
| + | [[File: GuelfoFig1.png | thumb | 500 px | Figure 1: Figure 1. a) Overview of LEAF Method 1313A and b) PFHxS leaching as a function of pH<ref name="GarrabrantsEtAl2024"/>. Definitions: lower limit of quantification (LLOQ) and method detection limit (MDL)]] |
| | + | '''Draft Method 1313A''' was used to evaluate pH-dependent leaching in PFAS-contaminated soils in parallel batch extractions where each set of batch reactors is prepared and equilibrated at different pH (Figure 1). Short-chain PFAS (≤6 fluorinated carbons) generally showed little to no variation in leaching across the tested pH range of 2-13 (e.g., [[Wikipedia: Perfluorohexanesulfonic acid | PFHxS]], Figure 1), whereas long-chain PFAS exhibited increased leaching at higher pH<ref name="GarrabrantsEtAl2024"/>. This trend is consistent with previous findings showing that soil-water partitioning coefficients (''K<sub>d</sub>'') decrease as pH increases (e.g., Higgins and Luthy 2006)<ref name="HigginsLuthy2006">Higgins, C.P., Luthy, R.G., 2006. Sorption of Perfluorinated Surfactants on Sediments. Environmental Science and Technology, 40(23), pp. 7251–7256. [https://doi.org/10.1021/es061000n doi: 10.1021/es061000n]</ref>. The most pronounced pH effects were observed for perfluoroalkyl sulfonamides (FASAs) such as [[Wikipedia: Perfluorooctanesulfonamide | perfluorooctane sulfonamide (FOSA)]], which transition from neutral to anionic forms within the circumneutral pH range (~pH 6). The anionic form has a lower ''K<sub>d</sub>'' and results in higher leaching concentrations<ref name="GarrabrantsEtAl2024"/><ref name="NguyenEtAl2020">Nguyen, T.M.H., Bräunig, J., Thompson, K., Thompson, J., Kabiri, S., Navarro, D.A., Kookana, R.S., Grimison, C., Barnes, C.M., Higgins, C.P., McLaughlin, M.J., Mueller, J.F., 2020. Influences of Chemical Properties, Soil Properties, and Solution pH on Soil–Water Partitioning Coefficients of Per- and Polyfluoroalkyl Substances (PFASs). Environmental Science and Technology, 54(24), pp. 15883–15892. [https://doi.org/10.1021/acs.est.0c05705 doi: 10.1021/acs.est.0c05705] [[Media: NguyenEtAl2020.pdf | Open Access Article]]</ref>. For many site management scenarios where pH is circumneutral, variations in anionic PFAS leaching are expected to be small over the relevant pH range. In such cases, when testing time and costs are primary considerations, Method 1313A may be a lower priority relative to evaluating leaching as a function of L/S (Method 1316A, Method 1314A). Different considerations may be needed where FASAs or PFAS with multiple, ionizable functional groups (i.e., [[Wikipedia: Zwitterion | zwitterions]]) are of concern. |
| | | | |
| − | A comparison of the currently available methods and their characteristics is provided in Table 2 (adapted from Kotamarthi et al., 2016<ref name="Kotamarthi2016"/>). The table lists the various methodologies and models used for producing downscaled data, and the climate variables that these methods produce. These datasets are mostly available for download from the data servers and websites listed in the table and in a few cases by contacting the respective source organizations.
| + | [[File: GuelfoFig2.png | thumb | 500 px | Figure 2: a) Overview of LEAF Method 1316A and b) PFHxS leaching as a function of L/S ratio evaluated in parallel batch leaching vessels<ref name="GarrabrantsEtAl2024"/>]] |
| | + | '''Draft Method 1316A''' was used to evaluate L/S-dependent leaching of PFAS in impacted soils using parallel batch extractions where each set of batch reactors is prepared and equilibrated at a different L/S. (Figure 2). Methods 1314A and 1316A are similar in intent as they both evaluate leaching as a function of L/S; however, the experimental approach differs. Method 1314A uses a flow-through column configuration (Figure 3; discussed further below). Method 1314A may better simulate field conditions, but Method 1316A is simpler and less costly to implement. Trends in Method 1314A and 1316A are expected to be qualitatively similar but leaching concentrations are expected to exhibit differences. Despite this, leaching studies comparing Methods 1314A and 1316A for inorganics showed that cumulative release results were within one order of magnitude<ref>Lopez Meza, S., Garrabrants, A.C., van der Sloot, H., Kosson, D.S., 2008. Comparison of the Release of Constituents from Granular Materials under Batch and Column Testing. Waste Management, 28(10), pp. 1853–1867. [https://doi.org/10.1016/j.wasman.2007.11.009 doi: 10.1016/j.wasman.2007.11.009]</ref>. |
| | | | |
| − | The most popular and widely used format for atmospheric and climate science is known as NetCDF, which stands for Network Common Data Form. NetCDF is a self-describing data format that saves data in a binary format. The format is self-describing in that a metadata listing is part of every file that describes all the data attributes, such as dimensions, units and data size and in principal should not need additional information to extract the required data for analysis with the right software. However, specially built software for reading and extracting data from these binary files is necessary for making visualizations and further analysis. Software packages for reading and writing NetCDF datasets and for generating visualizations from these datasets are widely available and obtained free of cost ([https://www.unidata.ucar.edu/software/netcdf/docs/ NetCDF-tools]). Popular geospatial analysis tools such as ARC-GIS, statistical packages such as ‘R’ and programming languages such as Fortran, C++, and Python have built in libraries that can be used to directly read NetCDF files for visualization and analysis.
| + | Method 1316A and Method 1314A may also provide different insights into transport mechanisms. Because Method 1316A is performed using equilibrated batch reactors at varying L/S, results can be used to develop equilibrium desorption isotherms and calculate desorption coefficients (e.g., ''K<sub><small>d,desorption</small></sub>''). Studies have shown that ''K<sub><small>d,desorption</small></sub>'' values for PFAS may be greater than ''K<sub><small>d</small></sub>'', an effect often attributed to desorption hysteresis<ref>Schaefer, C.E., Nguyen, D., Christie, E., Shea, S., Higgins, C.P., Field, J., 2022. Desorption Isotherms for Poly- and Perfluoroalkyl Substances in Soil Collected from an Aqueous Film-Forming Foam Source Area. Journal of Environmental Engineering, 148(1), Article 04021074. [https://doi.org/10.1061/(ASCE)EE.1943-7870.0001952 doi: 10.1061/(ASCE)EE.1943-7870.0001952]</ref>. Consequently Method 1316A provides a straightforward method to estimate site-specific desorption parameters. Although sorption parameters can also be inferred from column (Method 1314A) data, interpretation is often complicated by nonequilibrium processes. Conversely, the column data can be valuable for quantifying those additional mechanisms providing transport parameters that can describe rate-limited transport (e.g., fraction of non-equilibrium sorption sites and sorption rates) and other dynamic behavior. |
| | | | |
| | + | As anticipated, trends in PFAS leaching obtained during the Method 1316A and Method 1314A demonstrations were qualitatively similar. These are further discussed below. |
| | | | |
| | + | ==Column Test Demonstration Studies== |
| | + | [[File: GuelfoFig3.png | thumb | 500 px | Figure 3. a) Overview of LEAF Method 1314A and b) PFHxS leaching as a function of ∑(L/S) evaluated in saturated up-flow column tests<ref name="GarrabrantsEtAl2024"/>. Note that acrylic here simply refers to the column material of construction used in this round of Method 1314 testing.]] |
| | + | PFAS-specific adaptations were tested in column test demonstration studies, which included triplicate implementation of Method 1314A in three AFFF-impacted site soils. |
| | | | |
| − | [[File: Gschwend1w2fig1.png | thumb | 300px | Figure 1. A representation of a clam living in a sediment bed that contains a chemical contaminant (depicted as red hexagons). The contaminant is partly dissolved in the sediment porewater between the solid grains, and partly associated with solid phases, like natural organic matter and "black carbons" such as soots from diesel engines and chars emitted during forest fires. All of these liquid and solid materials can exchange their contaminant loads with one another, with the distributions dependent on the chemical's relative affinity for each material. When an animal like the clam moves into this system, the chemical is also accumulated into the animal, until the animal is also equilibrated with the other solids and liquid(s) present.]]
| + | '''Draft Method 1314A''' was implemented in saturated, up-flow columns to evaluate leaching of PFAS as a function of cumulative L/S (∑(L/S)); Figure 3; total volume of water that has passed through the column divided by the soil mass in the column). As noted, the intent of Method 1314a and 1316a is similar, and in both tests, similar qualitative results were observed. For example, short-chain PFAS exhibited high initial concentrations that decreased rapidly. However, in Method 1314a, these rapid drops in short-chain PFAS tended to occur by ∑(L/S) ≈ 2 (e.g., Site 1 and 3 soils, Figure 3) whereas in some cases, such as for PFHxS, Method 1316A produced slightly flatter elution curves than Method 1314A (Figures 2b and 3b). Long-chain PFAS generally displayed flatter elution profiles than short-chain PFAS across both methods. These trends are consistent with chain length dependent sorption documented in the literature<ref name="HigginsLuthy2006"/><ref name="NguyenEtAl2020"/><ref>Guelfo, J.L., Higgins, C.P., 2013. Subsurface Transport Potential of Perfluoroalkyl Acids at Aqueous Film-Forming Foam (AFFF)-Impacted Sites. Environmental Science and Technology, 47(9), pp. 4164–4171. [https://doi.org/10.1021/es3048043 doi: 10.1021/es3048043]</ref>. Although column modeling is beyond the scope of this article, prior studies have shown that saturated transport can be influenced by rate-limited desorption, particularly for long-chain PFAS<ref>Doria-Manzur, A., Gray, E.P., Streets, S.S., Guelfo, J.L., 2025. Per- and Polyfluoroalkyl Substances (PFAS) Transport from Biosolids-Amended Soils: An Experimental and Numerical Approach. Water Research, 288(Part B), Article 124674. [https://doi.org/10.1016/j.watres.2025.124674 doi: 10.1016/j.watres.2025.124674] [[Media: Doria-ManzurEtAl2026.pdf | Open Access Article]]</ref><ref>Guelfo, J.L., Wunsch, A., McCray, J., Stults, J.F., Higgins, C.P., 2020. Subsurface Transport Potential of Perfluoroalkyl Acids (PFAAs): Column Experiments and Modeling. Journal of Contaminant Hydrology, 233, Article 103661. [https://doi.org/10.1016/j.jconhyd.2020.103661 doi: 10.1016/j.jconhyd.2020.103661] [[Media: GuelfoEtAl2020.pdf | Open Access Manuscript]]</ref>. As noted, data from Methods 1316A and 1314A can support estimation of transport parameters representing equilibrium and nonequilibrium behavior, respectively. |
| − | Environmental media such as sediments typically contain many different materials or phases, including liquid solutions (e.g. water, [[Light Non-Aqueous Phase Liquids (LNAPLs)| nonaqueous phase liquids]] like spilled oils) and diverse solids (e.g., quartz, aluminosilicate clays, and combustion-derived soots). Further, the chemical concentration in the porewater medium includes both molecules that are "truly dissolved" in the water and others that are associated with colloids in the porewater<ref name="Brownawell1986">Brownawell, B.J., and Farrington, J.W., 1986. Biogeochemistry of PCBs in interstitial waters of a coastal marine sediment. Geochimica et Cosmochimica Acta, 50(1), pp. 157-169. [https://doi.org/10.1016/0016-7037(86)90061-X DOI: 10.1016/0016-7037(86)90061-X] Free download available from: [https://semspub.epa.gov/work/01/268631.pdf US EPA].</ref><ref name="Chin1992">Chin, Y.P., and Gschwend, P.M., 1992. Partitioning of Polycyclic Aromatic Hydrocarbons to Marine Porewater Organic Colloids. Environmental Science and Technology, 26(8), pp. 1621-1626. [https://doi.org/10.1021/es00032a020 DOI: 10.1021/es00032a020]</ref><ref name="Achman1996">Achman, D.R., Brownawell, B.J., and Zhang, L., 1996. Exchange of Polychlorinated Biphenyls Between Sediment and Water in the Hudson River Estuary. Estuaries, 19(4), pp. 950-965. [https://doi.org/10.2307/1352310 DOI: 10.2307/1352310] Free download available from: [https://www.academia.edu/download/55010335/135231020171114-2212-b93vic.pdf Academia.edu]</ref>. As a result, contaminant chemicals distribute among these diverse media (Figure 1) according to their affinity for each and the amount of each phase in the system<ref name="Gustafsson1996">Gustafsson, Ö., Haghseta, F., Chan, C., MacFarlane, J., and Gschwend, P.M., 1996. Quantification of the Dilute Sedimentary Soot Phase: Implications for PAH Speciation and Bioavailability. Environmental Science and Technology, 31(1), pp. 203-209. [https://doi.org/10.1021/es960317s DOI: 10.1021/es960317s]</ref><ref name="Luthy1997">Luthy, R.G., Aiken, G.R., Brusseau, M.L., Cunningham, S.D., Gschwend, P.M., Pignatello, J.J., Reinhard, M., Traina, S.J., Weber, W.J., and Westall, J.C., 1997. Sequestration of Hydrophobic Organic Contaminants by Geosorbents. Environmental Science and Technology, 31(12), pp. 3341-3347. [https://doi.org/10.1021/es970512m DOI: 10.1021/es970512m]</ref><ref name="Lohmann2005">Lohmann, R., MacFarlane, J.K., and Gschwend, P.M., 2005. Importance of Black Carbon to Sorption of Native PAHs, PCBs, and PCDDs in Boston and New York Harbor Sediments. Environmental Science and Technology, 39(1), pp.141-148. [https://doi.org/10.1021/es049424+ DOI: 10.1021/es049424+]</ref><ref name="Cornelissen2005">Cornelissen, G., Gustafsson, Ö., Bucheli, T.D., Jonker, M.T., Koelmans, A.A., and van Noort, P.C., 2005. Extensive Sorption of Organic Compounds to Black Carbon, Coal, and Kerogen in Sediments and Soils: Mechanisms and Consequences for Distribution, Bioaccumulation, and Biodegradation. Environmental Science and Technology, 39(18), pp. 6881-6895. [https://doi.org/10.1021/es050191b DOI: 10.1021/es050191b]</ref><ref name="Koelmans2009">Koelmans, A.A., Kaag, K., Sneekes, A., and Peeters, E.T.H.M., 2009. Triple Domain in Situ Sorption Modeling of Organochlorine Pesticides, Polychlorobiphenyls, Polyaromatic Hydrocarbons, Polychlorinated Dibenzo-p-Dioxins, and Polychlorinated Dibenzofurans in Aquatic Sediments. Environmental Science and Technology, 43(23), pp. 8847-8853. [https://doi.org/10.1021/es9021188 DOI: 10.1021/es9021188]</ref>. As such, the chemical concentration in any one medium (e.g., truly dissolved in porewater) in a multi-material system like sediment is very hard to know from measures of the total sediment concentration, which unfortunately is the information typically found by analyzing for chemicals in sediment samples.
| |
| | | | |
| − | If an animal moves into this system, it will also accumulate the chemical in its tissues from the loads in all the other materials (Figure 1). This can lead to exposures of the chemical to other organisms, including humans, who may eat such animals. Predicting the quantity of contaminant in the animal requires knowledge of the relative affinities of the chemical for the animal versus the sediment materials. For example, if one knew the chemical's truly dissolved concentration in the porewater and could reasonably assume the chemical of interest in the animal has mostly accumulated in its lipids (as is often the case for very hydrophobic compounds), then one could estimate the chemical concentration in the animal (''C<sub><small>animal</small></sub>'', typically in units of μg/kg animal wet weight) using a lipid-water [[Wikipedia: Partition coefficient | partition coefficient]], ''K<sub><small>lipid-water</small></sub>'', typically in units of (μg/kg lipid)'''/'''(μg/L water), and the porewater concentration of the chemical (''C<sub><small>porewater</small></sub>'', in μg/L) with Equation 1.
| + | ==LEAF Screening Evaluations== |
| − | {|
| + | [[File: GuelfoFig4.png | thumb | 500 px | Figure 4. Example screening assessment for perfluorooctane sulfonate (PFOS) using total content and data from Methods 1313A and 1314A. Figure format adapted from Garrabrants ''et al''. 2021<ref>Garrabrants, A.C., Kosson, D.S., Brown, K.G., Fagnant, D.P., Helms, G., Thorneloe, S.A., 2021. Methodology for Scenario-Based Assessments and Demonstration of Treatment Effectiveness Using the Leaching Environmental Assessment Framework (LEAF). Journal of Hazardous Materials, 406, Article 124635. [https://doi.org/10.1016/j.jhazmat.2020.124635 doi: 10.1016/j.jhazmat.2020.124635] [[Media: GarrabrantsEtAl2021.pdf | Open Access Manuscript]]</ref>.]] |
| − | |
| + | LEAF provides a standardized, robust approach for evaluating PFAS release from impacted granular materials under a range of environmental conditions. The tests are complementary, capture a range of conditions, and vary in ease of implementation. This provides the flexibility for users to select the test or test combinations that best suit their project objectives, timeline, and budget. A common use of LEAF data is in screening level assessments. These are stepwise assessments that establish increasingly refined maximum leaching concentrations, ''C<sub><small>leach,max</small></sub>'' (Figure 4), which can then be compared to regulatory limits such as maximum contaminant levels, when available. For example, a stepwise screening assessment might include: |
| − | |-
| + | #Assume the maximum leaching concentration is represented by the total content (total initial mass of contaminant present) leaching into the first L/S. |
| − | | || Equation 1.
| + | #Assume only the available content leaches into the first L/S where available content is the maximum mass released over pH 2-13 measured using Method 1313a. For many PFAS, total content is equal to available content meaning that all of the PFAS mass is available for leaching. |
| − | | style="text-align:center;"| <big>'''''C<sub><small>animal</small></sub> '''=''' f<sub><small>lipid</small></sub> '''x''' K<sub><small>lipid-water</small></sub> '''x''' C<sub><small>porewater</small></sub>'''''</big>
| + | #Assume the leaching concentration at natural pH (measured in Method 1313A at natural pH or Method 1316A at L/S of 10) is maximum leaching concentration adjusted to the first L/S. |
| − | |-
| + | #Consider the maximum leaching concentration over the L/S range (Method 1314A or Method 1316A) and the upper estimate of leaching, or ''C<sub><small>leach,max</small></sub>'', is the concentration from either Step 3 or Step 4, whichever is greater. |
| − | | where:
| |
| − | |-
| |
| − | | || ''f<sub><small>lipid</small></sub>'' || is the fraction lipids contribute to the total wet weight of the animal (kg lipid/kg animal wet weight), and
| |
| − | |-
| |
| − | | || ''C<sub><small>porewater</small></sub>'' || is the freely dissolved contaminant concentration in the porewater surrounding the animal.
| |
| − | |}
| |
| | | | |
| − | While there is a great deal of information on the values of ''K<sub><small>lipid-water</small></sub>'' for many chemicals<ref name="Schwarzenbach2017">Schwarzenbach, R.P., Gschwend, P.M., and Imboden, D.M., 2017. Environmental Organic Chemistry, 3rd edition. Ch. 16: Equilibrium Partitioning from Water and Air to Biota, pp. 469-521. John Wiley and Sons. ISBN: 978-1-118-76723-8</ref>, it is often very inaccurate to estimate truly dissolved porewater concentrations from total sediment concentrations using assumptions about the affinity of those chemicals for the solids in the system<ref name="Gustafsson1996"/>. Further, it is difficult to isolate porewater without colloids and/or measure the very low truly dissolved concentrations of hydrophobic contaminants of concern like [[Polycyclic Aromatic Hydrocarbons (PAHs) | polycyclic aromatic hydrocarbons (PAHs)]], [[Wikipedia: Polychlorinated biphenyl | polychlorinated biphenyls (PCBs)]], nonionic pesticides like [[Wikipedia: DDT | dichlorodiphenyltrichloroethane (DDT)]], and [[Wikipedia: Polychlorinated dibenzodioxins | polychlorinated dibenzo-p-dioxins (PCDDs)]]/[[Wikipedia: Polychlorinated dibenzofurans | dibenzofurans (PCDFs)]]<ref name="Hawthorne2005">Hawthorne, S.B., Grabanski, C.B., Miller, D.J., and Kreitinger, J.P., 2005. Solid-Phase Microextraction Measurement of Parent and Alkyl Polycyclic Aromatic Hydrocarbons in Milliliter Sediment Pore Water Samples and Determination of K<sub><small>DOC</small></sub> Values. Environmental Science and Technology, 39(8), pp. 2795-2803. [https://doi.org/10.1021/es0405171 DOI: 10.1021/es0405171]</ref>.
| + | Screening assessments may be sufficient to meet project goals, but when additional refinements of leaching estimates are needed, site-specific data (e.g., infiltration) can be combined with test data and computational approaches (e.g., fate and transport models) for more site-specific estimates of leaching. Example scenarios where LEAF may be used to evaluate PFAS-impacted solids include 1) estimating PFAS release from AFFF-impacted soils, 2) estimating PFAS release from biosolids-amended soils at land application sites, 3) providing transport parameters to model PFAS transport from the source zone to the saturated zone, and 4) evaluating PFAS release from treatment residuals such as soils or sediments treated by soil washing or thermal approaches. |
| | | | |
| − | ==Passive Samplers== | + | ==Summary and Ongoing Research== |
| − | One approach to address this problem for contaminated sediments is to insert into the sediment billets of organic polymers like low density polyethylene (LDPE), polydimethylsiloxane (PDMS), or polyoxymethylene (POM) that can absorb such hydrophobic chemicals from their surroundings<ref name="Mayer2000">Mayer, P., Vaes, W.H., Wijnker, F., Legierse, K.C., Kraaij, R., Tolls, J., and Hermens, J.L., 2000. Sensing Dissolved Sediment Porewater Concentrations of Persistent and Bioaccumulative Pollutants Using Disposable Solid-Phase Microextraction Fibers. Environmental Science and Technology, 34(24), pp. 5177-5183. [https://doi.org/10.1021/es001179g DOI: 10.1021/es001179g]</ref><ref name="Booij2003">Booij, K., Hoedemaker, J.R., and Bakker, J.F., 2003. Dissolved PCBs, PAHs, and HCB in Pore Waters and Overlying Waters of Contaminated Harbor Sediments. Environmental Science and Technology, 37(18), pp. 4213-4220. [https://doi.org/10.1021/es034147c DOI: 10.1021/es034147c]</ref><ref name="Cornelissen2008">Cornelissen, G., Pettersen, A., Broman, D., Mayer, P., and Breedveld, G.D., 2008. Field testing of equilibrium passive samplers to determine freely dissolved native polycyclic aromatic hydrocarbon concentrations. Environmental Toxicology and Chemistry, 27(3), pp. 499-508. [https://doi.org/10.1897/07-253.1 DOI: 10.1897/07-253.1]</ref><ref name="Tomaszewski2008">Tomaszewski, J.E., and Luthy, R.G., 2008. Field Deployment of Polyethylene Devices to Measure PCB Concentrations in Pore Water of Contaminated Sediment. Environmental Science and Technology, 42(16), pp. 6086-6091. [https://doi.org/10.1021/es800582a DOI: 10.1021/es800582a]</ref><ref name="Fernandez2009">Fernandez, L.A., MacFarlane, J.K., Tcaciuc, A.P., and Gschwend, P.M., 2009. Measurement of Freely Dissolved PAH Concentrations in Sediment Beds Using Passive Sampling with Low-Density Polyethylene Strips. Environmental Science and Technology, 43(5), pp. 1430-1436. [https://doi.org/10.1021/es802288w DOI: 10.1021/es802288w]</ref><ref name="Arp2015">Arp, H.P.H., Hale, S.E., Elmquist Kruså, M., Cornelissen, G., Grabanski, C.B., Miller, D.J., and Hawthorne, S.B., 2015. Review of polyoxymethylene passive sampling methods for quantifying freely dissolved porewater concentrations of hydrophobic organic contaminants. Environmental Toxicology and Chemistry, 34(4), pp. 710-720. [https://doi.org/10.1002/etc.2864 DOI: 10.1002/etc.2864] [https://setac.onlinelibrary.wiley.com/doi/epdf/10.1002/etc.2864 Free access article.] [[Media: Arp2015.pdf | Report.pdf]]</ref><ref name="Apell2016"/>. In this approach, the polymer is inserted in the sediment bed where it absorbs some of the contaminant load via the contaminant's diffusion into the polymer from the surroundings. When the polymer achieves sorptive equilibration with the sediments, the chemical concentration in the polymer, ''C<sub><small>polymer</small></sub>'' (μg/kg polymer), can be used to find the corresponding concentration in the porewater, ''C<sub><small>porewater</small></sub>'' (μg/L), using a polymer-water partition coefficient, ''K<sub><small>polymer-water</small></sub>'' ((μg/kg polymer)'''/'''(μg/L water)), that has previously been found in laboratory testing<ref name="Lohmann2012">Lohmann, R., 2012. Critical Review of Low-Density Polyethylene’s Partitioning and Diffusion Coefficients for Trace Organic Contaminants and Implications for Its Use as a Passive Sampler. Environmental Science and Technology, 46(2), pp. 606-618. [https://doi.org/10.1021/es202702y DOI: 10.1021/es202702y]</ref><ref name="Ghosh2014">Ghosh, U., Kane Driscoll, S., Burgess, R.M., Jonker, M.T., Reible, D., Gobas, F., Choi, Y., Apitz, S.E., Maruya, K.A., Gala, W.R., Mortimer, M., and Beegan, C., 2014. Passive Sampling Methods for Contaminated Sediments: Practical Guidance for Selection, Calibration, and Implementation. Integrated Environmental Assessment and Management, 10(2), pp. 210-223. [https://doi.org/10.1002/ieam.1507 DOI: 10.1002/ieam.1507] [https://setac.onlinelibrary.wiley.com/doi/epdf/10.1002/ieam.1507 Free access article.] [[Media: Ghosh2014.pdf | Report.pdf]]</ref>, as shown in Equation 2.
| + | The LEAF framework offers a reliable, replicable approach to evaluating PFAS release from solids. With recent adaptations for PFAS-specific considerations, LEAF methods provide valuable tools for regulators and practitioners in managing PFAS-contaminated materials and assessing long-term environmental risks. However, there are key areas of ongoing research, including: |
| − | {|
| + | *An interlab validation of Methods 1313A, 1314A, and 1316A in coordination with the EPA |
| − | |
| + | *Optimization and demonstration of Method 1315A for use with PFAS-impacted solids |
| − | |-
| + | *Evaluation of an unsaturated Method 1314A protocol to assess the need for and ability of LEAF testing to capture air-water interfacial partitioning of PFAS |
| − | | || Equation 2.
| + | *Application of the total oxidizable precursor (TOP) assay for evaluating the maximum additional PFAS leaching that may occur as a result of polyfluoroalkyl precursor transformation |
| − | | style="width:600px; text-align:center;" | <big>'''''C<sub><small>porewater</small></sub> '''=''' C<sub><small>polymer</small></sub> '''/''' K<sub><small>polymer-water</small></sub>'''''</big>
| + | *Comparison of LEAF testing data to previously collected field-scale enhanced flushing data collected from the same site |
| − | |}
| |
| | | | |
| − | Such “passive uptake” by the polymer also reflects the availability of the chemicals for transport to adjacent systems (e.g., overlying surface waters) and for uptake into organisms (e.g., [[Wikipedia: Bioaccumulation | bioaccumulation]]). Thus, one can use the porewater concentrations to estimate the biotic accumulation of the chemicals, too. For example, for the concentration in the animal equilibrated with the sediment, ''C<sub><small>animal</small></sub>'' (μg/kg animal), would be found by combining Equations 1 and 2 to get Equation 3.
| + | Additionally, there are key areas for consideration in future research: |
| − | {|
| + | *Collection of paired field-laboratory data under ambient conditions to further validate the applicability of LEAF assessments for estimation of field-relevant PFAS leaching and mobility |
| − | |
| + | *Consideration of biotransformation in modeling and interpretation of LEAF data, as the state of the science regarding biotransformation of polyfluoroalkyl substances to terminal perfluoroalkyl acids advances |
| − | |-
| |
| − | | || Equation 3.
| |
| − | |style="width:700px; text-align:center;" |<big>'''''C<sub><small>animal</small></sub> '''=''' f<sub><small>lipid</small></sub> '''x''' K<sub><small>lipid-water</small></sub> '''x''' C<sub><small>polymer</small></sub> '''/''' K<sub><small>polymer-water</small></sub>'''''</big>
| |
| − | |}
| |
| − | [[File: Gschwend1w2fig2a.PNG | thumb | 300px | Figure 2a. Plot of the initial concentrations of a PRC (green lines) in a polyethylene (PE) sheet inserted in a sediment showing constant concentration across the PE and zero concentration outside the PE. At the same time, a target contaminant of interest (red lines) initially has a constant concentration in the sediment outside the PE and zero concentration inside the PE.]][[File: Gschwend1w2fig2b.PNG | thumb | 300px | Figure 2b. After the PE has been deployed for a time, the PRC is depleted from the PE (green lines), especially near the surfaces contacting the sediment, and its concentration is building up outside the PE and diffusing away into the sediment. Meanwhile, the target chemical leaves the sediment and begins to diffuse into the PE (red lines). The "jumps" in concentration at the PE-sediment boundary reflect the equilibrium paritioning coefficient,</br>''K<sub>PE-sed</sub> = C<sub>PE</sub> / C<sub>sediment</sub>''.]]
| |
| | | | |
| − | ==Performance Reference Compounds (PRCs)== | + | ==Other LEAF Resources== |
| − | Perhaps unsurprisingly, pollutants with low water solubility like PAHs, PCBs, etc. do not diffuse quickly through sediment beds. As a result, their accumulation in polymeric materials in sediments can take a long time to achieve equilibration<ref name="Fernandez2009b">Fernandez, L. A., Harvey, C.F., and Gschwend, P.M., 2009. Using Performance Reference Compounds in Polyethylene Passive Samplers to Deduce Sediment Porewater Concentrations for Numerous Target Chemicals. Environmental Science and Technology, 43(23), pp. 8888-8894. [https://doi.org/10.1021/es901877a DOI: 10.1021/es901877a]</ref><ref name="Lampert2015">Lampert, D.J., Thomas, C., and Reible, D.D., 2015. Internal and external transport significance for predicting contaminant uptake rates in passive samplers. Chemosphere, 119, pp. 910-916. [https://doi.org/10.1016/j.chemosphere.2014.08.063 DOI: 10.1016/j.chemosphere.2014.08.063] Free download available from: [https://www.academia.edu/download/44146586/chemosphere_2014.pdf Academia.edu]</ref><ref name="Apell2016b">Apell, J.N., Tcaciuc, A.P., and Gschwend, P.M., 2016. Understanding the rates of nonpolar organic chemical accumulation into passive samplers deployed in the environment: Guidance for passive sampler deployments. Integrated Environmental Assessment and Management, 12(3), pp. 486-492. [https://doi.org/10.1002/ieam.1697 DOI: 10.1002/ieam.1697]</ref>. This problem was recognized previously for passive samplers called [[Wikipedia: Semipermeable membrane devices | semipermeable membrane devices]] (SPMDs, e.g. polyethylene bags filled with triolein<ref name="Huckins2002">Huckins, J.N., Petty, J.D., Lebo, J.A., Almeida, F.V., Booij, K., Alvarez, D.A., Cranor, W.L., Clark, R.C., and Mogensen, B.B., 2002. Development of the Permeability/Performance Reference Compound Approach for In Situ Calibration of Semipermeable Membrane Devices. Environmental Science and Technology, 36(1), pp. 85-91. [https://doi.org/10.1021/es010991w DOI: 10.1021/es010991w]</ref>) that were deployed in surface waters. As a result, representative chemicals called performance reference compound (PRCs) were dosed inside the samplers before their deployment in the environment, and the PRCs' diffusive losses out of the SPMD could be used to quantify the fractional approach toward sampler-environmental surroundings equilibration<ref name="Booij2002">Booij, K., Smedes, F., and van Weerlee, E.M., 2002. Spiking of performance reference compounds in low density polyethylene and silicone passive water samplers. Chemosphere 46(8), pp.1157-1161. [https://doi.org/10.1016/S0045-6535(01)00200-4 DOI: 10.1016/S0045-6535(01)00200-4]</ref><ref name="Huckins2002"/>. A similar approach can be used for polymers inserted in sediment beds<ref name="Fernandez2009b"/><ref name="Apell2014"/>. Commonly, isotopically labeled forms of the compounds of interest such as deuterated or <sup>13</sup>C-labelled PAHs or PCBs are homogeneously impregnated into the polymers before their deployments. Upon insertion of the polymer into the sediment bed (or overlying waters or even air), the initially evenly distributed PRCs begin to diffuse out of the sampling polymer and into the surroundings (Figure 2).
| + | There are numerous resources describing the development of the LEAF leaching methods for inorganics. They are not specific to PFAS, but are still valuable resources focused on LEAF implementation, applications, and management of LEAF data. They include: |
| − | | + | *[https://www.vanderbilt.edu/leaching/leach-xs-lite/ Leach XS Lite] - a tool for LEAF data management and visualization; free to download after registering for a free license key |
| − | Assuming the contaminants of interest undergo the same mass transfer restrictions limiting their rates of uptake into the polymer (e.g., diffusion through the sedimentary porous medium) that are also limiting transfers of the PRCs out of the polymer<ref name="Fernandez2009b"/><ref name="Apell2014"/>, then fractional losses of the PRCs during a particular deployment can be used to adjust the accumulated contaminant loads to what they would have been at equilibrium with their surroundings with Equation 4.
| + | *[https://www.epa.gov/hw-sw846/how-guide-leaching-environmental-assessment-framework LEAF “How-To” Guide] - guidance on LEAF background, implementation, test result interpretation; includes case studies |
| − | {|
| + | *[https://www.epa.gov/hw-sw846/leaching-environmental-assessment-framework-leaf-methods-and-guidance USEPA LEAF Methods and Guidance] homepage |
| − | |
| + | <br clear="right"/> |
| − | |-
| |
| − | | || Equation 4.
| |
| − | | style="text-align:center;"| <big>'''''C(<sub>∞</sub>)<sub><small>polymer</small></sub> '''=''' C(<small>t</small>)<sub><small>polymer</small></sub> '''/''' f<sub><small>PRC lost</small></sub>'''''</big>
| |
| − | |-
| |
| − | | where:
| |
| − | |-
| |
| − | | || ''f<sub><small>PRC lost</small></sub>'' || is the fraction of the PRC lost to outward diffusion,
| |
| − | |-
| |
| − | | || ''C(<sub>∞</sub>)<sub><small>polymer</small></sub>'' || is the concentration of the contaminant in the polymer at equilibrium, and
| |
| − | |-
| |
| − | | || ''C(<small>t</small>)<sub><small>polymer</small></sub>'' || is the concentration of the contaminant in the polymer after deployment time, t.
| |
| − | |}
| |
| − | | |
| − | Since investigators are commonly interested in many chemicals at the same time, it is impractical to have a PRC for each contaminant of interest. Instead, a representative set of PRCs is used to characterize the rates of polymer-environment exchange as a function of the PRCs' properties (e.g., diffusivities, partition coefficients), the sediments characteristics (e.g., porosity), and the nature of the polymer used (e.g., film thickness, affinity for the chemicals)<ref name="Fernandez2009b"/><ref name="Lampert2015"/>. The resulting mass transfer model fit can then be used to estimate the fractional approaches to equilibrium for many other contaminants, whose diffusive and partitioning properties are also known. And these fractions can be used to adjust the target chemical concentrations that have accumulated from the sediment into the same polymeric sampler to find the equilibrated results<ref name="Apell2014"/>. Finally, these equilibrated concentrations can be used in Eq. 2 to estimate truly dissolved contaminant concentrations in the sediment's porewater.
| |
| − | | |
| − | ==Field Applications==
| |
| − | [[File: Gschwend1w2fig3.png | thumb |left| 450px | Figure 3. Passive sampler system made of polyethylene sheet loaded into an aluminum sheet metal frame, before (left), during (middle), and after (right) deployment in sediment.]]
| |
| − | Polymeric materials can be deployed in sediment in various ways<ref name="Burgess2017"/>. PDMS coatings can be incorporated into slotted silica rods called SPMEs (solid phase micro extraction devices), while thin sheets of polymers like LDPE or POM can be incorporated into sheet metal frames. In both cases, such hardware is used to insert the polymers into sediment beds (Figure 3).
| |
| − | | |
| − | Deployment of the assembled passive samplers can be accomplished via poles from a boat<ref name="Apell2014"/>, by divers<ref name="Apell2016"/>, or by attaching the samplers to a sampling platform lowered off a vessel<ref name="Fernandez2012">Fernandez, L.A., Lao, W., Maruya, K.A., White, C., Burgess, R.M., 2012. Passive Sampling to Measure Baseline Dissolved Persistent Organic Pollutant Concentrations in the Water Column of the Palos Verdes Shelf Superfund Site. Environmental Science and Technology, 46(21), pp. 11937-11947. [https://doi.org/10.1021/es302139y DOI: 10.1021/es302139y]</ref>. Typically, the method used depends on the water depth. Small buoys on short lines, sometimes with associated water-sampling polymeric materials in mesh bags (see right panel of Figure 3), are attached to the samplers to facilitate the sampler recoveries. After recovery, the samplers are wiped to remove any adhering sediment, biofilm, or precipitates and returned to the laboratory for PRC and target contaminant analyses. The resulting measurements of the accumulated target chemical concentrations can be adjusted using the observed PRC losses and publicly available software programs<ref name="Gschwend2014">Gschwend, P.M., Tcaciuc, A.P., and Apell, J.N., 2014. Guidance Document: Passive PE Sampling in Support of In Situ Remediation of Contaminated Sediments – Passive Sampler PRC Calculation Software User’s Guide, US Department of Defense, Environmental Security Technology Certification Program Project ER-200915. Available from: [https://www.serdp-estcp.org/Program-Areas/Environmental-Restoration/Contaminated-Sediments/Bioavailability/ER-200915 ESTCP].</ref><ref name="Thompson2015">Thompson, J.M., Hsieh, C.H. and Luthy, R.G., 2015. Modeling Uptake of Hydrophobic Organic Contaminants into Polyethylene Passive Samplers. Environmental Science and Technology, 49(4), pp. 2270-2277. [https://doi.org/10.1021/es504442s DOI: 10.1021/es504442s]</ref>.
| |
| − | | |
| − | Subsequently, since the passive sampling reveals the concentrations of contaminants in a sediment bed's porewater and the overlying bottom water<ref name="Booij2003"/>, the data can be used to estimate bed-to-water column diffusive fluxes of contaminants<ref name="Koelmans2010">Koelmans, A.A., Poot, A., De Lange, H.J., Velzeboer, I., Harmsen, J., and van Noort, P.C.M., 2010. Estimation of In Situ Sediment-to-Water Fluxes of Polycyclic Aromatic Hydrocarbons, Polychlorobiphenyls and Polybrominated Diphenylethers. Environmental Science and Technology, 44(8), pp. 3014-3020. [https://doi.org/10.1021/es903938z DOI: 10.1021/es903938z]</ref><ref name="Fernandez2012"/> and bioirrigation-affected fluxes<ref name="Apell2018">Apell, J.N., Shull, D.H., Hoyt, A.M., and Gschwend, P.M., 2018. Investigating the Effect of Bioirrigation on In Situ Porewater Concentrations and Fluxes of Polychlorinated Biphenyls Using Passive Samplers. Environmental Science and Technology, 52(8), pp. 4565-4573. [https://doi.org/10.1021/acs.est.7b05809 DOI: 10.1021/acs.est.7b05809]</ref>. The data are also useful for assessing the tendency of the contaminants to accumulate in benthic organisms<ref name="Vinturella2004">Vinturella, A.E., Burgess, R.M., Coull, B.A., Thompson, K.M., and Shine, J.P., 2004. Use of Passive Samplers to Mimic Uptake of Polycyclic Aromatic Hydrocarbons by Benthic Polychaetes. Environmental Science and Technology, 38(4), pp. 1154-1160. [https://doi.org/10.1021/es034706f DOI: 10.1021/es034706f]</ref><ref name="Yates2011">Yates, K., Pollard, P., Davies, I.M., Webster, L., and Moffat, C.F., 2011. Application of silicone rubber passive samplers to investigate the bioaccumulation of PAHs by Nereis virens from marine sediments. Environmental Pollution, 159(12), pp. 3351-3356. [https://doi.org/10.1016/j.envpol.2011.08.038 DOI: 10.1016/j.envpol.2011.08.038]</ref><ref name="Fernandez2015">Fernandez, L.A. and Gschwend, P.M., 2015. Predicting bioaccumulation of polycyclic aromatic hydrocarbons in soft-shelled clams (Mya arenaria) using field deployments of polyethylene passive samplers. Environmental Toxicology and Chemistry, 34(5), pp. 993-1000. [https://doi.org/10.1002/etc.2892 DOI: 10.1002/etc.2892]</ref>, and by extension into food webs that include such benthic species<ref name="vonStackelberg2017">von Stackelberg, K., Williams, M.A., Clough, J., and Johnson, M.S., 2017. Spatially explicit bioaccumulation modeling in aquatic environments: Results from 2 demonstration sites. Integrated Environmental Assessment and Management, 13(6), pp. 1023-1037. [https://doi.org/10.1002/ieam.1927 DOI: 10.1002/ieam.1927]</ref>. Furthermore, recent efforts have found that passive sampling observations can be used to infer ''in situ'' transformations of substances like nitro aromatic compounds<ref name="Belles2016">Belles, A., Alary, C., Criquet, J., and Billon, G., 2016. A new application of passive samplers as indicators of in-situ biodegradation processes. Chemosphere, 164, pp. 347-354. [https://doi.org/10.1016/j.chemosphere.2016.08.111 DOI: 10.1016/j.chemosphere.2016.08.111]</ref> and DDT<ref name="Tcaciuc2018">Tcaciuc, A.P., Borrelli, R., Zaninetta, L.M., and Gschwend, P.M., 2018. Passive sampling of DDT, DDE and DDD in sediments: accounting for degradation processes with reaction–diffusion modeling. Environmental Science: Processes and Impacts, 20(1), pp. 220-231. [https://doi.org/10.1039/C7EM00501F DOI: 10.1039/C7EM00501F] Open access article available from: [https://pubs.rsc.org/--/content/articlehtml/2018/em/c7em00501f Royal Society of Chemistry].</ref>.
| |
| − | | |
| − | <br clear="left" /> | |
| | | | |
| | ==References== | | ==References== |
| | <references /> | | <references /> |
| | + | |
| | ==See Also== | | ==See Also== |
| − |
| |
| − | [https://www.serdp-estcp.org/Tools-and-Training/Tools/PRC-Correction-Calculator A PRC Correction Calculator for LDPE deployed in sediments]
| |
PFAS Leaching Characterization with the Leaching Environmental Assessment Framework (LEAF)
Aqueous film-forming foams (AFFFs) are a major source of per- and poly-fluoroalkyl substances (PFAS) impacts in soil and groundwater. Standardized tools are needed to rapidly assess the potential for retention, leaching, and transport of PFAS from the source zone to downgradient regions, so that this information can be applied towards critical facets of site management such as prioritizing PFAS-impacted sites for further investigation and remediation. Existing standard leaching methods were developed prior to concerns regarding PFAS. Therefore, studies are needed to ensure that leaching methods are compatible for use with PFAS and that resulting data are representative of the risk of PFAS leaching at impacted sites.
Related Article(s):
Contributors: Dr. Jennifer L. Guelfo, Dr. David Kosson, Dr. Andy Garrabrants, Ms. Fangfei Liu, Mr. Darlington Yawson, Dr. Md. Isreq Real
Key Resources:
- Development of Leaching Tests for Materials Containing SVOCs and PFAS, EPA 600/R-23/382[1]
Introduction to LEAF
The U.S. Environmental Protection Agency (EPA) Leaching Environmental Assessment Framework (LEAF) is a suite of standardized test methods for evaluating contaminant release from solids under environmentally relevant conditions (Table 1). The four leaching methods within LEAF were originally validated for inorganic constituents[2][3] and included as standard leaching methods EPA 1313 – 1316 within Update V of SW-846[4]. To address the need for standardized tests to evaluate PFAS leaching and mobility, LEAF methods have been optimized and demonstrated for use with PFAS (Methods 1313A-1316A)[1]. This article will focus on Methods 1313A, 1314A, and 1316A. Demonstration of Method 1315A for compacted granular materials (including concrete and asphalt) is ongoing.
Table 1. EPA SW-846 methods that comprise the LEAF framework
| Method
|
Description
|
| 1313 |
Liquid-solid partitioning as a function of extract pH using a parallel batch extraction (i.e., equilibrium) procedure (Figure 1)
|
| 1314 |
Liquid-solid partitioning as a function of liquid-solid ratio (L/S) for constituents in solid materials using an up-flow percolation column procedure (Figure 3)
|
| 1315 |
Mass transfer rates of constituents in monolithic or compacted granular materials using a semi-dynamic tank leaching procedure
|
| 1316 |
Liquid-solid partitioning as a function of L/S using a parallel batch extraction (i.e., equilibrium) procedure (Figure 2)
|
| Note: Text shown in bold indicates primary condition evaluated in each method.
|
Method Development for PFAS
Complete details of the development of LEAF Methods 1313A, 1314A, and 1316A for use with PFAS are available in Garrabrants et al., 2024[1]. Representative method modifications include:
- Materials of construction for experimental apparatus: containers used for leaching vessels (Methods 1313A, 1316A) and column construction materials (Method 1314A) evaluated for background PFAS and PFAS uptake.
- Reagents and eluant composition: eluant composition was optimized to use 1 mM CaCl2 to reduce formation of colloidal matter; Method 1313A pH adjustment now conducted with nonoxidizing HCl.
- Experimental conditions: Longer equilibration times (e.g., Method 1313, 1316) may be required due to slow desorption kinetics of certain PFAS from soil and organic matrices, implementation of settling to facilitate separation of solids from eluates.
- Eluate processing (all methods): Use of centrifugation in lieu of eluate filtering, sonication of bottle prior to eluate subsampling.
Batch Test Demonstration Studies
PFAS-specific adaptations were tested in batch test demonstration studies, which included triplicate implementation of Methods 1313A and 1316A in four AFFF-impacted site soils.
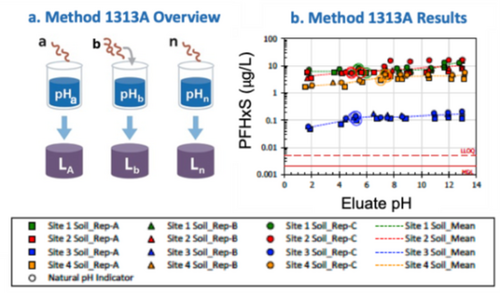
Figure 1: Figure 1. a) Overview of LEAF Method 1313A and b) PFHxS leaching as a function of pH
[1]. Definitions: lower limit of quantification (LLOQ) and method detection limit (MDL)
Draft Method 1313A was used to evaluate pH-dependent leaching in PFAS-contaminated soils in parallel batch extractions where each set of batch reactors is prepared and equilibrated at different pH (Figure 1). Short-chain PFAS (≤6 fluorinated carbons) generally showed little to no variation in leaching across the tested pH range of 2-13 (e.g., PFHxS, Figure 1), whereas long-chain PFAS exhibited increased leaching at higher pH[1]. This trend is consistent with previous findings showing that soil-water partitioning coefficients (Kd) decrease as pH increases (e.g., Higgins and Luthy 2006)[5]. The most pronounced pH effects were observed for perfluoroalkyl sulfonamides (FASAs) such as perfluorooctane sulfonamide (FOSA), which transition from neutral to anionic forms within the circumneutral pH range (~pH 6). The anionic form has a lower Kd and results in higher leaching concentrations[1][6]. For many site management scenarios where pH is circumneutral, variations in anionic PFAS leaching are expected to be small over the relevant pH range. In such cases, when testing time and costs are primary considerations, Method 1313A may be a lower priority relative to evaluating leaching as a function of L/S (Method 1316A, Method 1314A). Different considerations may be needed where FASAs or PFAS with multiple, ionizable functional groups (i.e., zwitterions) are of concern.
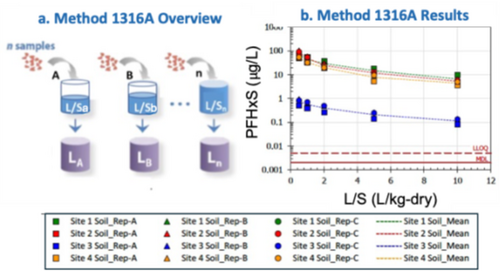
Figure 2: a) Overview of LEAF Method 1316A and b) PFHxS leaching as a function of L/S ratio evaluated in parallel batch leaching vessels
[1]Draft Method 1316A was used to evaluate L/S-dependent leaching of PFAS in impacted soils using parallel batch extractions where each set of batch reactors is prepared and equilibrated at a different L/S. (Figure 2). Methods 1314A and 1316A are similar in intent as they both evaluate leaching as a function of L/S; however, the experimental approach differs. Method 1314A uses a flow-through column configuration (Figure 3; discussed further below). Method 1314A may better simulate field conditions, but Method 1316A is simpler and less costly to implement. Trends in Method 1314A and 1316A are expected to be qualitatively similar but leaching concentrations are expected to exhibit differences. Despite this, leaching studies comparing Methods 1314A and 1316A for inorganics showed that cumulative release results were within one order of magnitude[7].
Method 1316A and Method 1314A may also provide different insights into transport mechanisms. Because Method 1316A is performed using equilibrated batch reactors at varying L/S, results can be used to develop equilibrium desorption isotherms and calculate desorption coefficients (e.g., Kd,desorption). Studies have shown that Kd,desorption values for PFAS may be greater than Kd, an effect often attributed to desorption hysteresis[8]. Consequently Method 1316A provides a straightforward method to estimate site-specific desorption parameters. Although sorption parameters can also be inferred from column (Method 1314A) data, interpretation is often complicated by nonequilibrium processes. Conversely, the column data can be valuable for quantifying those additional mechanisms providing transport parameters that can describe rate-limited transport (e.g., fraction of non-equilibrium sorption sites and sorption rates) and other dynamic behavior.
As anticipated, trends in PFAS leaching obtained during the Method 1316A and Method 1314A demonstrations were qualitatively similar. These are further discussed below.
Column Test Demonstration Studies
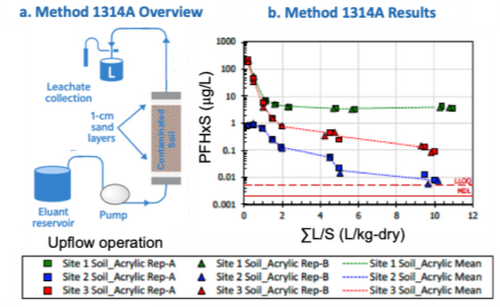
Figure 3. a) Overview of LEAF Method 1314A and b) PFHxS leaching as a function of ∑(L/S) evaluated in saturated up-flow column tests
[1]. Note that acrylic here simply refers to the column material of construction used in this round of Method 1314 testing.
PFAS-specific adaptations were tested in column test demonstration studies, which included triplicate implementation of Method 1314A in three AFFF-impacted site soils.
Draft Method 1314A was implemented in saturated, up-flow columns to evaluate leaching of PFAS as a function of cumulative L/S (∑(L/S)); Figure 3; total volume of water that has passed through the column divided by the soil mass in the column). As noted, the intent of Method 1314a and 1316a is similar, and in both tests, similar qualitative results were observed. For example, short-chain PFAS exhibited high initial concentrations that decreased rapidly. However, in Method 1314a, these rapid drops in short-chain PFAS tended to occur by ∑(L/S) ≈ 2 (e.g., Site 1 and 3 soils, Figure 3) whereas in some cases, such as for PFHxS, Method 1316A produced slightly flatter elution curves than Method 1314A (Figures 2b and 3b). Long-chain PFAS generally displayed flatter elution profiles than short-chain PFAS across both methods. These trends are consistent with chain length dependent sorption documented in the literature[5][6][9]. Although column modeling is beyond the scope of this article, prior studies have shown that saturated transport can be influenced by rate-limited desorption, particularly for long-chain PFAS[10][11]. As noted, data from Methods 1316A and 1314A can support estimation of transport parameters representing equilibrium and nonequilibrium behavior, respectively.
LEAF Screening Evaluations
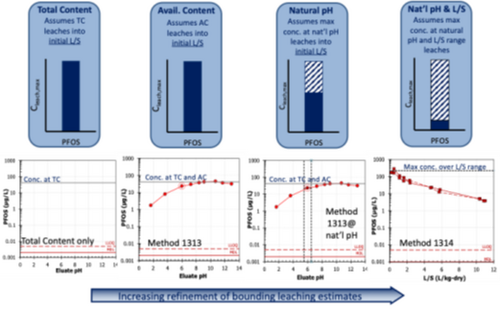
Figure 4. Example screening assessment for perfluorooctane sulfonate (PFOS) using total content and data from Methods 1313A and 1314A. Figure format adapted from Garrabrants
et al. 2021
[12].
LEAF provides a standardized, robust approach for evaluating PFAS release from impacted granular materials under a range of environmental conditions. The tests are complementary, capture a range of conditions, and vary in ease of implementation. This provides the flexibility for users to select the test or test combinations that best suit their project objectives, timeline, and budget. A common use of LEAF data is in screening level assessments. These are stepwise assessments that establish increasingly refined maximum leaching concentrations, Cleach,max (Figure 4), which can then be compared to regulatory limits such as maximum contaminant levels, when available. For example, a stepwise screening assessment might include:
- Assume the maximum leaching concentration is represented by the total content (total initial mass of contaminant present) leaching into the first L/S.
- Assume only the available content leaches into the first L/S where available content is the maximum mass released over pH 2-13 measured using Method 1313a. For many PFAS, total content is equal to available content meaning that all of the PFAS mass is available for leaching.
- Assume the leaching concentration at natural pH (measured in Method 1313A at natural pH or Method 1316A at L/S of 10) is maximum leaching concentration adjusted to the first L/S.
- Consider the maximum leaching concentration over the L/S range (Method 1314A or Method 1316A) and the upper estimate of leaching, or Cleach,max, is the concentration from either Step 3 or Step 4, whichever is greater.
Screening assessments may be sufficient to meet project goals, but when additional refinements of leaching estimates are needed, site-specific data (e.g., infiltration) can be combined with test data and computational approaches (e.g., fate and transport models) for more site-specific estimates of leaching. Example scenarios where LEAF may be used to evaluate PFAS-impacted solids include 1) estimating PFAS release from AFFF-impacted soils, 2) estimating PFAS release from biosolids-amended soils at land application sites, 3) providing transport parameters to model PFAS transport from the source zone to the saturated zone, and 4) evaluating PFAS release from treatment residuals such as soils or sediments treated by soil washing or thermal approaches.
Summary and Ongoing Research
The LEAF framework offers a reliable, replicable approach to evaluating PFAS release from solids. With recent adaptations for PFAS-specific considerations, LEAF methods provide valuable tools for regulators and practitioners in managing PFAS-contaminated materials and assessing long-term environmental risks. However, there are key areas of ongoing research, including:
- An interlab validation of Methods 1313A, 1314A, and 1316A in coordination with the EPA
- Optimization and demonstration of Method 1315A for use with PFAS-impacted solids
- Evaluation of an unsaturated Method 1314A protocol to assess the need for and ability of LEAF testing to capture air-water interfacial partitioning of PFAS
- Application of the total oxidizable precursor (TOP) assay for evaluating the maximum additional PFAS leaching that may occur as a result of polyfluoroalkyl precursor transformation
- Comparison of LEAF testing data to previously collected field-scale enhanced flushing data collected from the same site
Additionally, there are key areas for consideration in future research:
- Collection of paired field-laboratory data under ambient conditions to further validate the applicability of LEAF assessments for estimation of field-relevant PFAS leaching and mobility
- Consideration of biotransformation in modeling and interpretation of LEAF data, as the state of the science regarding biotransformation of polyfluoroalkyl substances to terminal perfluoroalkyl acids advances
Other LEAF Resources
There are numerous resources describing the development of the LEAF leaching methods for inorganics. They are not specific to PFAS, but are still valuable resources focused on LEAF implementation, applications, and management of LEAF data. They include:
References
- ^ 1.0 1.1 1.2 1.3 1.4 1.5 1.6 1.7 Garrabrants, A.C., Liu, F., Warne, R., DeLapp, R., Brown, L., Rubin, Z., Yawson, D., Kosson, D.S., Guelfo, J.L., Real, M.I., van der Sloot, H.A., Touati, A., Thorneloe, S., 2024. Development of Leaching Tests for Materials Containing SVOCs and PFAS, EPA 600/R-23/382, USEPA, Washington, D.C. Free Download EPA 600/R-23/382
- ^ Garrabrants, A.C., Kosson, D.S., Stefanski, L., DeLapp, R., Seignette, P.F.A.B., van der Sloot, H.A., Kariher, P., Baldwin, M., 2012. Interlaboratory Validation of the Leaching Environmental Assessment Framework (LEAF) Method 1313 and Method 1316, EPA/600/R-12/623, U.S. Environmental Protection Agency, Air Pollution and Control Division. Free Download EPA 600/R-12/623
- ^ Garrabrants, A.C., Kosson, D.S., DeLapp, R., Kariher, P., Seignette, P.F.A.B., van der Sloot, H.A., Stefanski, L., Baldwin, M., 2012. Interlaboratory Validation of the Leaching Environmental Assessment Framework (LEAF) Method 1314 and Method 1315, EPA/600/R-12/624, U.S. Environmental Protection Agency, Air Pollution and Control Division. Free Download EPA 600/R-12/624
- ^ USEPA, 2026. Hazardous Waste Test Methods / SW-846. USEPA SW-846 website
- ^ 5.0 5.1 Higgins, C.P., Luthy, R.G., 2006. Sorption of Perfluorinated Surfactants on Sediments. Environmental Science and Technology, 40(23), pp. 7251–7256. doi: 10.1021/es061000n
- ^ 6.0 6.1 Nguyen, T.M.H., Bräunig, J., Thompson, K., Thompson, J., Kabiri, S., Navarro, D.A., Kookana, R.S., Grimison, C., Barnes, C.M., Higgins, C.P., McLaughlin, M.J., Mueller, J.F., 2020. Influences of Chemical Properties, Soil Properties, and Solution pH on Soil–Water Partitioning Coefficients of Per- and Polyfluoroalkyl Substances (PFASs). Environmental Science and Technology, 54(24), pp. 15883–15892. doi: 10.1021/acs.est.0c05705 Open Access Article
- ^ Lopez Meza, S., Garrabrants, A.C., van der Sloot, H., Kosson, D.S., 2008. Comparison of the Release of Constituents from Granular Materials under Batch and Column Testing. Waste Management, 28(10), pp. 1853–1867. doi: 10.1016/j.wasman.2007.11.009
- ^ Schaefer, C.E., Nguyen, D., Christie, E., Shea, S., Higgins, C.P., Field, J., 2022. Desorption Isotherms for Poly- and Perfluoroalkyl Substances in Soil Collected from an Aqueous Film-Forming Foam Source Area. Journal of Environmental Engineering, 148(1), Article 04021074. doi: 10.1061/(ASCE)EE.1943-7870.0001952
- ^ Guelfo, J.L., Higgins, C.P., 2013. Subsurface Transport Potential of Perfluoroalkyl Acids at Aqueous Film-Forming Foam (AFFF)-Impacted Sites. Environmental Science and Technology, 47(9), pp. 4164–4171. doi: 10.1021/es3048043
- ^ Doria-Manzur, A., Gray, E.P., Streets, S.S., Guelfo, J.L., 2025. Per- and Polyfluoroalkyl Substances (PFAS) Transport from Biosolids-Amended Soils: An Experimental and Numerical Approach. Water Research, 288(Part B), Article 124674. doi: 10.1016/j.watres.2025.124674 Open Access Article
- ^ Guelfo, J.L., Wunsch, A., McCray, J., Stults, J.F., Higgins, C.P., 2020. Subsurface Transport Potential of Perfluoroalkyl Acids (PFAAs): Column Experiments and Modeling. Journal of Contaminant Hydrology, 233, Article 103661. doi: 10.1016/j.jconhyd.2020.103661 Open Access Manuscript
- ^ Garrabrants, A.C., Kosson, D.S., Brown, K.G., Fagnant, D.P., Helms, G., Thorneloe, S.A., 2021. Methodology for Scenario-Based Assessments and Demonstration of Treatment Effectiveness Using the Leaching Environmental Assessment Framework (LEAF). Journal of Hazardous Materials, 406, Article 124635. doi: 10.1016/j.jhazmat.2020.124635 Open Access Manuscript
See Also


