File list
This special page shows all uploaded files.
| Date | Name | Thumbnail | Size | User | Description | Versions |
|---|---|---|---|---|---|---|
| 16:37, 22 January 2020 | Hawkins2013 LNAPL at GW SW Interfaces.pdf (file) | 2.35 MB | Debra Tabron | 6. Hawkins, A. M., 2013. Processes Controlling the Behavior of LNAPLs at Groundwater Surface Water Interfaces, Master of Science Thesis, Colorado State University, Ft. Collins, Colorado. | 1 | |
| 16:35, 22 January 2020 | Gatsios2018 LNAPL Transmissivity as Metric.pdf (file) | 1.62 MB | Debra Tabron | 5. Gatsios, E., García-Rincon, J., Rayner, J.L., McLaughlan, R.G., Davis, G.B., 2018. LNAPL transmissivity as a remediation metric in complex sites under water table fluctuations. Journal of Environmental Management No. 215, pp 40-48 | 1 | |
| 16:18, 22 January 2020 | CRCCARE2018 Measurement Guidance for LNAPL NSZD.pdf (file) | 19.25 MB | Debra Tabron | 4. CRC CARE, 2018. Technical measurement guidance for LNAPL natural source zone depletion. Cooperative Research Centre for Contamination Assessment and Remediation of the Environment, Newcastle, Australia. Technical Report no. 44. 254pp. | 1 | |
| 16:06, 22 January 2020 | API2007 LDRM.pdf (file) | 1.08 MB | Debra Tabron | API, 2007. LNAPL Distribution and Recovery Model (LDRM), Volume 1: Distribution and Recovery of Petroleum Hydrocarbon Liquids in Porous Media. American Petroleum Institute publication No. 4760. Free download | 1 | |
| 15:59, 13 January 2020 | 2002-Aziz-Biochlor Natural Attenuation Decision Support System Vs 2.2.pdf (file) | 570 KB | Debra Tabron | Aziz, C.E., Newell, C.J., Gonzales, J.R., 2002. BIOCHLOR Natural Attenuation Decision Support System, Version 2.2. Technology Transfer Division, Air Force Center for Environmental Excellence, Brooks AFB, San Antonio, Texas. | 1 | |
| 12:10, 13 January 2020 | 2010-Liang-Decision and Management Tools for DNAPL sites-ER-200704-FR.pdf (file) | 4.22 MB | Debra Tabron | Liang, H., Newell, C.J. Farhat, S.K., Rao, P.S.C., Basu, N., 2010. Decision & Management Tools for DNAPL Sites: Optimization of Chlorinated Solvent Source and Plume Remediation Considering Uncertainty. ESTCP ER-200704. | 1 | |
| 12:08, 13 January 2020 | 2012-Falta-REMFuel Remediation Evaluation-Model for Fuel hydrocarbons users manual.PDF (file) | 1.38 MB | Debra Tabron | Falta, R.W., Ahsanuzzaman, A.N.M., Stacy, M., Earle, R.C., 2012. REMFuel: Remediation Evaluation Model for Fuel hydrocarbons, User’s Manual Version 1.0. EPA/600/R-12/028. | 1 | |
| 11:59, 13 January 2020 | 2008-Sale-Frequently Asked Questions Regarding Management of Chlorinated Solvent in Soils and Groundwater.pdf (file) | 2.54 MB | Debra Tabron | Sale, T., C. Newell, H. Stroo, R. Hinchee, and P. Johnson, 2008. Frequently Asked Questions Regarding Management of Chlorinated Solvent in Soils and Groundwater, Developed for the Environmental Security Testing and Certification Program (ER-200530). | 1 | |
| 11:57, 13 January 2020 | 2002-Newell-Calculation and Use of First-Order Rate Constants for Monitored Natural Attenuation Studies.pdf (file) | 662 KB | Debra Tabron | Newell, C.J., Rifai, H.S., Wilson, J.T., Connor, J.A., Aziz, J.A., Suarez, M.P., 2002. Calculation and Use of First-Order Rate Constants for Monitored Natural Attenuation Studies. 28p. EPA/540/S-02/500. | 1 | |
| 11:55, 13 January 2020 | 1999 USEPA- Use of monitored natural attenuation at superfund.pdf (file) | 1.9 MB | Debra Tabron | U.S. Environmental Protection Agency, 1999. Use of monitored natural attenuation at superfund, RCRA corrective action, and underground storage tank sites. OSWER Directive 9200.4-17P. 39pp | 1 | |
| 11:10, 10 January 2020 | Yuncu1w2TBA.png (file) |  |
2 KB | Jhurley | 1 | |
| 11:08, 10 January 2020 | Yuncu1w2MTBE.png (file) |  |
7 KB | Jhurley | 1 | |
| 11:07, 10 January 2020 | Yuncu1w2Pyrene.png (file) |  |
14 KB | Jhurley | 1 | |
| 11:04, 10 January 2020 | Yuncu1w2Phenanthrene.png (file) |  |
26 KB | Jhurley | 1 | |
| 11:03, 10 January 2020 | Yuncu1w2Naphthalene.png (file) |  |
43 KB | Jhurley | 1 | |
| 11:01, 10 January 2020 | Yuncu1w2Indeno123CDpyrene.png (file) |  |
4 KB | Jhurley | 1 | |
| 11:00, 10 January 2020 | Yuncu1w2 9hFluorene.png (file) |  |
5 KB | Jhurley | 1 | |
| 10:59, 10 January 2020 | Yuncu1w2Fluoranthene.png (file) |  |
3 KB | Jhurley | 1 | |
| 10:57, 10 January 2020 | Yuncu1w2Chrysene.png (file) |  |
6 KB | Jhurley | 1 | |
| 10:56, 10 January 2020 | Yuncu1w2BenzoKfluoranthene.png (file) |  |
9 KB | Jhurley | 1 | |
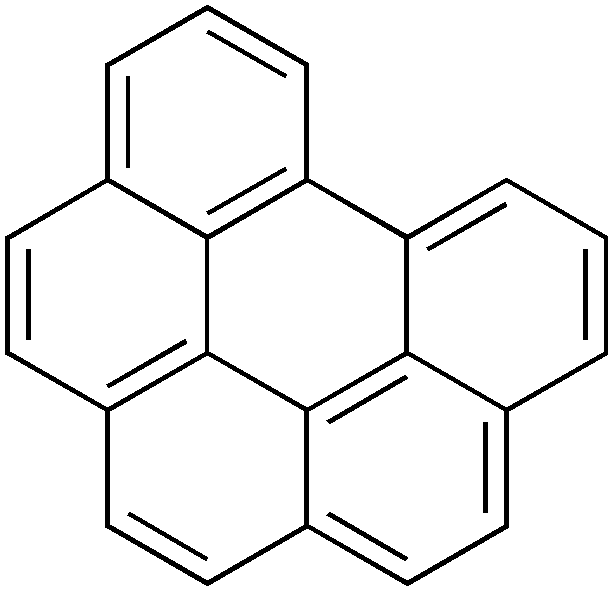
| 10:54, 10 January 2020 | Yuncu1w2BenzoGHIperylene.png (file) |  |
9 KB | Jhurley | 1 | |
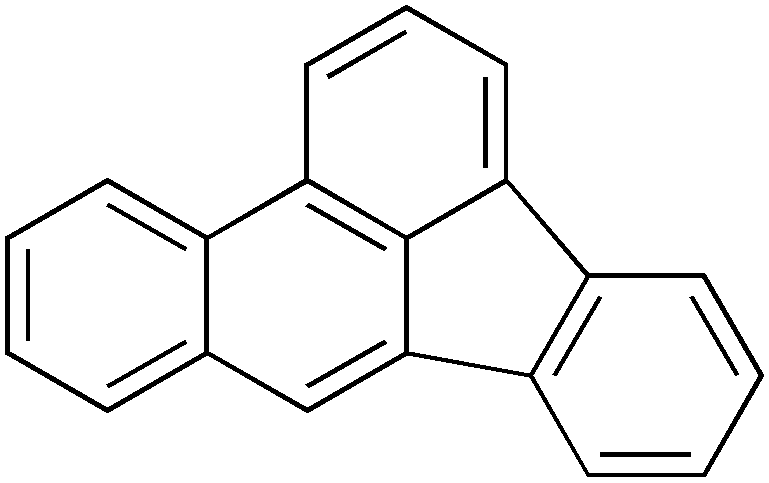
| 10:53, 10 January 2020 | Yuncu1w2BenzoBfluoranthene.png (file) |  |
9 KB | Jhurley | 1 | |
| 10:10, 10 January 2020 | Yuncu1w2BenzoApyrene.png (file) |  |
23 KB | Jhurley | 1 | |
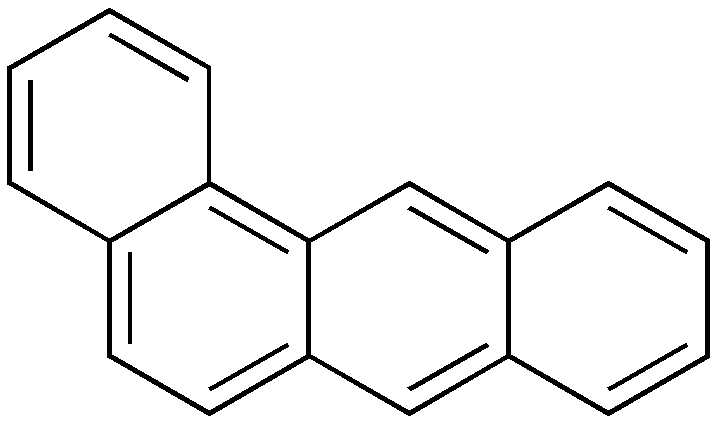
| 10:05, 10 January 2020 | Yuncu1w2BenzAanthracene.png (file) |  |
7 KB | Jhurley | 1 | |
| 10:03, 10 January 2020 | Yuncu1w2Anthracene.png (file) |  |
59 KB | Jhurley | 1 | |
| 10:03, 10 January 2020 | Yuncu1w2Acenaphthylene.png (file) |  |
2 KB | Jhurley | 1 | |
| 10:02, 10 January 2020 | Yuncu1w2 12Dihydroacenaphthylene.png (file) |  |
2 KB | Jhurley | 1 | |
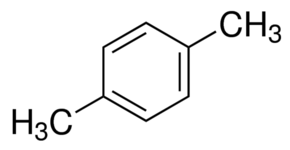
| 09:59, 10 January 2020 | Yuncu1w2 14Dimethylbenzene.png (file) |  |
21 KB | Jhurley | 1 | |
| 09:57, 10 January 2020 | Yuncu1w2 12Dimethylbenzene.png (file) |  |
3 KB | Jhurley | 1 | |
| 09:56, 10 January 2020 | Yuncu1w2 13Dimethylbenzene.png (file) |  |
3 KB | Jhurley | 1 | |
| 09:54, 10 January 2020 | Yuncu1w2Methylbenzene.png (file) |  |
3 KB | Jhurley | 1 | |
| 09:52, 10 January 2020 | Yuncu1w2Ethylbenzene.png (file) |  |
5 KB | Jhurley | 1 | |
| 16:22, 9 January 2020 | Wilson1w2Fig6.png (file) |  |
236 KB | Debra Tabron | Figure 6. Example calibration of NAS to predict the reduced concentration at the source that is necessary to meet the remediation goal at a point-of-compliance well (Figure 19 of NAS User’s Manual). | 1 |
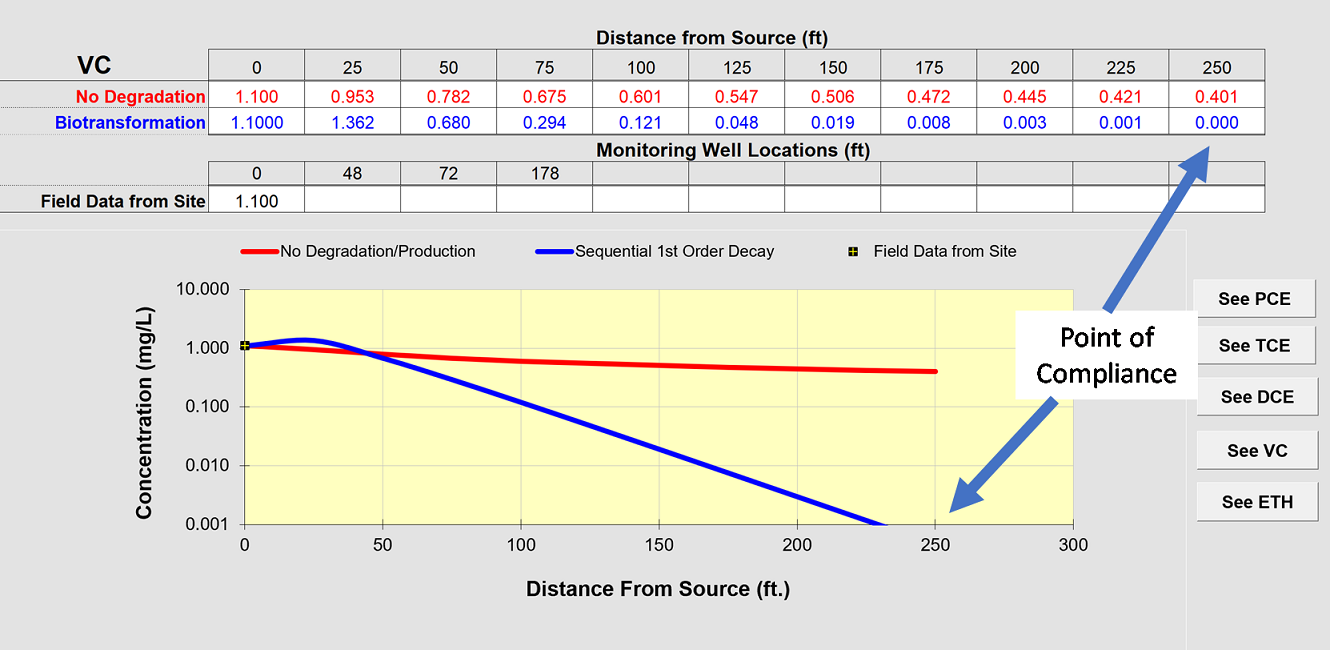
| 16:19, 9 January 2020 | Wilson1w2Fig5.png (file) |  |
197 KB | Debra Tabron | Figure 5. Output of the RUN CENTERLINE simulation of conditions after an active remedy was implemented with a source concentration of 1.1 mg/L, projecting the concentration of vinyl chloride at a distance corresponding to a point-of-compliance well. | 1 |
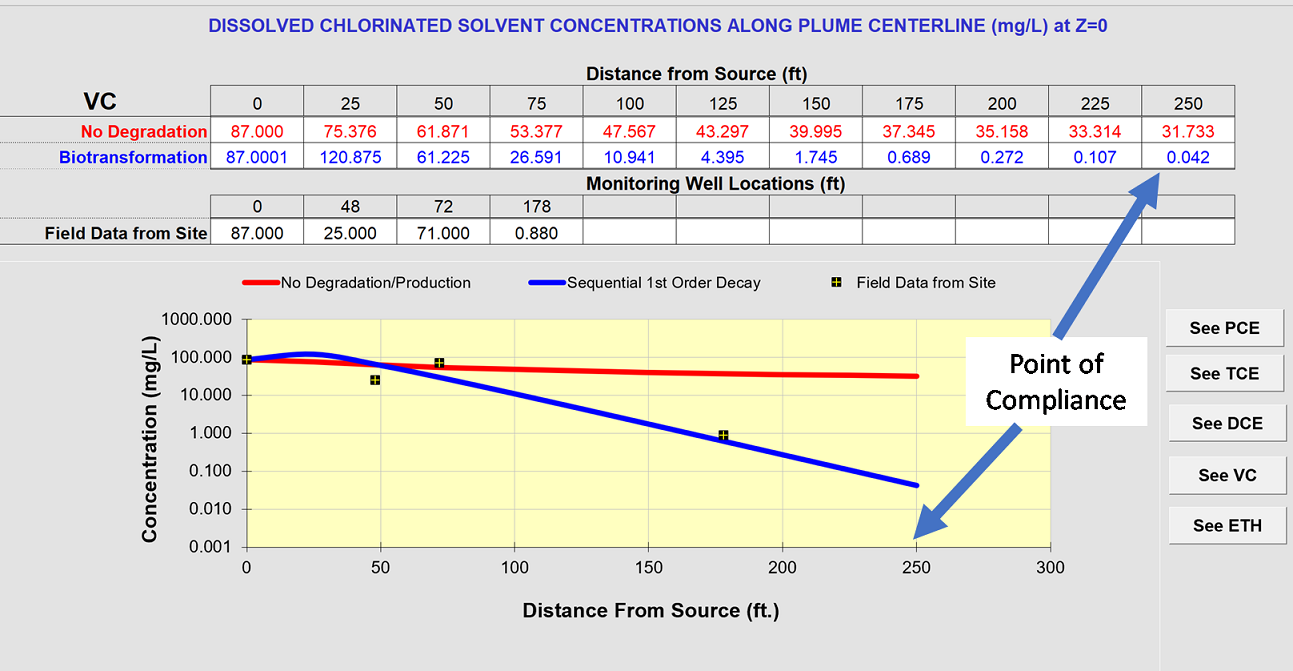
| 16:16, 9 January 2020 | Wilson1w2Fig4.png (file) |  |
240 KB | Debra Tabron | Figure 4. Output of the RUN CENTERLINE simulation in BIOCHLOR comparing the fit between the simulation and the field data for vinyl chloride before an active remedy was implemented. | 1 |
| 16:14, 9 January 2020 | Wilson1w2Fig3.png (file) |  |
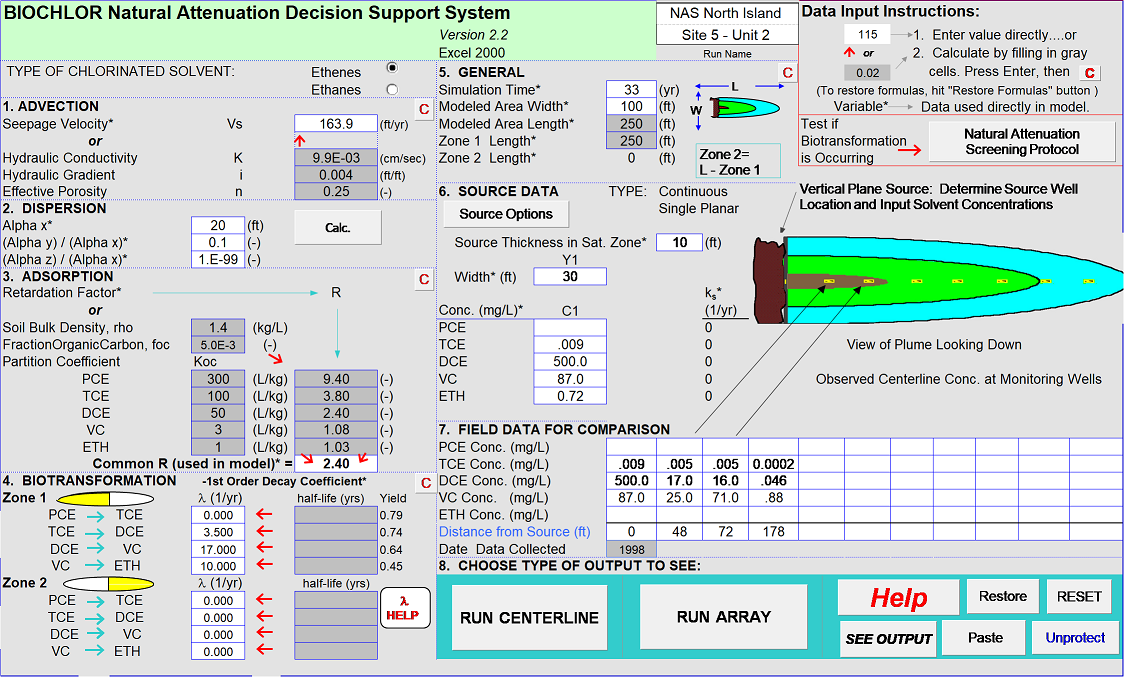
458 KB | Debra Tabron | Figure 3. The data input screen for BIOCHLOR before remediation with cis-1,2-Dichloroethene (DCE) and vinyl chloride (VC) source concentrations of 500 and 87 mg/L respectively at the source when the release first occurred | 1 |
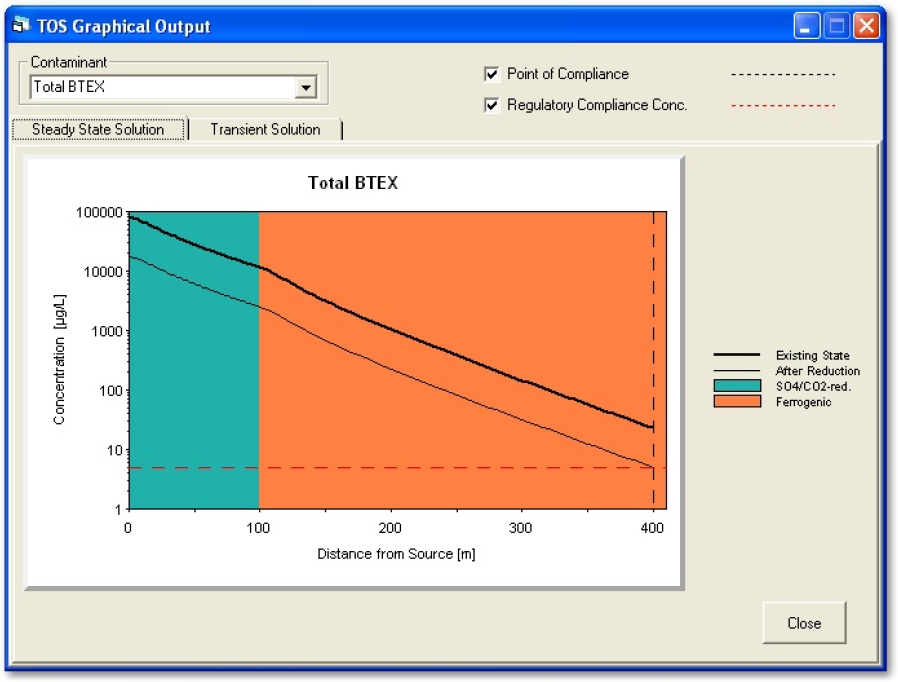
| 16:06, 9 January 2020 | Wilson1w2Fig2.png (file) |  |
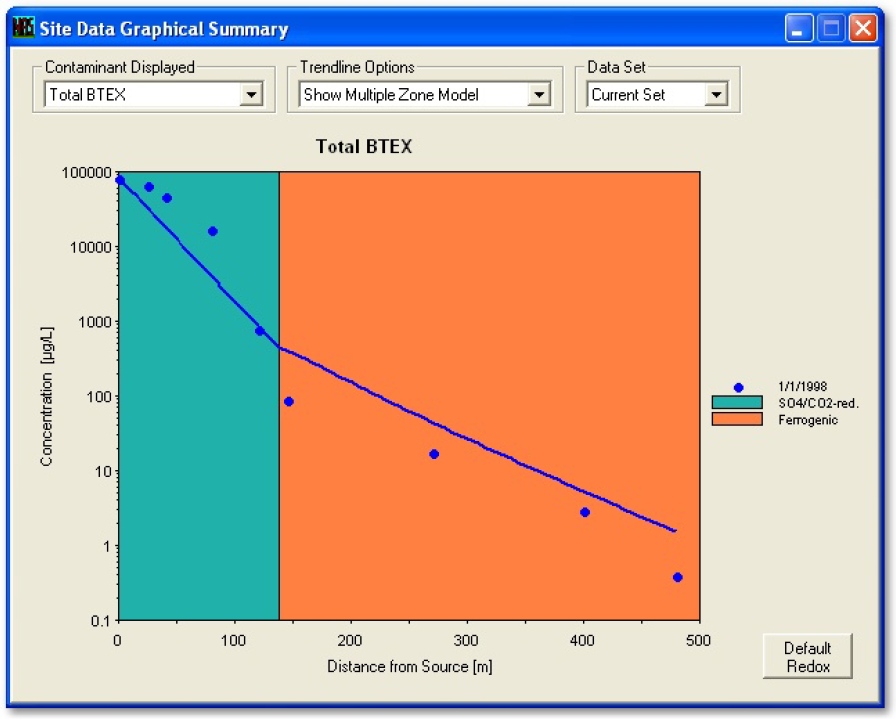
237 KB | Debra Tabron | Figure 2. Example calibration of NAS to natural attenuation of total BTEX at a site (Figure 17 of NAS User’s Manual). | 1 |
| 16:00, 9 January 2020 | Wilson1w2Fig1.png (file) |  |
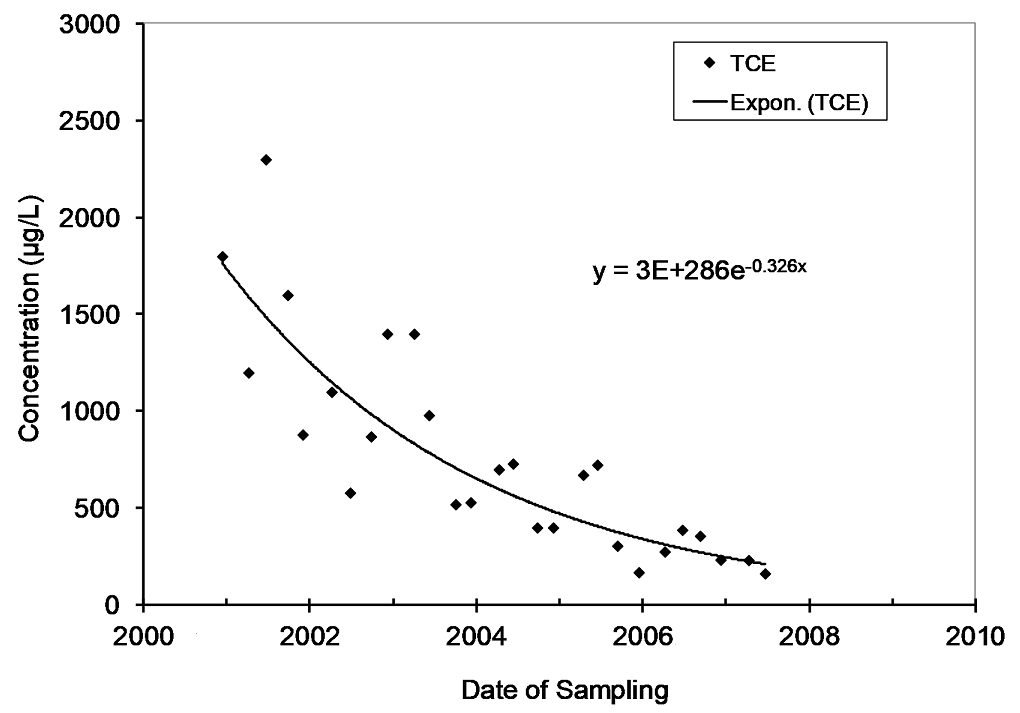
55 KB | Debra Tabron | Figure 1. Attenuation of Trichloroethene (TCE) over time in a monitoring well at a site in Michigan. The concentration vs. time rate constant is 0.326 per year and largely represents the rate of the attenuation of the source of contaminants in the aq... | 1 |
| 15:55, 9 January 2020 | Yuncu1w2Benzene.png (file) |  |
20 KB | Jhurley | 1 | |
| 10:02, 27 December 2019 | Schwartz 2014 NCA3 Chap 05 Transportation.pdf (file) | 4.68 MB | Jhurley | 1 | ||
| 09:40, 27 December 2019 | Bjornas 2015 A guide to RCPs.pdf (file) | 129 KB | Jhurley | 1 | ||
| 16:10, 26 December 2019 | Kotamarthi1w2Fig4.png (file) |  |
77 KB | Jhurley | 2 | |
| 16:17, 19 December 2019 | Kotamarthi1w2Fig5.png (file) |  |
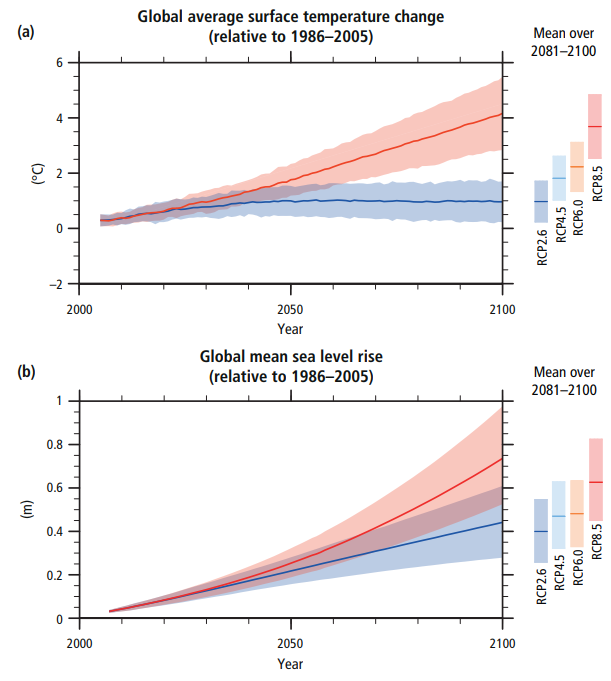
83 KB | Debra Tabron | Figure 5- (a) Global average near-surface air temperature; and (b) mean sea level rise projections <ref name = "IPCC2014B"/>. | 1 |
| 16:02, 19 December 2019 | Kotamarthi1w2Fig3.png (file) |  |
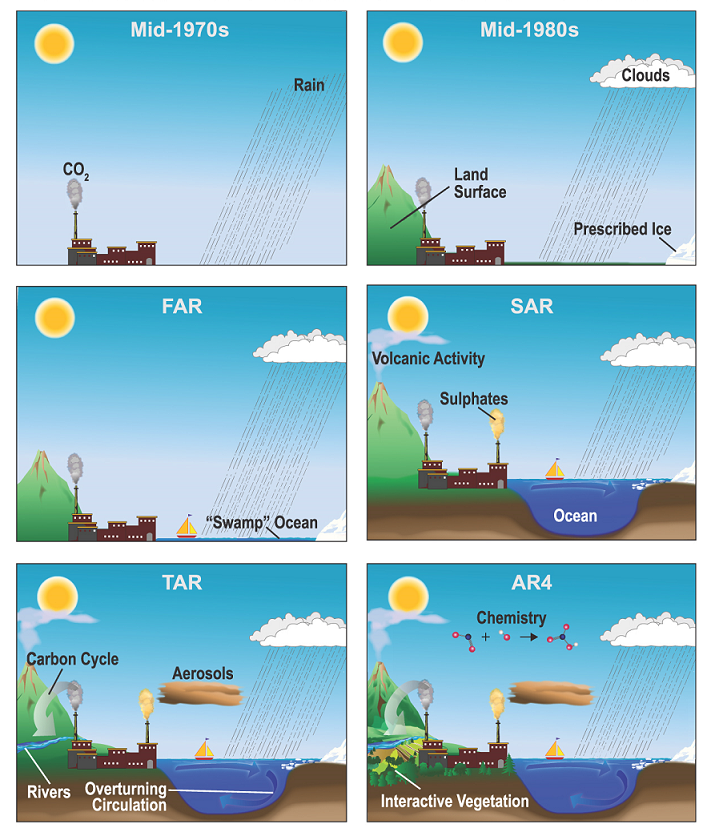
748 KB | Debra Tabron | Figure 3: Evolution of climate models over the past 50 years (IPCC, 2013) <ref name= "IPCC2013"> IPCC, 2013. Climate Change 2013: The Physical Science Basis. Contribution of Working Group I to the Fifth Assessment Report of the Intergovernmental Panel... | 1 |
| 15:56, 19 December 2019 | Kotamarthi1w2Fig2.png (file) |  |
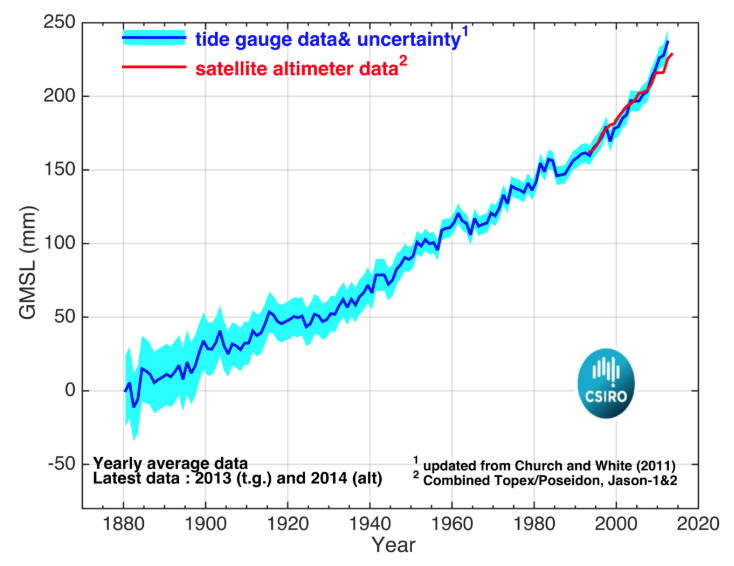
109 KB | Debra Tabron | Figure 2. Changes in global mean sea-level (GMSL) from 1880 to present. Source: [https://research.csiro.au/slrwavescoast/sea-level/ Global Mean Sea Level (GMSL) – 1880 to the end of 2014] | 1 |
| 15:55, 19 December 2019 | Kotamarthi1w2Fig1.png (file) |  |
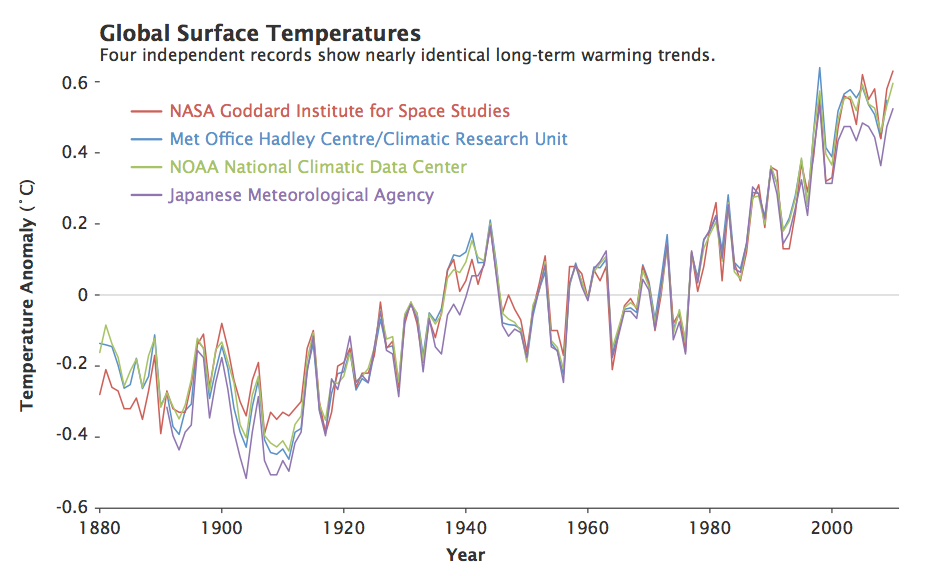
133 KB | Debra Tabron | Figure 1: Global surface temperature anomalies for the past 100+ years compared to the 1961-1990 average. Source | 1 |
| 10:48, 19 December 2019 | 2017-USGCRP-Climate Science Special Report Fourth National Climate Assessment, Vol 1..pdf (file) | 27.81 MB | Debra Tabron | U.S. Global Change Research Program (USGCRP), 2017. Climate Science Special Report: Fourth National Climate Assessment, Volume I (Wuebbles, D. J., D.W. Fahey, K.A. Hubbard, D.J. Dokkeb, B.C. Stewart and T.K. Maycock(eds)). U.S. Global Change Research P... | 1 | |
| 10:33, 19 December 2019 | 2012-Taylor-An overview of CMIP5 and the experiment design.pdf (file) | 1.83 MB | Debra Tabron | Taylor, K.E., R.J. Stouffer, G.A. Meehl, 2012. An overview of CMIP5 and the experiment design. Bulletin of the American Meteorological Society, vol. 93, pp. 485-498. doi:10.1175/BAMS-D-11-00094.1 | 1 | |
| 09:53, 19 December 2019 | 2012-Parris-Global sea level rise scenarios for the US National Climate Assessment.pdf (file) | 5.61 MB | Debra Tabron | Parris, A., P. Bromirski, V. Burkett, D. Cayan, M. Culver, J. Hall, R. Horton, K. Knuuti, R. Moss, J. Obeysekera, A. Sallenger, and J. Weiss. 2012. Global sea level rise scenarios for the US National Climate Assessment. NOAA Tech Memo OAR CPO-1. 37 pp. | 1 | |
| 08:57, 19 December 2019 | 2010-NIH-HealthEffectsOfClimateChange(NIEHS).pdf (file) | 268 KB | Debra Tabron | National Institutes of Health (NIH), 2010. Fact Sheet – Health Effects of Climate Change | 1 |