File list
This special page shows all uploaded files.
| Date | Name | Thumbnail | Size | User | Description | Versions |
|---|---|---|---|---|---|---|
| 12:52, 12 September 2016 | Roote-2008-In Situ Flushing.pdf (file) | 182 KB | Astenger | 1 | ||
| 12:49, 12 September 2016 | ITRC-1997-Tech & Reg Guidelines for Soil Washing.pdf (file) | 625 KB | Astenger | 1 | ||
| 12:24, 12 September 2016 | Pivetz-2001-Phytoremediation.pdf (file) | 181 KB | Astenger | 1 | ||
| 12:15, 12 September 2016 | Van Cauwenberghe-1997-Electrokinetics.pdf (file) | 129 KB | Astenger | 1 | ||
| 12:11, 12 September 2016 | Mercer-1990-Basics of Pump & Treat.pdf (file) | 558 KB | Astenger | 1 | ||
| 12:05, 12 September 2016 | Post-2013-100-C-7 Remediation Project.pdf (file) | 990 KB | Astenger | 1 | ||
| 11:46, 12 September 2016 | Evanko-1997-Remed of Metals.pdf (file) | 211 KB | Astenger | 1 | ||
| 10:06, 12 September 2016 | USEPA-2010-MNA of Inorganic Contaminants in GW, Vol 3.pdf (file) | 5.56 MB | Astenger | 1 | ||
| 10:06, 12 September 2016 | USEPA-2007-MNA of Inorganic Contaminants in GW, Vol 2.pdf (file) | 1.55 MB | Astenger | 1 | ||
| 09:42, 7 September 2016 | Newell-Article 1-Equation 1rr.jpg (file) | 11 KB | Debra Tabron | Newell-Article 1-Equation 1 | 1 | |
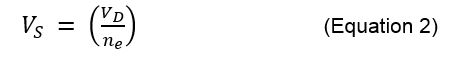
| 09:13, 7 September 2016 | Newell-Article 1-Equation 2r.jpg (file) | 11 KB | Debra Tabron | Chuck Newell- Article 2 - Equation 2 | 1 | |
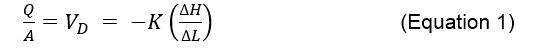
| 09:09, 7 September 2016 | Newell-Article 1-Equation 1r.jpg (file) | 12 KB | Debra Tabron | Chuck Newell - Article 1 - Equation 1 | 1 | |
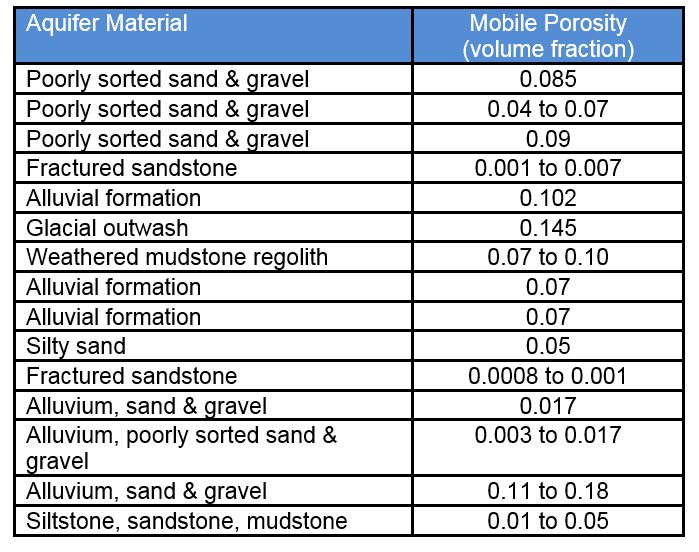
| 15:43, 6 September 2016 | Newell-Article 1-Table2r.jpg (file) |  |
103 KB | Debra Tabron | Table 2. Mobile Porosity Estimates from Tracer Tests | 1 |
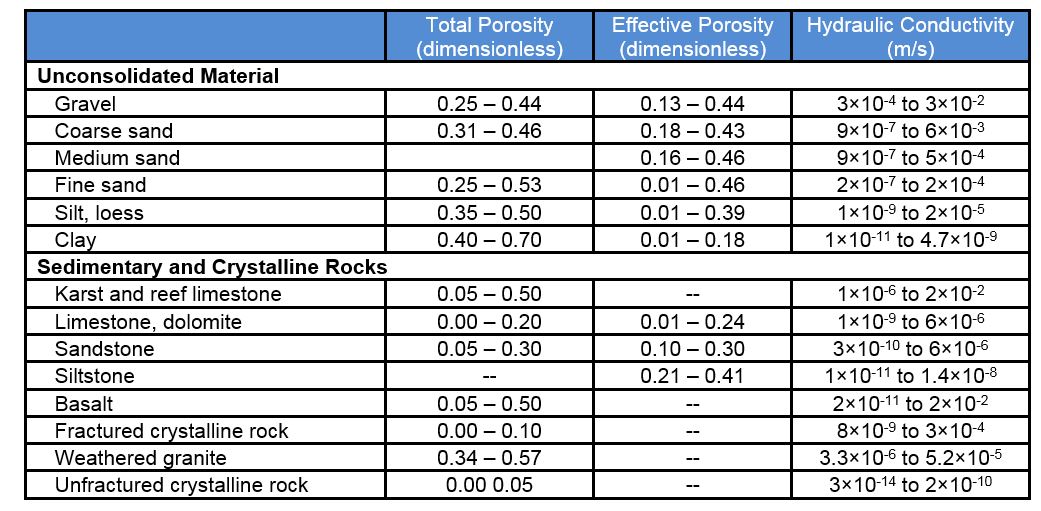
| 15:38, 6 September 2016 | Newell-Article 1-Table1r.jpg (file) |  |
138 KB | Debra Tabron | Table 1. Representative Values of Total Porosity (n), Effective Porosity (ne), and Hydraulic Conductivity (K) for Different Aquifer Materials | 1 |
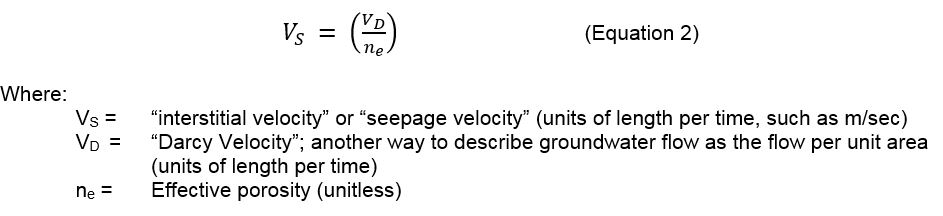
| 13:52, 2 September 2016 | Newell-Article 1-Equation 2.jpg (file) | 36 KB | Debra Tabron | Since Darcy’s time, there has been a significant variation of Darcy’s Law which is used to calculate the actual velocity that the groundwater is moving, such as meters traveled per year. This quantity is called “interstitial velocity” or “see... | 1 | |
| 13:50, 2 September 2016 | Newell-Article 1-Equation 1.jpg (file) |  |
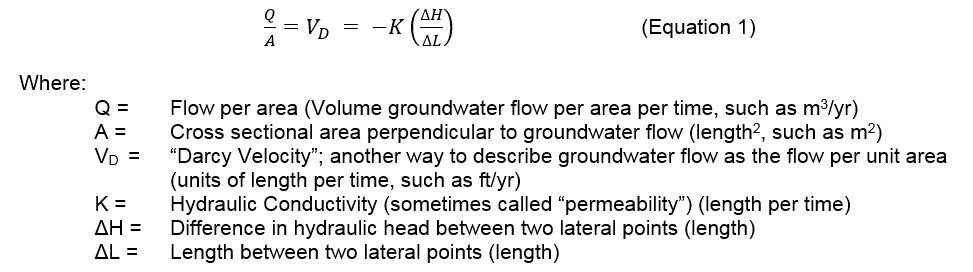
58 KB | Debra Tabron | In unconsolidated geologic settings (gravel, sand, silt, and clay) and highly fractured systems, the rate of groundwater movement can be expressed using Darcy’s Law. This law is a fundamental mathematical relationship in the groundwater field and can... | 1 |
| 13:41, 2 September 2016 | Newell-Article 1-Fig4.JPG (file) |  |
89 KB | Debra Tabron | Figure 4. Difference between Darcy Velocity (also called Specific Discharge) and Seepage Velocity (also called Interstitial Velocity). | 1 |
| 13:39, 2 September 2016 | Newell-Article 1-Fig3..JPG (file) |  |
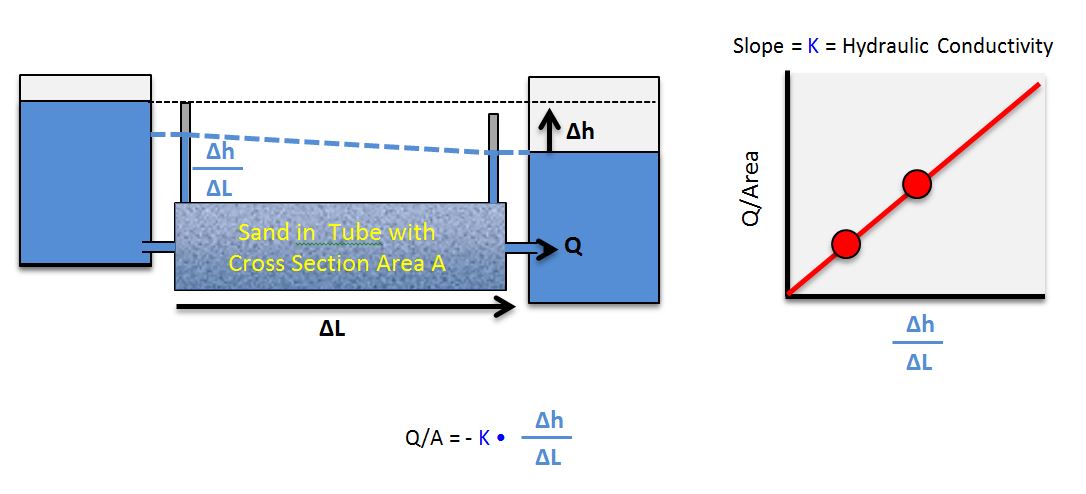
51 KB | Debra Tabron | Figure 3: Conceptual explanation of Darcy’s Law based on Darcy’s experiment. Adapted from course notes developed by Dr. R.J. Mitchell (Western Washington University). | 1 |
| 13:37, 2 September 2016 | Newell-Article 1-Fig2.jpg (file) |  |
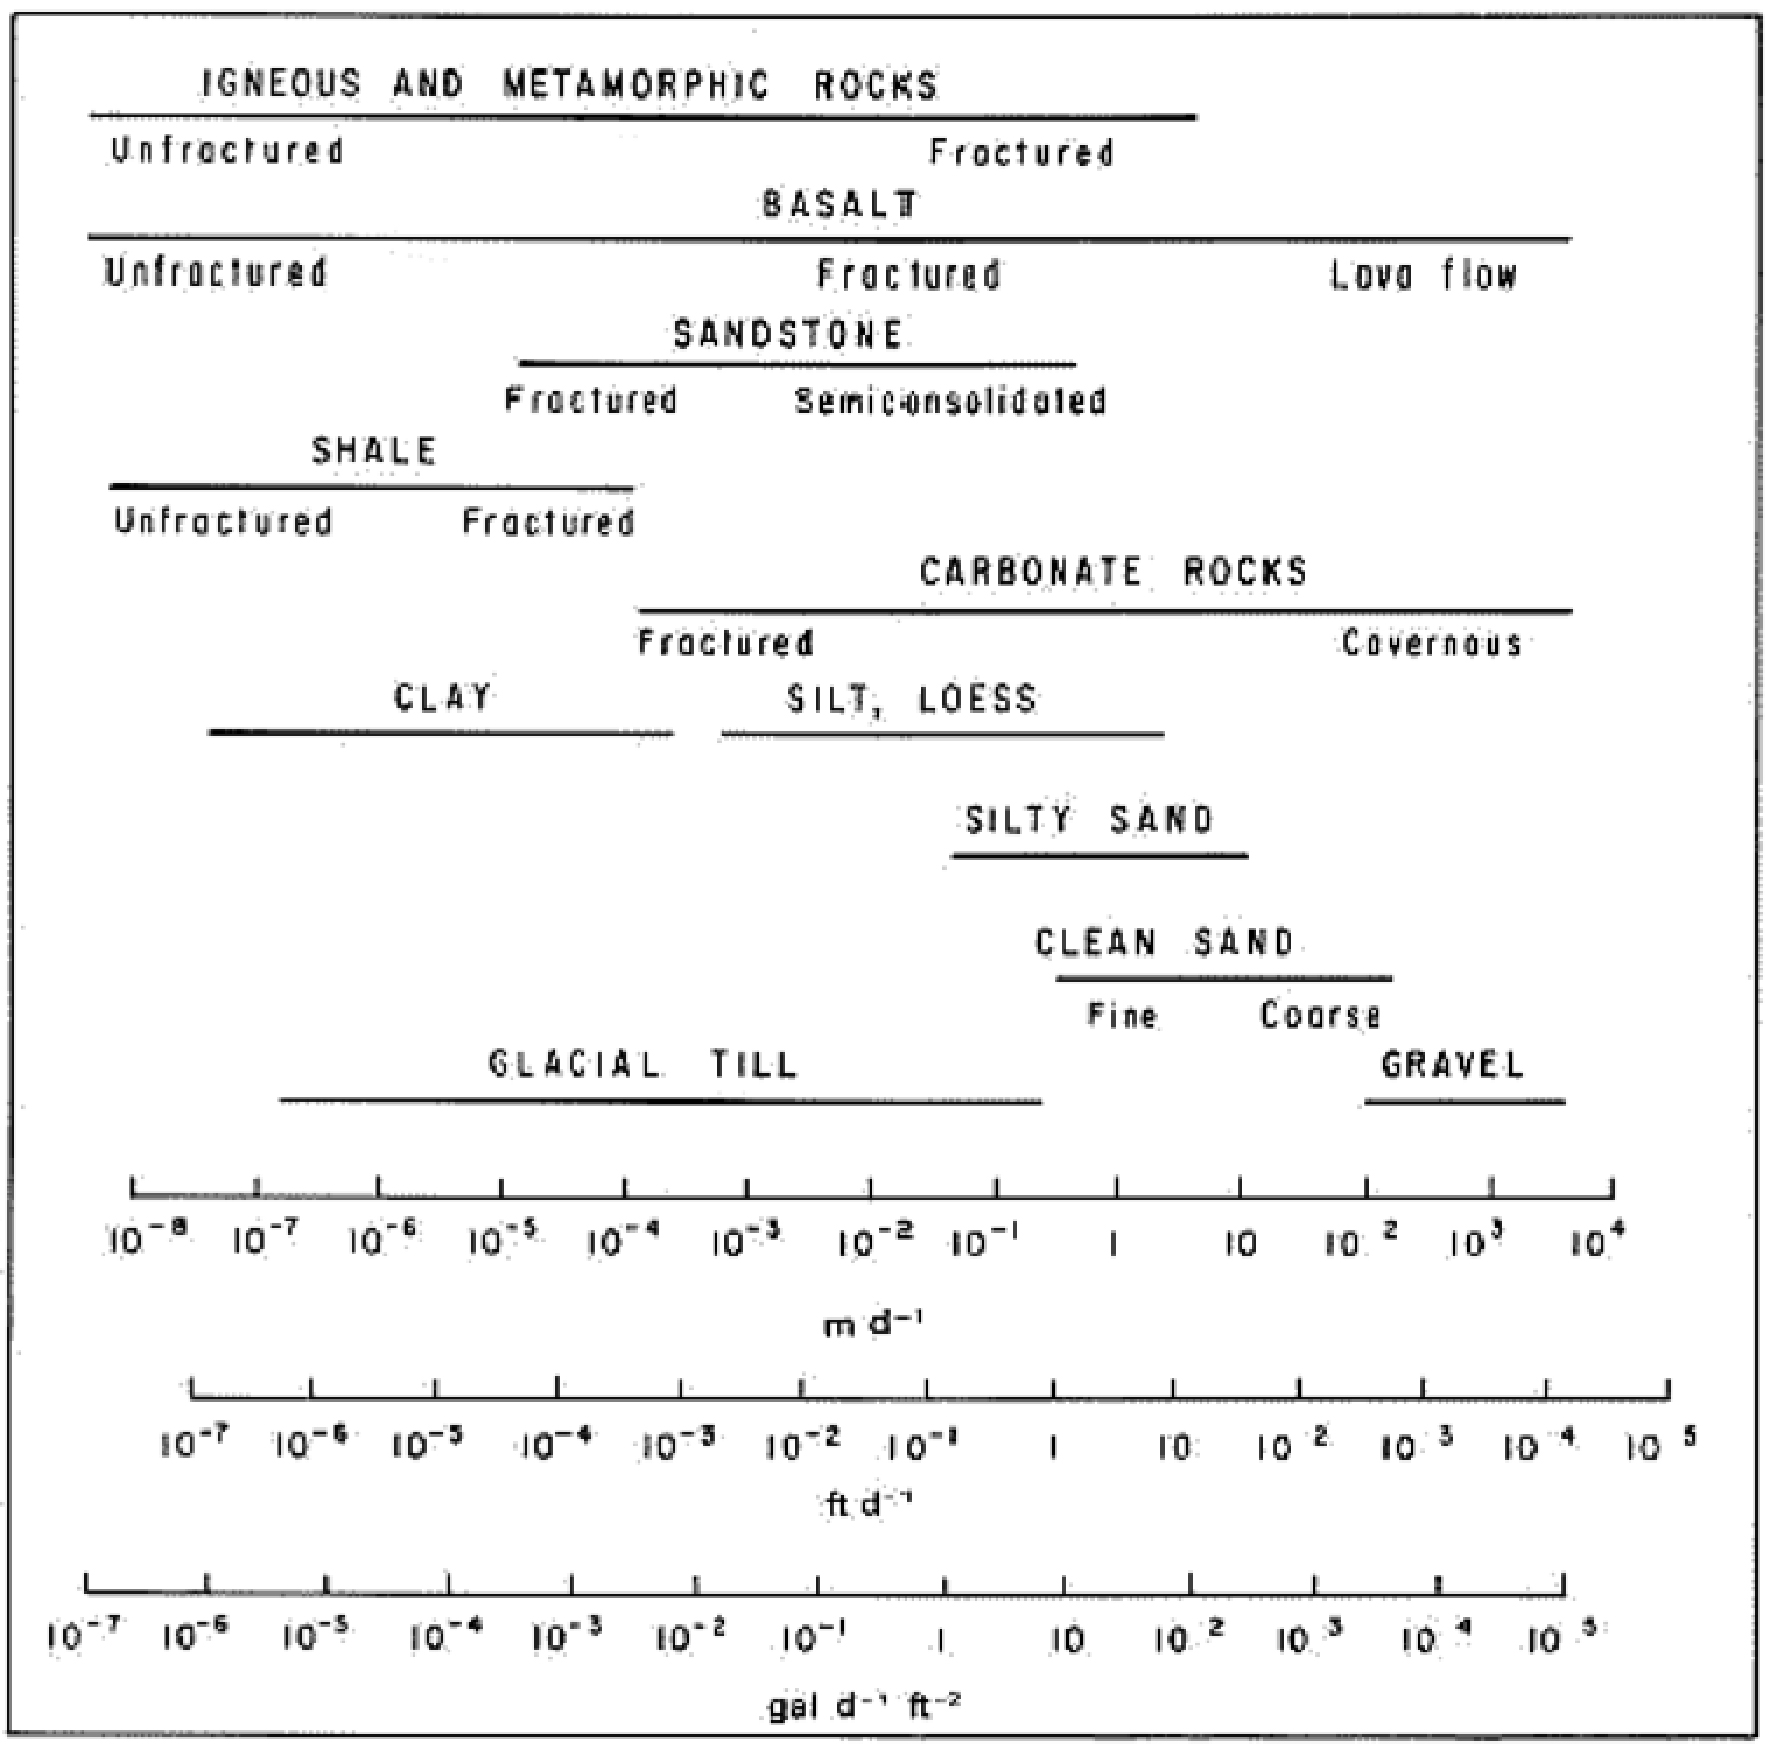
469 KB | Debra Tabron | Figure 2. Hydraulic Conductivity of Selected Rocks (from Heath, 1983). | 1 |
| 16:41, 1 September 2016 | Heath-1983-Basic groundwater hydrology water supply paper.pdf (file) | 13.1 MB | Debra Tabron | Heath, R.C., 1983. Basic ground-water hydrology, U.S. Geological Survey Water-Supply Paper 2220, 86p. | 1 | |
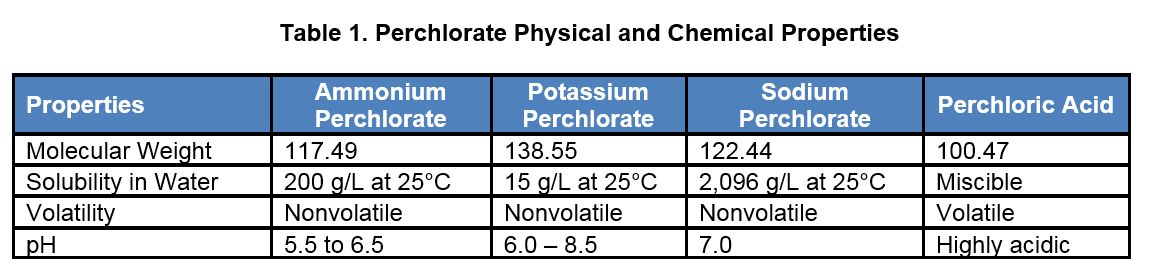
| 15:04, 30 August 2016 | Krug-Article 1. Table1 perchlorate.PNG (file) | 31 KB | Debra Tabron | Table 1. Perchlorate Physical and Chemical Properties | 1 | |
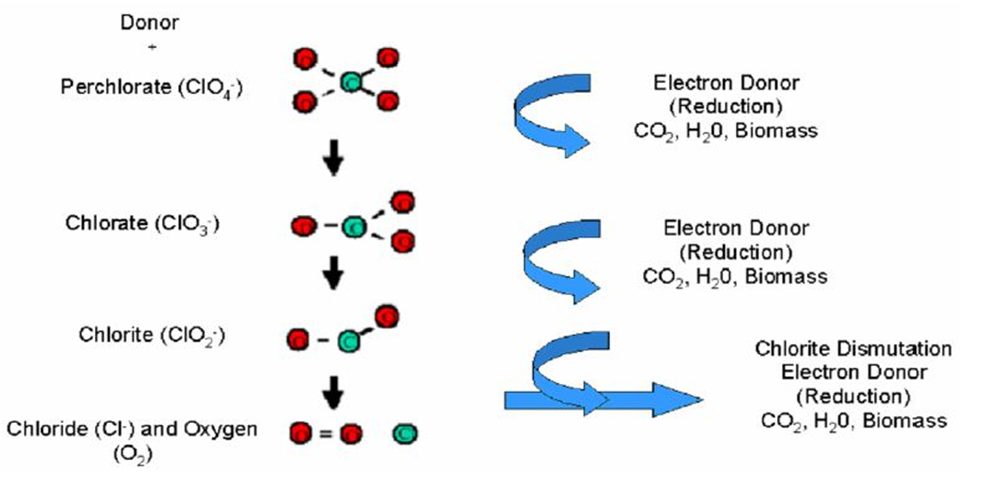
| 15:03, 30 August 2016 | Krug-article 1. Fig2 Biodegradation Pathways.PNG (file) |  |
232 KB | Debra Tabron | Figure 2: Biodegradation Pathways for Perchlorate | 1 |
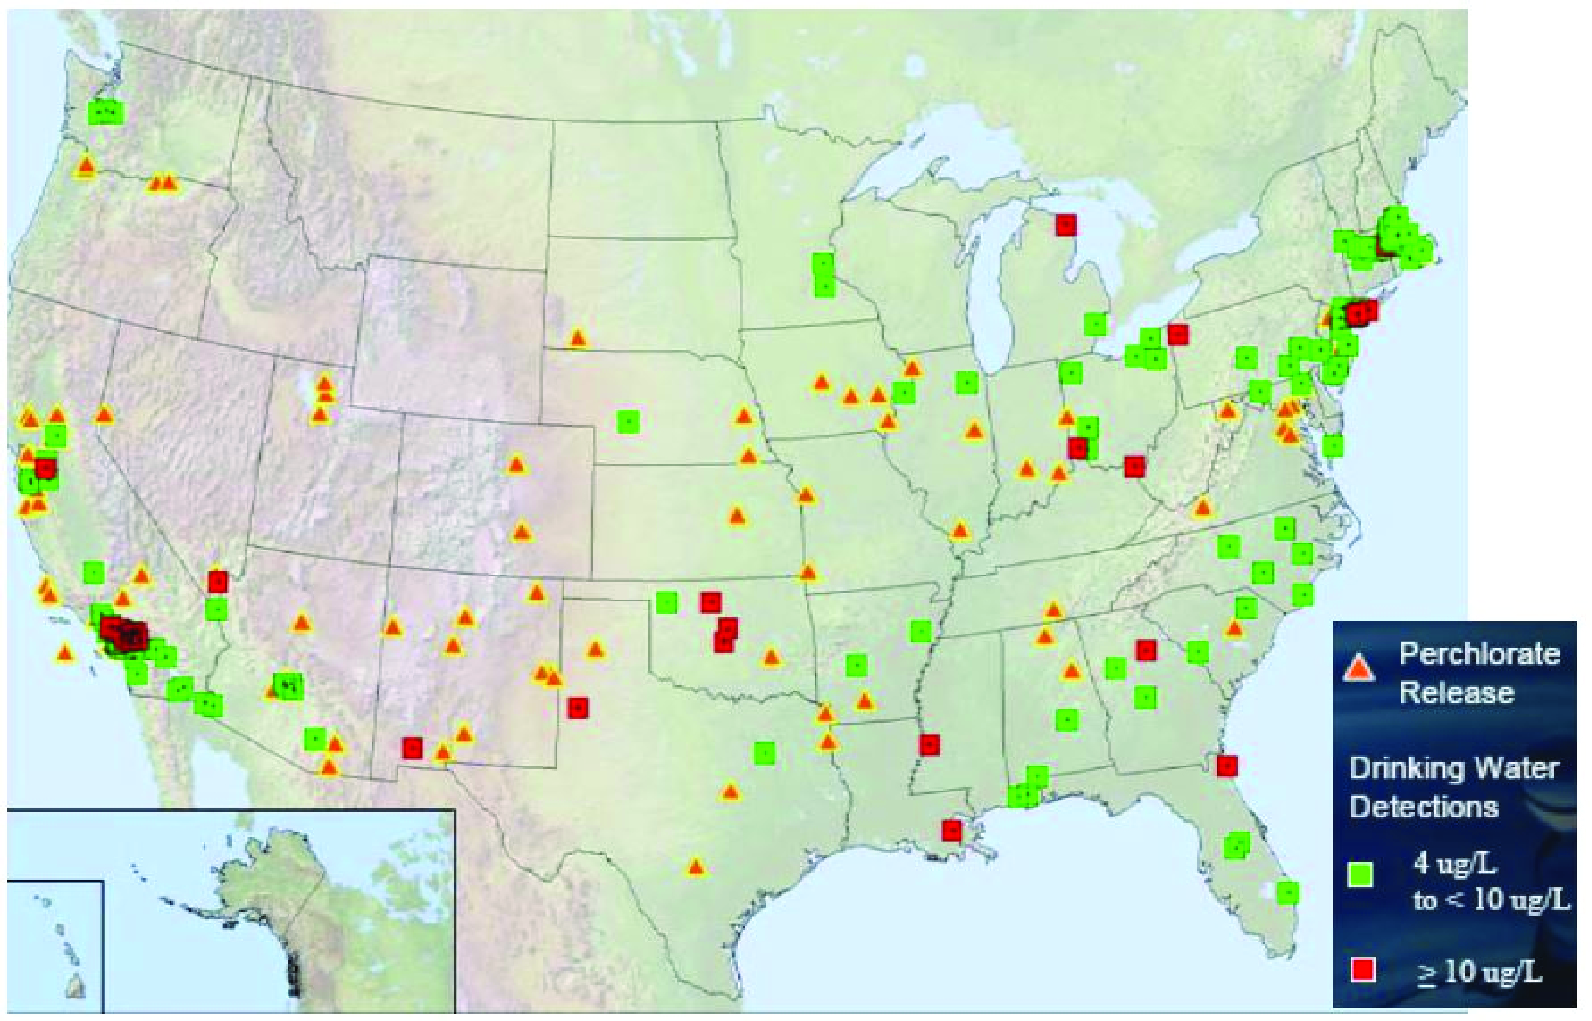
| 15:00, 30 August 2016 | Krug-Article 1. Fig1 perchlorate.jpg (file) |  |
1.88 MB | Debra Tabron | Figure 1: Perchlorate Releases and Drinking Water Detections | 1 |
| 09:58, 29 August 2016 | McCall Article 3 Figure 11.PNG (file) |  |
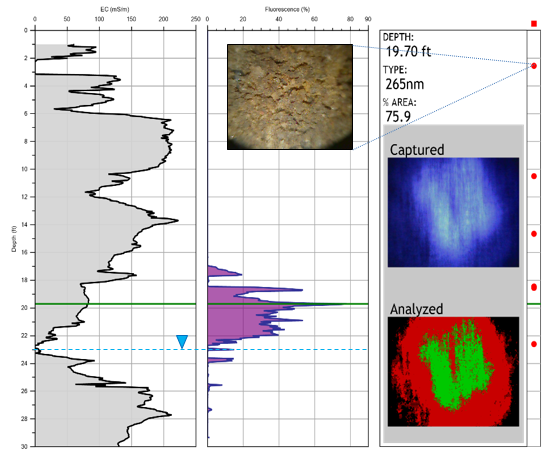
159 KB | Debra Tabron | Figure 11: OIP log with EC plotted on left, % area of fluorescence plotted on the right graph (shaded). Example of a captured image displaying fluorescence (mid-right) and analysis of the image used to determine % area of fluorescence below. Fuel pro... | 1 |
| 09:57, 29 August 2016 | McCall Article 3 Figure 10.PNG (file) |  |
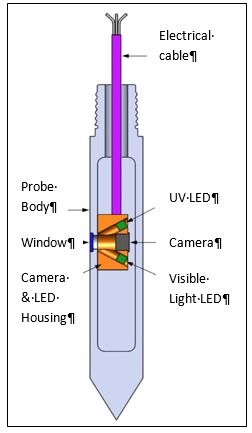
14 KB | Debra Tabron | Figure 10: Schematic of the OIP Probe. | 1 |
| 09:55, 29 August 2016 | McCall Article 3 Figure 9.PNG (file) |  |
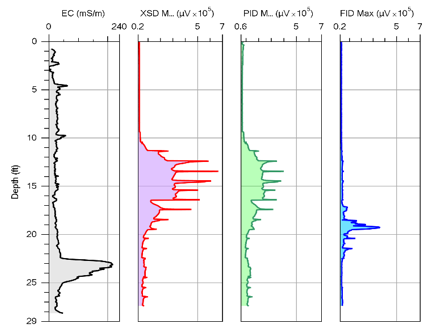
34 KB | Debra Tabron | Figure 9: An MIP log, l to r: EC log, XSD, PID and FID detector responses versus depth identifying presence and levels of VOC contamination. | 1 |
| 09:53, 29 August 2016 | McCall Article 3 Figure 8.PNG (file) |  |
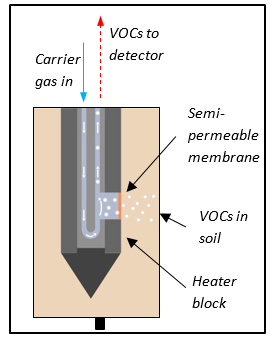
21 KB | Debra Tabron | Figure 8: Schematic of MIP depicting principles of operation. | 1 |
| 09:50, 29 August 2016 | McCall Article 3 Figure 7.PNG (file) |  |
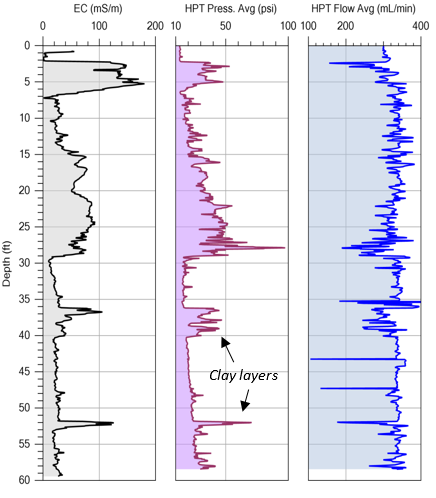
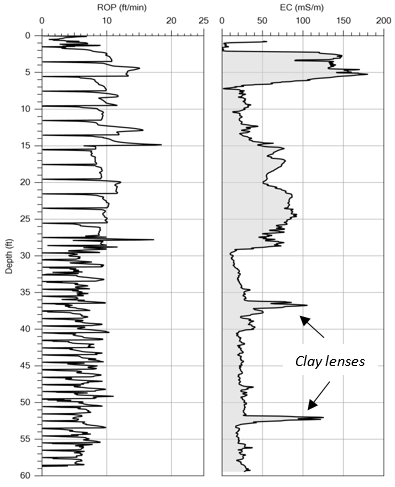
75 KB | Debra Tabron | Figure 7: An HPT log with EC on left, injection pressure in middle, and flow rate on right. Note good agreement between the EC and HPT pressure logs. Mostly coarse grained below 29 ft with 2 clay layers defined. See also Fig. 5. | 1 |
| 09:46, 29 August 2016 | McCall Article 3 Figure 6.PNG (file) |  |
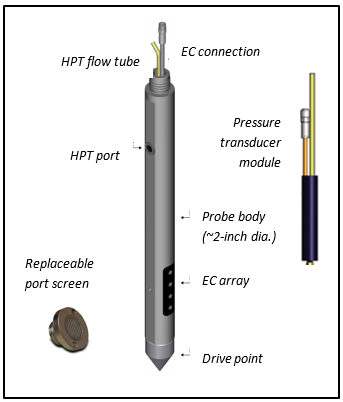
24 KB | Debra Tabron | Figure 6: Schematic of an HPT probe. | 1 |
| 16:14, 26 August 2016 | McCall Article 3 Figure 5.PNG (file) |  |
50 KB | Debra Tabron | Figure 5: A typical EC log with rate of penetration (ROP) plotted on left and bulk formation EC on right. The decrease in EC and ROP at ~29ft indicates transition to coarser grained materials (sands). | 1 |
| 16:13, 26 August 2016 | McCall Article 3 Figure 4.PNG (file) |  |
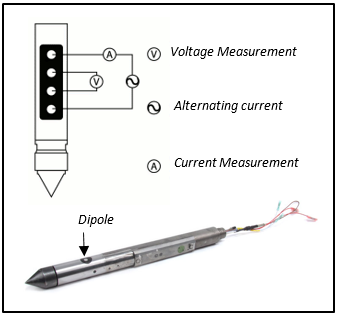
36 KB | Debra Tabron | Figure 4: A Wenner array probe (top) and a dipole array built into an MIP probe. | 1 |
| 16:12, 26 August 2016 | McCall Article 3 Figure 3.PNG (file) |  |
93 KB | Debra Tabron | Figure 3: A CPTu log displaying l to r: lithologic graph based on log interpretation, tip resistance, sleeve friction, pore pressure and friction ratio. | 1 |
| 16:11, 26 August 2016 | McCall Article 3 Figure 2.PNG (file) |  |
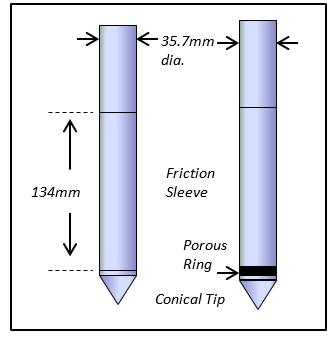
10 KB | Debra Tabron | Figure 2: A CPT cone (left) and piezocone (right) with porous ring. | 1 |
| 16:10, 26 August 2016 | McCall Article 3 Figure 1.PNG (file) |  |
58 KB | Debra Tabron | Figure 1: General components of a DP logging system. | 1 |
| 15:25, 26 August 2016 | OI Analytical-2001-1656 appl USEPA Halogen XSDvsELCD.pdf (file) | 145 KB | Debra Tabron | OI Analytical, 2001. Using the Halogen Specific Detector (XSDTM) as an alternative to the ELCD in USEPA Methods: Presented at the 2001 Pittsburgh Conference on Analytical Chemistry and Applied Spectroscopy, New Orleans, LA | 1 | |
| 14:34, 19 August 2016 | McCall Article 2. Figure 1.PNG (file) |  |
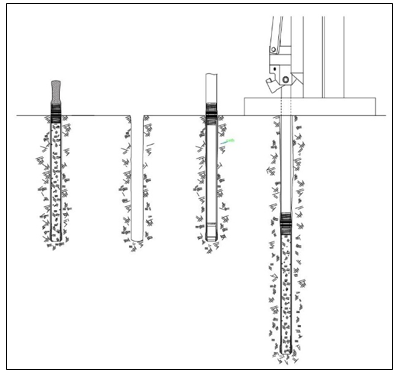
39 KB | Debra Tabron | Figure 1: Sampling sequence with an open-barrel, single-tube soil sampling system. The sample barrel is advanced through the open borehole to succeeding depths. | 1 |
| 13:15, 18 August 2016 | McCall Article 2. Figure 7.PNG (file) |  |
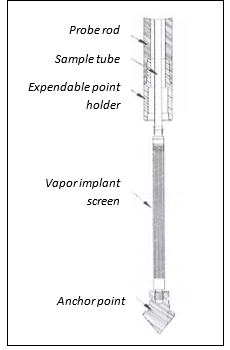
24 KB | Debra Tabron | Figure 7: Components of a screened implant system for long term monitoring of VOCs in soil gas. | 1 |
| 13:13, 18 August 2016 | McCall Article 2. Figure 6.PNG (file) |  |
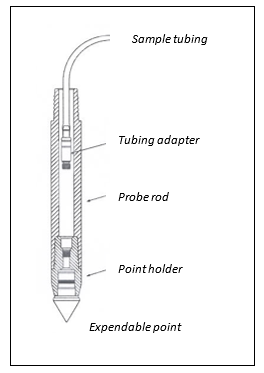
24 KB | Debra Tabron | Figure 6: Components of a direct push soil gas sampling tool string for active soil gas sampling. | 1 |
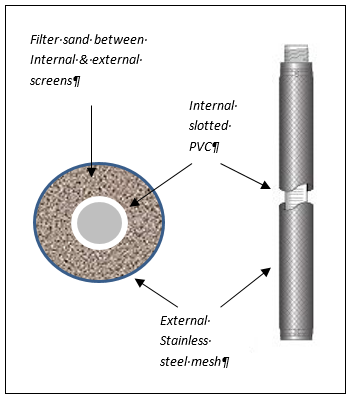
| 13:12, 18 August 2016 | McCall Article 2. Figure 5.PNG (file) |  |
54 KB | Debra Tabron | Figure 5: Structure of a prepacked screen used to build monitoring wells with DP methods. | 1 |
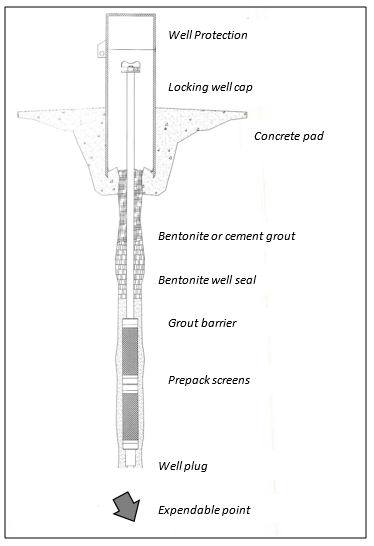
| 13:10, 18 August 2016 | McCall Article 2. Figure 4.PNG (file) |  |
43 KB | Debra Tabron | Figure 4: A DP installed monitoring well constructed with prepacked well screens. | 1 |
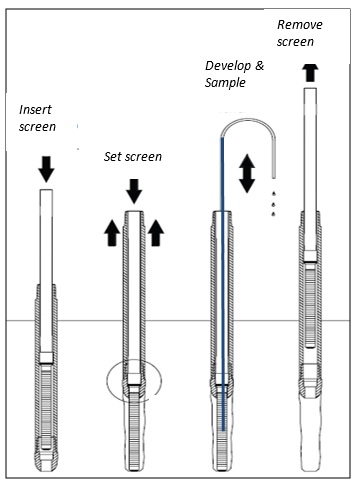
| 13:04, 18 August 2016 | McCall Article 2. Figure 3.PNG (file) |  |
49 KB | Debra Tabron | Figure 3: Steps in the operation of a dual-tube groundwater sampler | 1 |
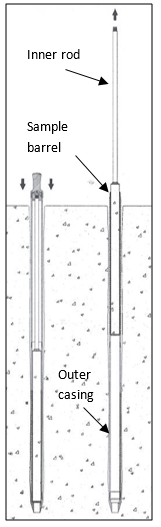
| 13:04, 18 August 2016 | McCall Article 2. Figure 2.PNG (file) |  |
51 KB | Debra Tabron | Figure 2: The outer casing of the dual-tube system remains in place to control the bore hole as the inner rod is used to trip out the sample barrel with soil core. | 1 |
| 15:32, 11 August 2016 | McCall-Article 1-Figure 5.PNG (file) |  |
24 KB | Debra Tabron | Figure 5: Top-down materials injection with a pressure activated probe. | 1 |
| 15:30, 11 August 2016 | McCall-Article 1-Figure 4.PNG (file) |  |
13 KB | Debra Tabron | Figure 4: Bottom-up tremie grouting through a tool string. | 1 |
| 15:26, 11 August 2016 | McCall-Article 1-Figure 3.PNG (file) |  |
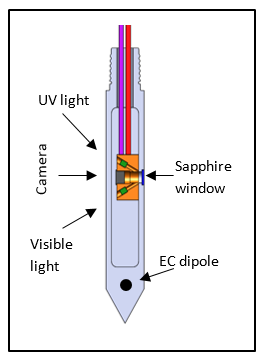
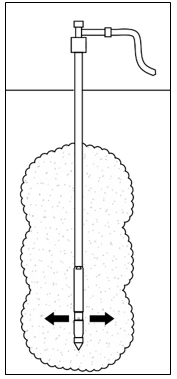
32 KB | Debra Tabron | Figure 3: Schematic of the Optical Image Profiler (OIP) that uses an ultraviolet light emitting diode (UV LED) and CMOS camera to induce and capture images of petroleum fuel fluorescence through a sapphire window. | 1 |
| 15:21, 11 August 2016 | McCall-Article 1-Figure 2.PNG (file) |  |
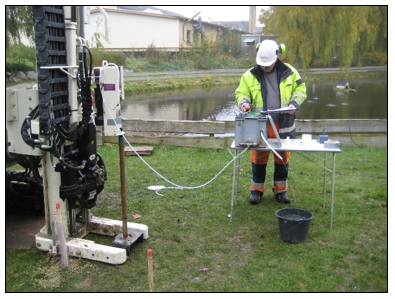
315 KB | Debra Tabron | Figure 2: Monitoring water quality parameters while purging groundwater from a single-tube, protected screen, discrete interval sampler | 1 |
| 15:19, 11 August 2016 | McCall-Article 1-Figure 1.PNG (file) |  |
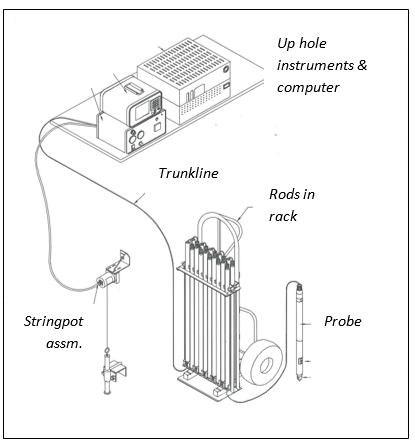
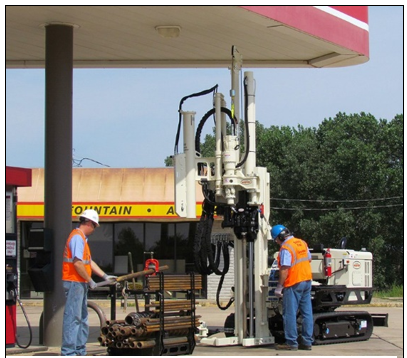
342 KB | Debra Tabron | Figure 1: A track mounted DP machine set up for collection of soil and groundwater samples. The tool rack is transported to the sample location on the stabilizer bar at the back of the unit | 1 |
| 15:45, 4 August 2016 | USEPA-1999-Understanding variation in partition coefficient, Kd values-Vol 1.pdf (file) | 3.61 MB | Debra Tabron | United States Environmental Protection Agency (USEPA), 1999. Understanding variation in partition coefficient, Kd, values, Volume 1 – The Kd model, methods of measurement, and application of chemical reaction codes. EPA 402-R-99-004A | 1 | |
| 15:17, 4 August 2016 | USEPA-2007-MNA of Inorganic Contaminants in GW, Vol 1 Technical Basis for Assessment.pdf (file) | 2.16 MB | Debra Tabron | U.S.E.P.A., 2007. Monitored Natural Attenuation of Inorganic Contaminants in Groundwater, Volume 1 Technical Basis for Assessment, Edited by R.G. Ford, R.T. Wilkin, and R.W. Puls. U.S. Environmental Protection Agency, EPA/600/R-07/139. | 1 | |
| 14:38, 4 August 2016 | Palmisano-2003 Bioremed. of Metals and Radionuclides What it is and How it Works.pdf (file) | 2.75 MB | Debra Tabron | Palmisano, A. and Hazen, T., 2003. Bioremediation of metals and radionuclides: What it is and how it works. Lawrence Berkeley National Laboratory. | 1 |