File list
This special page shows all uploaded files.
| Date | Name | Thumbnail | Size | User | Description | Versions |
|---|---|---|---|---|---|---|
| 12:30, 3 November 2016 | NABIR-2003-Bioremediation of Metals and Radionuclides.pdf (file) | 2.75 MB | Debra Tabron | NABIR, 2003. Bioremediation of Metals and Radionuclides – What It Is And How It Works. LBNL-42595, Lawrence Berkeley National Laboratory, for the Natural and Accelerated Bioremediation Research Program, Office of Science, U.S. Department of Energy | 1 | |
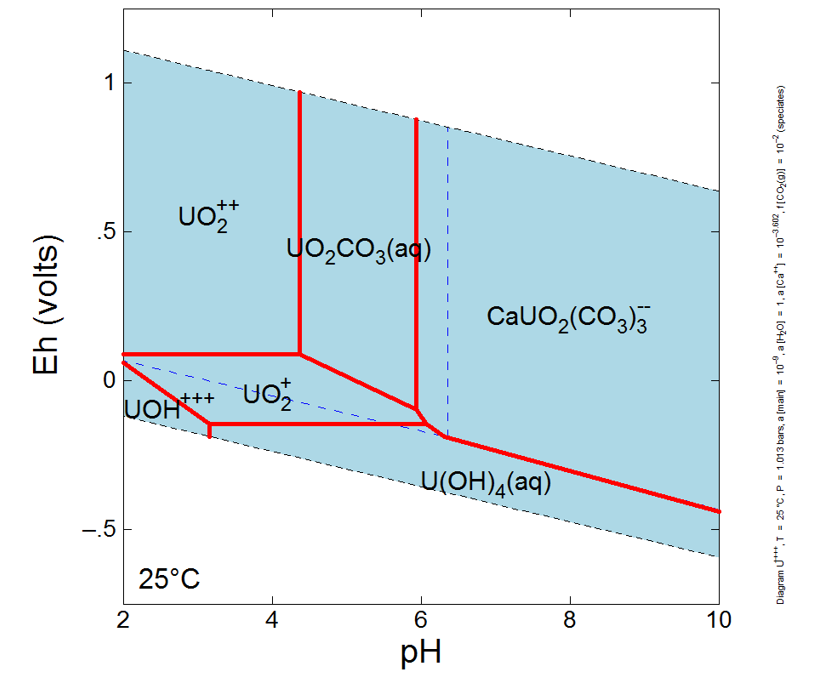
| 14:16, 1 November 2016 | Denham-Article 1-Figure 1. PNG.PNG (file) |  |
82 KB | Debra Tabron | Figure 1: Uranium’s complicated aqueous speciation (diagram produced with The Geochemist’s Workbench® PCO2 = 0.01 atm., [Ca] = 10 (mg/L). | 1 |
| 14:47, 27 October 2016 | Walsh-2006-EnergeticResiduesDeposition.PDF (file) | 1.47 MB | Astenger | 1 | ||
| 12:52, 27 October 2016 | Morgan-1988-Ninety-day Subchronic.pdf (file) | 6.11 MB | Astenger | 1 | ||
| 15:03, 26 October 2016 | Palaia-Article 1-Fraction 1.2.PNG (file) |  |
567 bytes | Debra Tabron | 1 | |
| 15:02, 26 October 2016 | Palaia-Article 1-Fraction 1.1.PNG (file) |  |
696 bytes | Debra Tabron | 1 | |
| 14:47, 26 October 2016 | Puls-1991-Facilitated Transport.pdf (file) | 1.02 MB | Astenger | 1 | ||
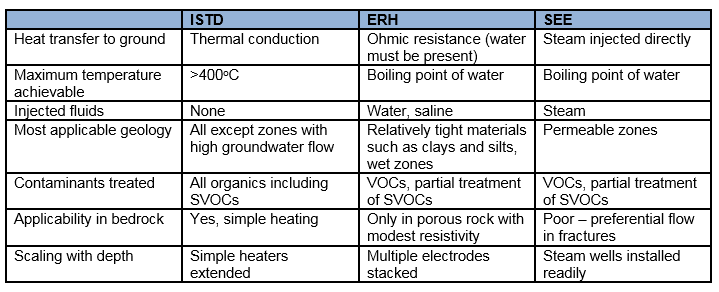
| 13:09, 26 October 2016 | Heron-Article 1. Table 1.PNG (file) |  |
29 KB | Debra Tabron | Table 1. Characteristics of the three main thermal technologies. | 1 |
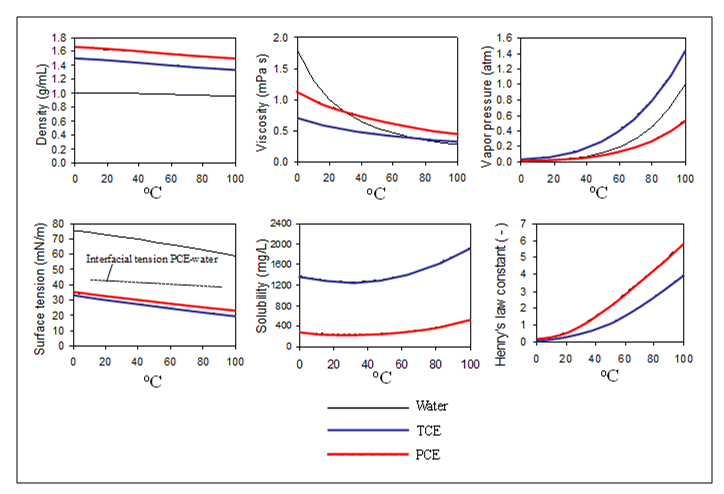
| 13:04, 26 October 2016 | Heron-Article 1. Figure 3.PNG (file) |  |
66 KB | Debra Tabron | Figure 3. Properties of PCE, TCE and water as a function of temperature. Changes in PCE and TCE properties with increased temperature facilitate contaminant recovery as a vapor. | 1 |
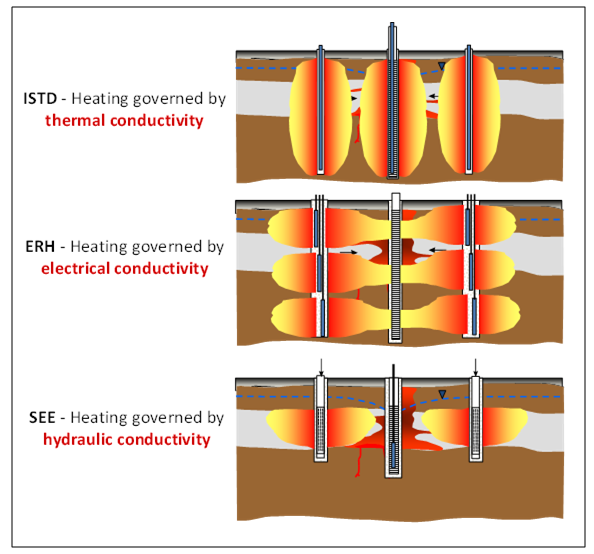
| 13:03, 26 October 2016 | Heron-Article 1. Figure 2.PNG (file) |  |
108 KB | Debra Tabron | Figure 2. The Three Most Commonly Used In Situ Thermal Technologies. (See text for abbreviation definitions) | 1 |
| 13:02, 26 October 2016 | Heron-Article 1. Figure 1.PNG (file) |  |
65 KB | Debra Tabron | Figure 1. Candidate Site for ISTR Application with Significant NAPL Source Material | 1 |
| 14:44, 25 October 2016 | Palaia-Article 1-Equation 2.PNG (file) | 2 KB | Debra Tabron | 1 | ||
| 14:43, 25 October 2016 | Palaia-Article 1-Equation 1.PNG (file) | 2 KB | Debra Tabron | 1 | ||
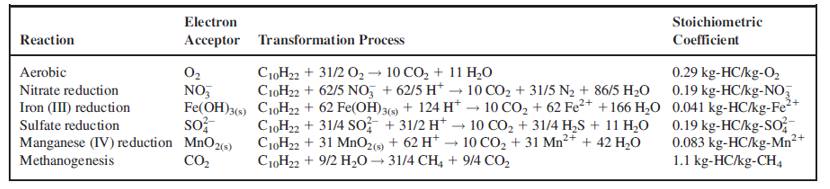
| 13:39, 25 October 2016 | Palaia-Article 1-Table 1.PNG (file) | 95 KB | Debra Tabron | Table 1. Terminal Electron Accepting Processes Associated with the Aqueous Expression of NSZD (for decane, excerpt from Johnson et al., 2006) | 1 | |
| 13:37, 25 October 2016 | Palaia-Article 1-Figure 5.PNG (file) |  |
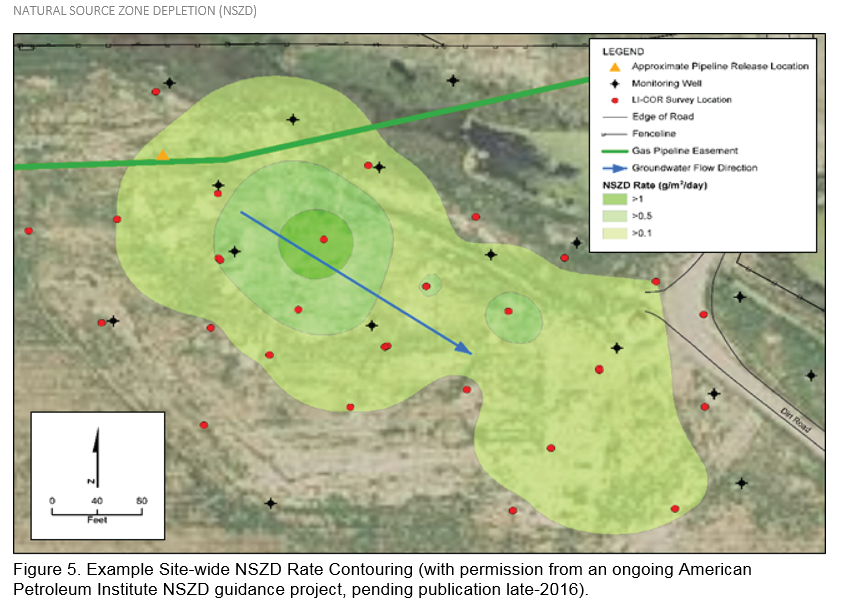
863 KB | Debra Tabron | Figure 5. Example Site-wide NSZD Rate Contouring (with permission from an ongoing American Petroleum Institute NSZD guidance project, pending publication late-2016). | 1 |
| 13:33, 25 October 2016 | Palaia-Article 1-Figure 4.PNG (file) |  |
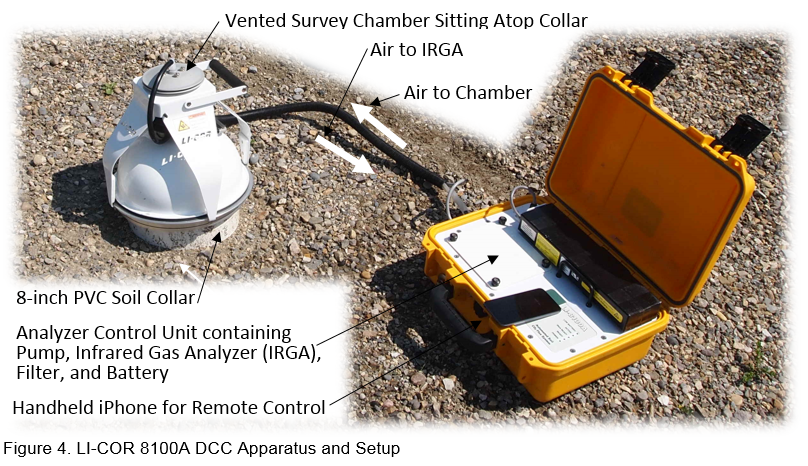
732 KB | Debra Tabron | Figure 4. LI-COR 8100A DCC Apparatus and Setup | 1 |
| 13:32, 25 October 2016 | Palaia-Article 1-Figure 3.PNG (file) |  |
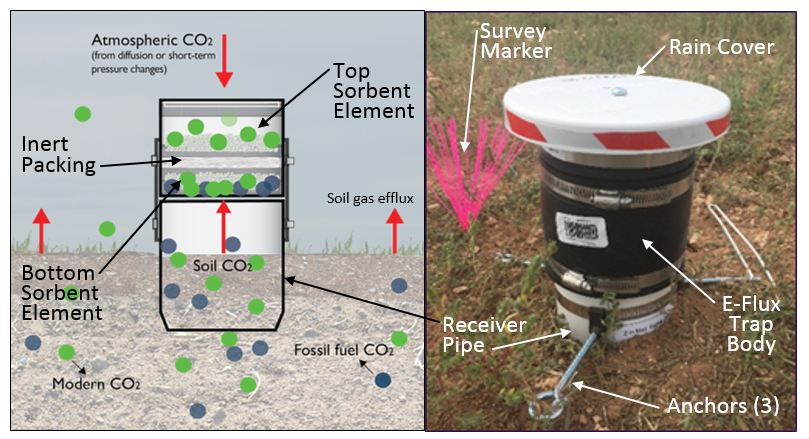
753 KB | Debra Tabron | Figure 3. Schematic (left) and Photo (right) of a Passive CO2 Flux Trap (Used with permission from E-Flux, LLC | 1 |
| 13:29, 25 October 2016 | Palaia-Article 1-Figure 2.PNG (file) |  |
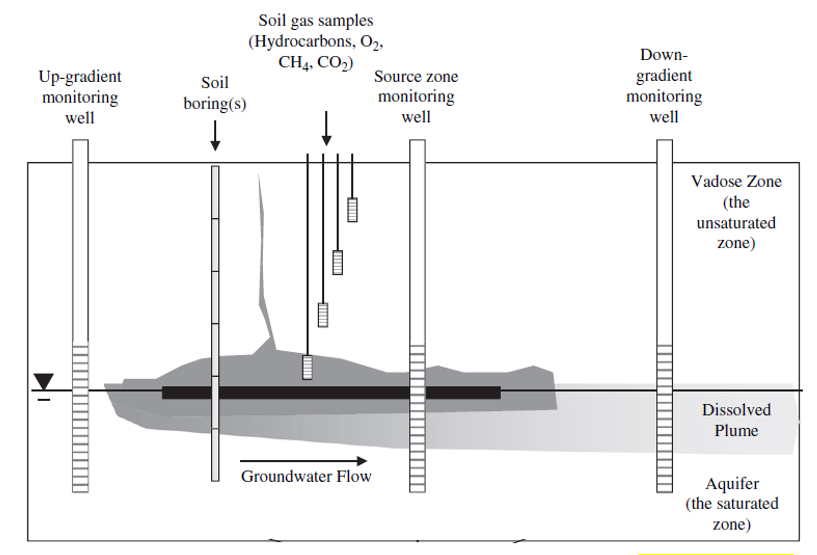
117 KB | Debra Tabron | Figure 2. Schematic of a Typical Gradient Method Monitoring Setup (excerpt from Johnson et al., 2006). | 1 |
| 13:28, 25 October 2016 | Palaia-Article 1-Figure 1.PNG (file) |  |
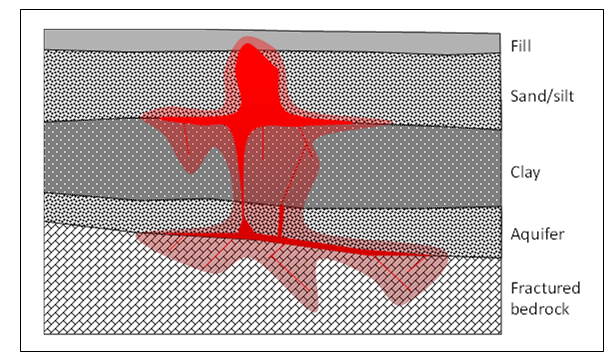
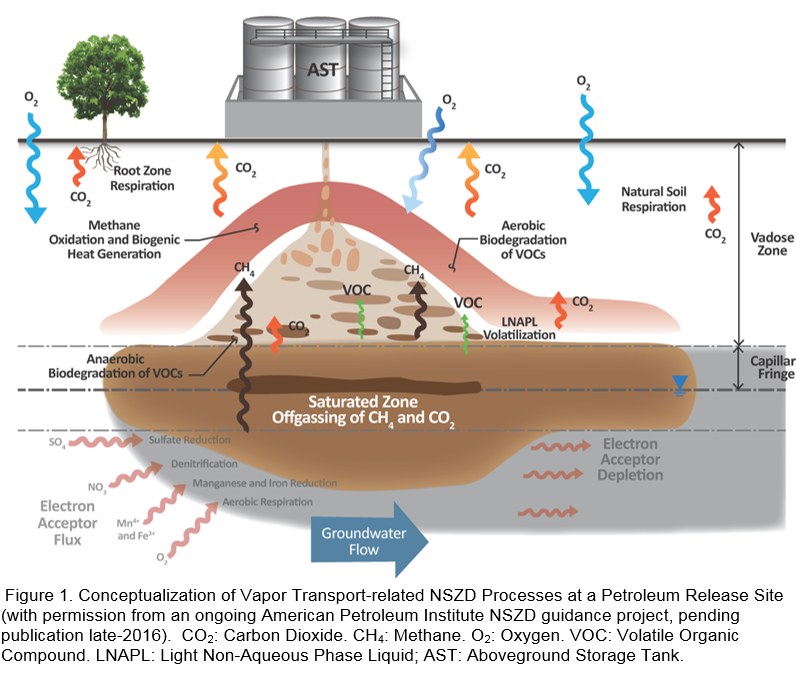
250 KB | Debra Tabron | Figure 1. Conceptualization of Vapor Transport-related NSZD Processes at a Petroleum Release Site (with permission from an ongoing American Petroleum Institute NSZD guidance project, pending publication late-2016). CO2: Carbon Dioxide. CH4: Methane. O... | 1 |
| 14:37, 21 October 2016 | Taylor-Article 1-T1.PNG (file) |  |
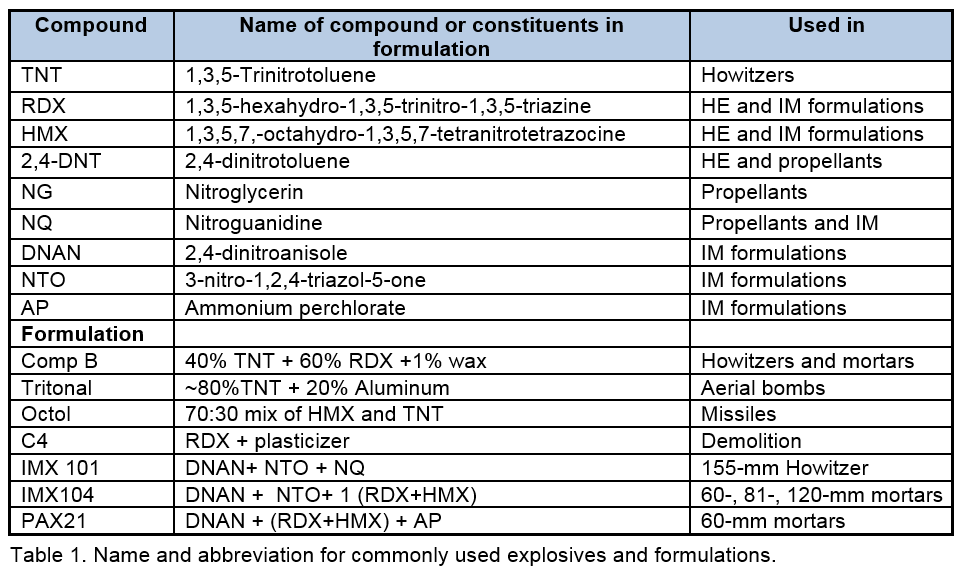
69 KB | Debra Tabron | Name and abbreviation for commonly used explosives and formulations | 1 |
| 13:48, 18 October 2016 | Rochette-2005-Soil Respiration.pdf (file) | 832 KB | Astenger | 1 | ||
| 12:26, 18 October 2016 | Modeling MTBE transport in vadose zone.pdf (file) | 191 KB | Dbeall | Simulation of Transport of Methyl Tert-Butyl Ether (MTBE) to Groundwater From Small-Volume Releases of Gasoline in the Vadose Zone | 1 | |
| 12:22, 18 October 2016 | MNA Indicators.pdf (file) | 297 KB | Dbeall | Evaluation of Sampling and Analytical Methods for Measuring Indicators of Intrinsic Bioremediation | 1 | |
| 12:19, 18 October 2016 | Mineral MNA Protocol.pdf (file) | 330 KB | Dbeall | Aqueous and Mineral Intrinsic Bioremediation Assessment | 1 | |
| 11:31, 18 October 2016 | Mineral MNA Protocol Development.pdf (file) | 511 KB | Dbeall | Aqueous and Mineral Intrinsic Bioremediation Assessment (AMIBA): Example and Planned Development | 1 | |
| 11:15, 18 October 2016 | Managing Risk.pdf (file) | 313 KB | Dbeall | Answers to Frequently Asked Questions About Managing Risk at LNAPL Sites | 1 | |
| 11:07, 18 October 2016 | Low K Remediation.pdf (file) | 79 KB | Dbeall | Summary of Processes, Human Exposures and Technologies Applicable to Low Permeability Soils | 1 | |
| 10:56, 18 October 2016 | J and E Vapor Instrusion Model.pdf (file) | 1.03 MB | Dbeall | Identification of Critical Parameters for the Johnson and Ettinger (1991) Vapor Intrusion Model | 1 | |
| 10:48, 18 October 2016 | Ethhanol.pdf (file) | 258 KB | Dbeall | Answers to Frequently Asked Questions About Ethanol Impacts to Groundwater | 1 | |
| 10:42, 18 October 2016 | Estimating Infiltration Rates.pdf (file) | 116 KB | Dbeall | Estimation of Infiltration and Recharge for Environmental Site Assessment | 1 | |
| 10:35, 18 October 2016 | EPA PHA PFOS PFOA.pdf (file) | 226 KB | Dbeall | Provisional Health Advisories for Perfluorooctanoic Acid (PFOA) and Perfluorooctane Sulfonate (PFOS) | 1 | |
| 10:28, 18 October 2016 | EPA OSWER 9200.4-17 MNA Directive.pdf (file) | 278 KB | Dbeall | Use of Monitored Natural Attenuation at Superfund, RCRA Corrective Action, and Underground Storage Tank Sites | 1 | |
| 10:26, 18 October 2016 | EPA MNA of Inorganics Vol.2.pdf (file) | 1.81 MB | Dbeall | Monitored Natural Attenuation of Inorganic Contaminants in Ground Water Vol. 2 | 1 | |
| 10:23, 18 October 2016 | EPA MNA of Inorganics Vol. 1.pdf (file) | 2.5 MB | Dbeall | Monitored Natural Attenuation of Inorganic Contaminants in Ground Water Vol. 1 | 1 | |
| 08:40, 18 October 2016 | EPA ISCO Issue Paper.pdf (file) | 2.56 MB | Dbeall | In-Situ Chemical Oxidation | 1 | |
| 08:36, 18 October 2016 | Epa bioremediation manual.pdf (file) | epa_bioremediation_manual.pdf | 2.41 MB | Dbeall | Engineered Approaches to In Situ Bioremediation of Chlorinated Solvents: Fundamentals and Field Applications | 1 |
| 08:27, 18 October 2016 | EPA 600-R-08-148 CSIA.pdf (file) | 3.46 MB | Dbeall | A Guide for Assessing Biodegradation and Source Identification of Organic Ground Water Contaminants using Compound Specific Isotope Analysis (CSIA) | 1 | |
| 08:23, 18 October 2016 | Effect on Groundwater.pdf (file) | 628 KB | Dbeall | Predicting the Effect of Hydrocarbon and Hydrocarbon-Impacted Soil on Groundwater | 1 | |
| 08:16, 18 October 2016 | Diving Plumes.pdf (file) | 2.61 MB | Dbeall | Downward Solute Plume Migration: Assessment, Significance, and Implications for Characterization and Monitoring of "Diving Plumes" | 1 | |
| 08:13, 18 October 2016 | CVOC Transformation - USEPA Groundwater Issue.pdf (file) | 964 KB | Dbeall | Ground Water Issue Paper: Synthesis Report on State of Understanding of Chlorinated Solvent Transformation | 1 | |
| 08:10, 18 October 2016 | Characterizing MTBE Releases.pdf (file) | 251 KB | Dbeall | Strategies for Characterizing Subsurface Releases of Gasoline Containing MTBE | 1 | |
| 08:06, 18 October 2016 | California LUFT Sites.pdf (file) | 725 KB | Dbeall | Remediation Progress at California LUFT Sites: Insights from the GeoTracker Database | 1 | |
| 14:13, 17 October 2016 | Taylor-A1-Figure 9.PNG (file) |  |
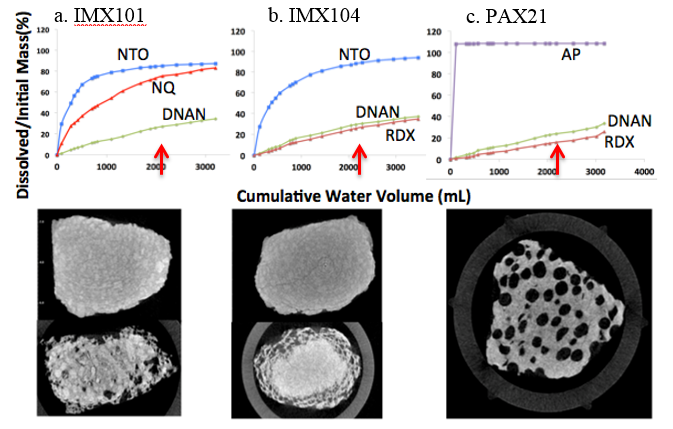
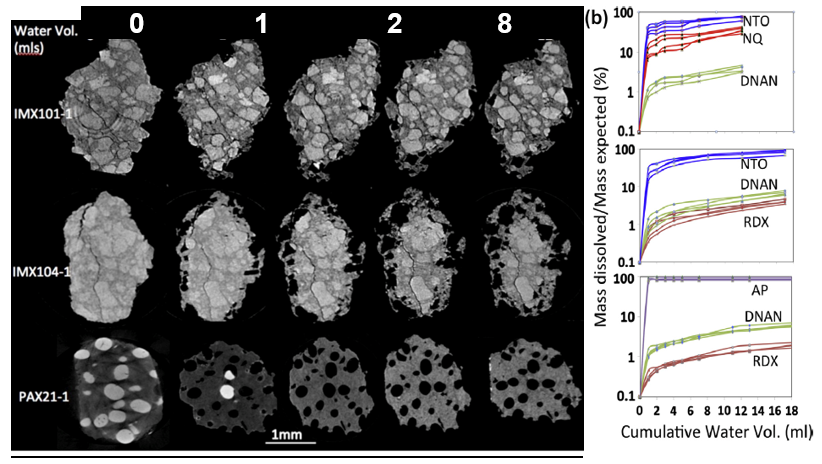
179 KB | Debra Tabron | Figure 9. Dissolved mass versus precipitation volume for averaged data from: (a) five IMX101; (b) five IMX104; and (c) two PAX21 chunks placed outside to weather and dissolve. The constituents are NTO (blue), NQ (red), DNAN (green), RDX (orange), and A... | 1 |
| 14:11, 17 October 2016 | Taylor-A1-Figure 8.PNG (file) |  |
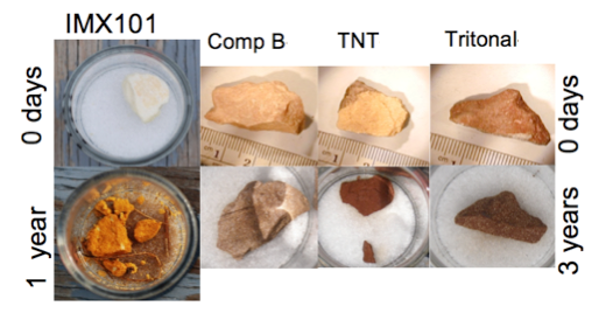
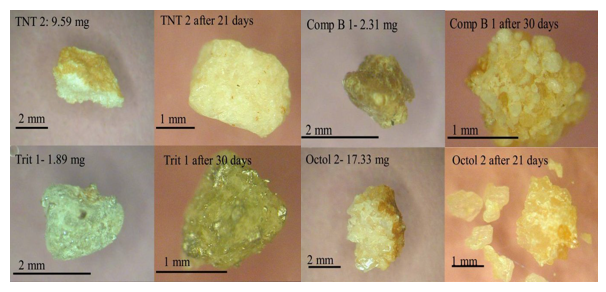
340 KB | Debra Tabron | Figure 8. IM formulations break apart more easily than do traditional explosives. | 1 |
| 14:09, 17 October 2016 | Taylor-A1-Figure 7.PNG (file) |  |
307 KB | Debra Tabron | 1 | |
| 14:08, 17 October 2016 | Taylor-A1-Figure 6.PNG (file) |  |
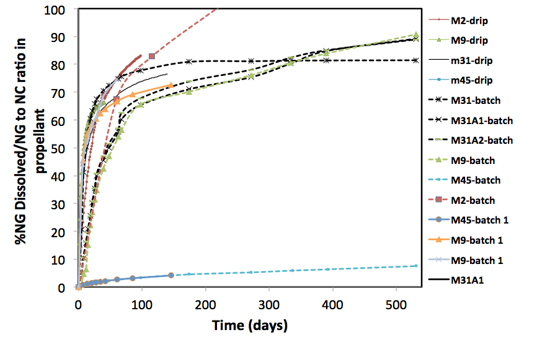
73 KB | Debra Tabron | Figure 6. Plot of the normalized % NG dissolved from unfired propellants versus time (Taylor et al. 2012). | 1 |
| 14:06, 17 October 2016 | Taylor-A1-Figure 5.PNG (file) |  |
289 KB | Debra Tabron | Figure 5. (a) µCT images of an IMX101, IMX104 and PAX21 particle during dissolution. (b) the mass loss curves for these and three other sets of particles (Taylor et al. 2015a). | 1 |
| 14:05, 17 October 2016 | Taylor-A1-Figure 4.PNG (file) |  |
425 KB | Debra Tabron | Figure 4. Optical microscope images of pieces of TNT, Tritonal, Comp B and Octol before and after having water dripped on their surfaces. | 1 |
| 14:02, 17 October 2016 | Taylor-A1-Figure 3.PNG (file) |  |
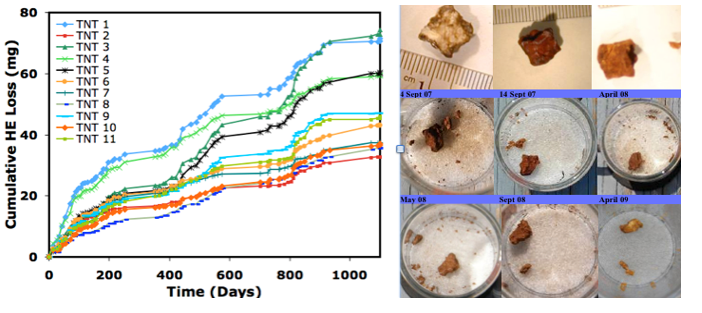
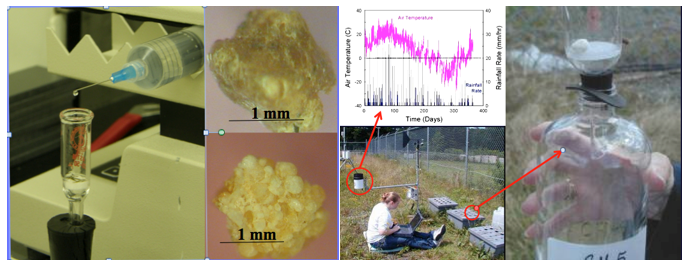
438 KB | Debra Tabron | Figure 3. Laboratory drip tests (left) and outdoor dissolution tests (right) (Taylor et al., 2010). | 1 |
| 14:01, 17 October 2016 | Taylor-A1-Figure 2.PNG (file) |  |
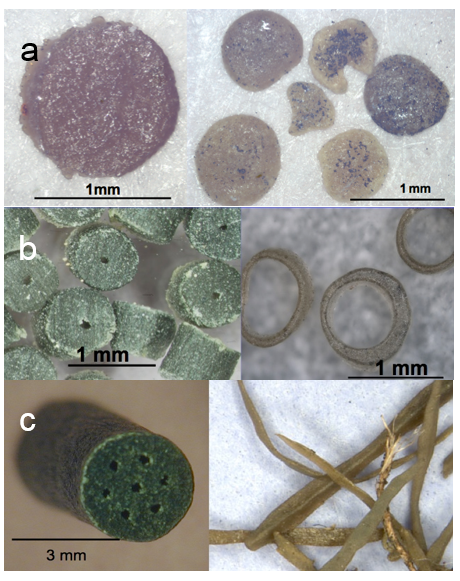
653 KB | Debra Tabron | Figure 2. (a) M9 grain and residues; (b) single perforated M45 propellant grains and residues; (c) multi-perforated M1 propellant and residues from Taylor et al. (2012) | 1 |