File list
This special page shows all uploaded files.
| Date | Name | Thumbnail | Size | User | Description | Versions |
|---|---|---|---|---|---|---|
| 16:27, 24 January 2017 | USEPA-1994-How to evalutate alternative cleanup tech for UST Sites.pdf (file) | 1.8 MB | Debra Tabron | United States Environmental Protection Agency, 1994. How to evaluate alternative cleanup technologies for underground storage tank sites | 1 | |
| 12:14, 24 January 2017 | ATSDR-1999-Tox profile for TPH.pdf (file) | 8.31 MB | Debra Tabron | Agency for Toxic Substances and Disease Registry, 1999. Toxicological profile for total petroleum hydrocarbons (TPH). Accessed December 1, 2016 from | 1 | |
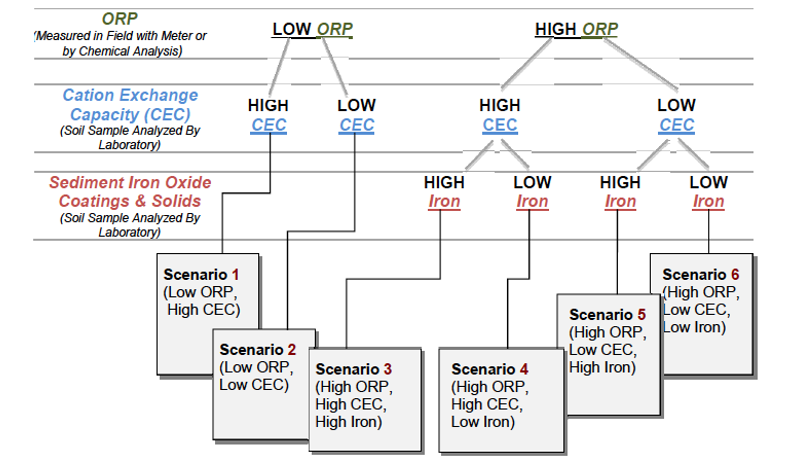
| 12:22, 23 January 2017 | Denham-Article 3-Table 2.PNG (file) |  |
136 KB | Debra Tabron | Table 2. Six Scenarios for Evaluating Inorganic Monitored Natural Attenuation | 1 |
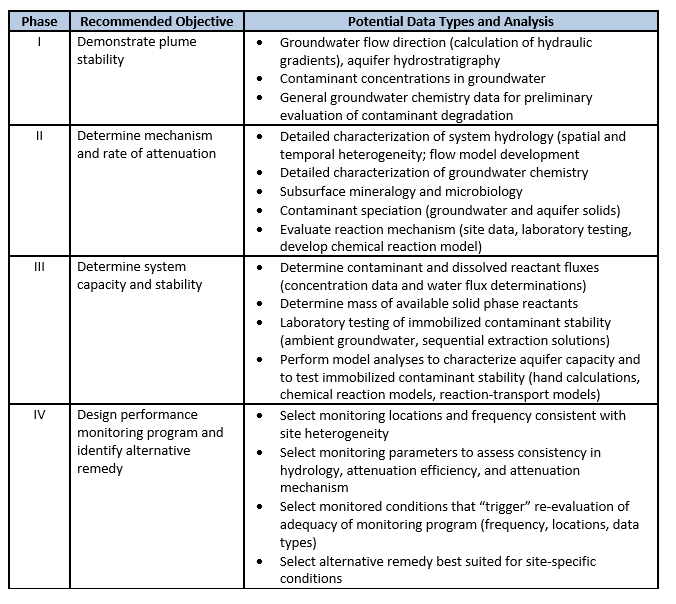
| 12:20, 23 January 2017 | Denham-Article 3-Table 1.PNG (file) |  |
55 KB | Debra Tabron | Table 1. Tiered four-phase approach to demonstrating MNA for inorganic compounds | 1 |
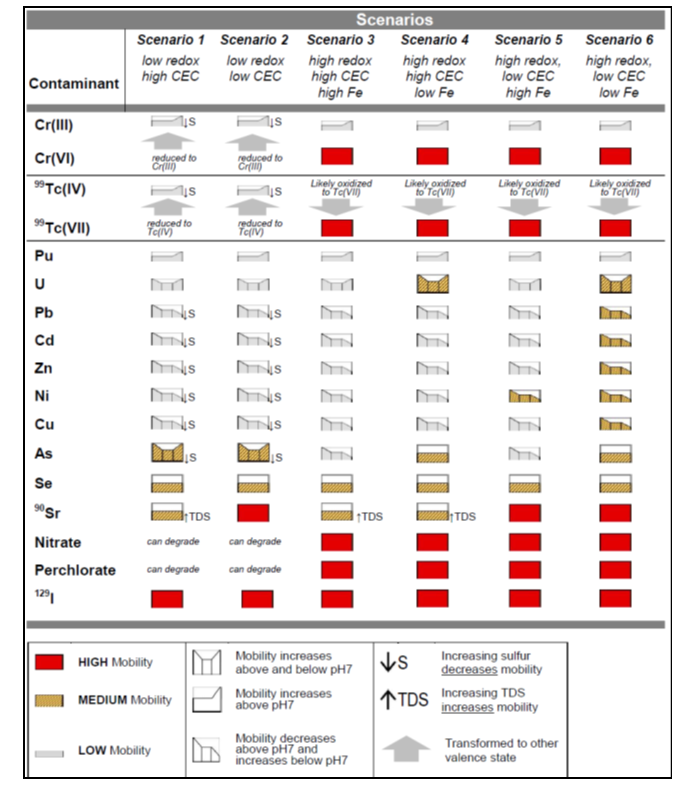
| 12:19, 23 January 2017 | Denham-Article 3-Figure 2.PNG (file) |  |
228 KB | Debra Tabron | Figure 2. Summary of inorganic contaminant mobility for 4 < pH < 9 for six scenarios | 1 |
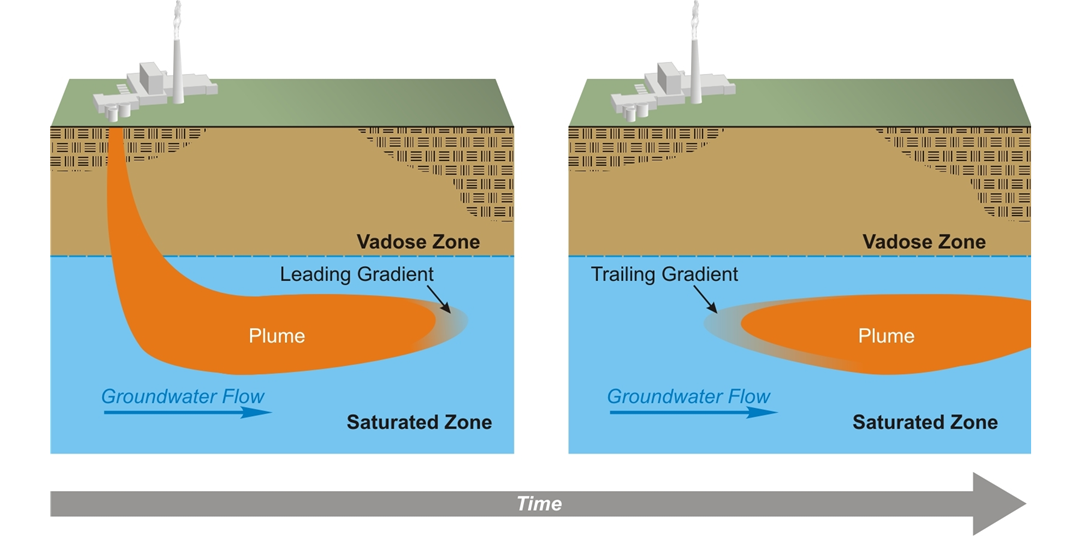
| 12:18, 23 January 2017 | Denham-Article 3-Figure 1.PNG (file) |  |
230 KB | Debra Tabron | Figure 1. Typical contaminant plume evolution in an aquifer showing leading and trailing gradients. | 1 |
| 12:16, 19 January 2017 | Freedman A 1 Fig 4.PNG (file) |  |
5 KB | Debra Tabron | 1 | |
| 11:36, 19 January 2017 | Freedman A 1 Fig 3.PNG (file) |  |
5 KB | Debra Tabron | 1 | |
| 10:45, 19 January 2017 | Freedman Article 1 Figure 6.PNG (file) |  |
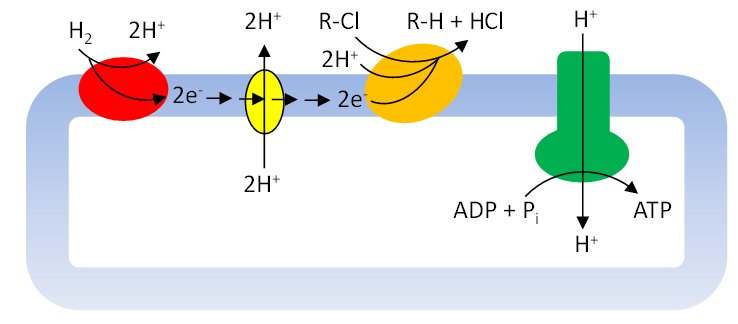
21 KB | Debra Tabron | Figure 6. Schematic representation of a microbial cell carrying out organohalide respiration. Blue shape = the cell membrane; red oval = hydrogenase; yellow oval = electron carrier and proton translocation; orange oval = reductive dehalogenase; green s... | 1 |
| 10:42, 19 January 2017 | Freedman Article 1 Figure 5.PNG (file) |  |
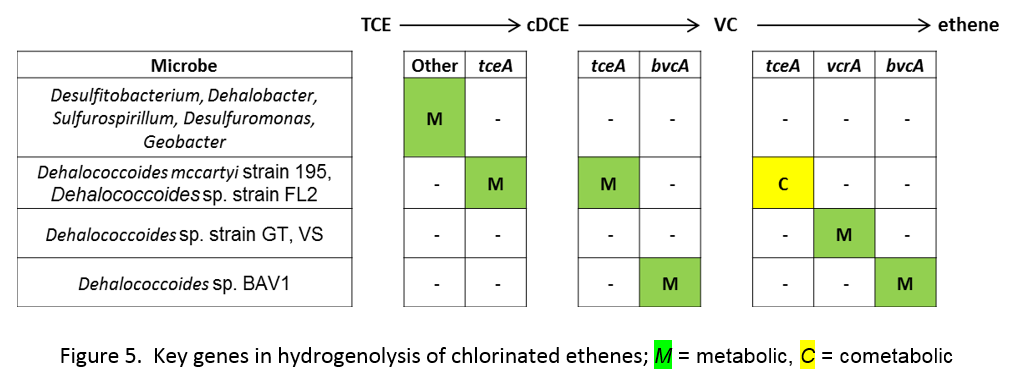
60 KB | Debra Tabron | Figure 5. Key genes in hydrogenolysis of chlorinated ethenes; M = metabolic, C = cometabolic | 1 |
| 10:39, 19 January 2017 | Freedman Article 1 Figure 4.PNG (file) |  |
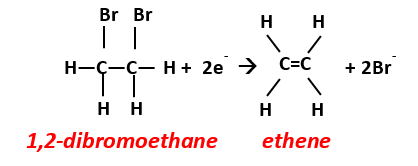
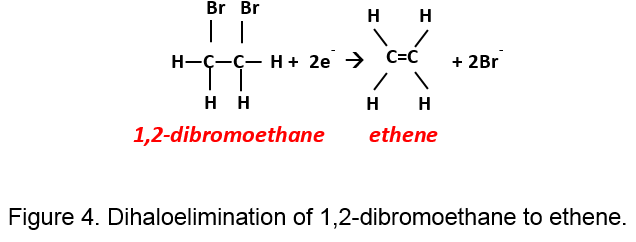
10 KB | Debra Tabron | Figure 4. Dihaloelimination of 1,2-dibromoethane to ethene. | 1 |
| 10:10, 19 January 2017 | Freedman Article 1 Figure 2.PNG (file) |  |
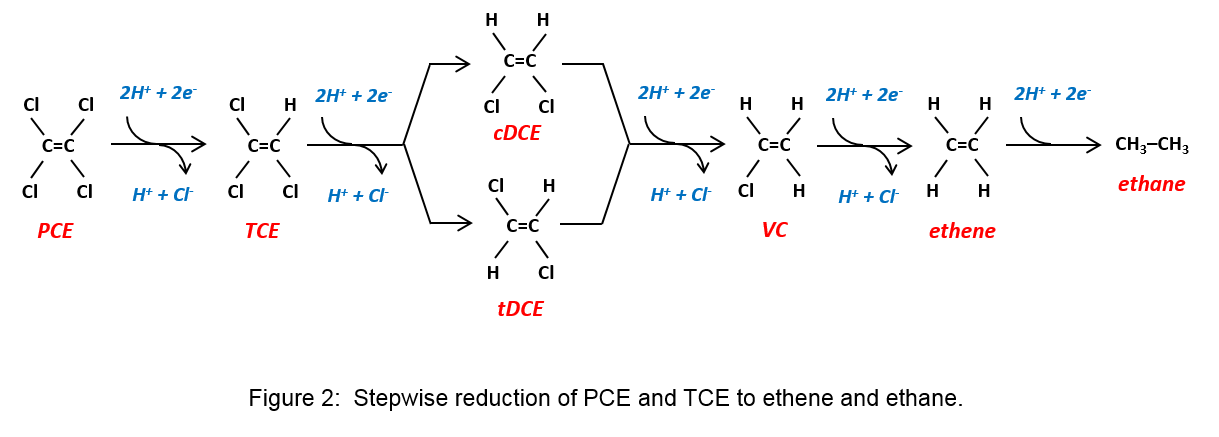
27 KB | Debra Tabron | Figure 2. Stepwise reduction of PCE and TCE to ethene and ethane | 1 |
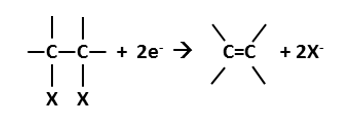
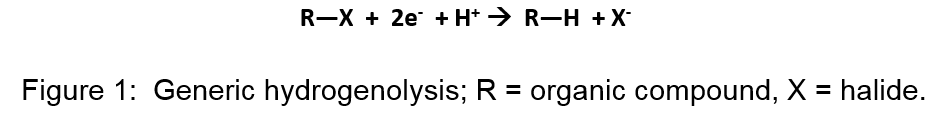
| 10:07, 19 January 2017 | Freedman Article 1 Figure 1.PNG (file) | 8 KB | Debra Tabron | Figure 1. Generic hydrogenolysis; R = organic compound, X = halide. | 1 | |
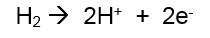
| 10:04, 19 January 2017 | Freedman Article 1 Equation 1.PNG (file) | 962 bytes | Debra Tabron | 1 | ||
| 15:17, 17 January 2017 | Heron Combined Therm Fig3.jpg (file) |  |
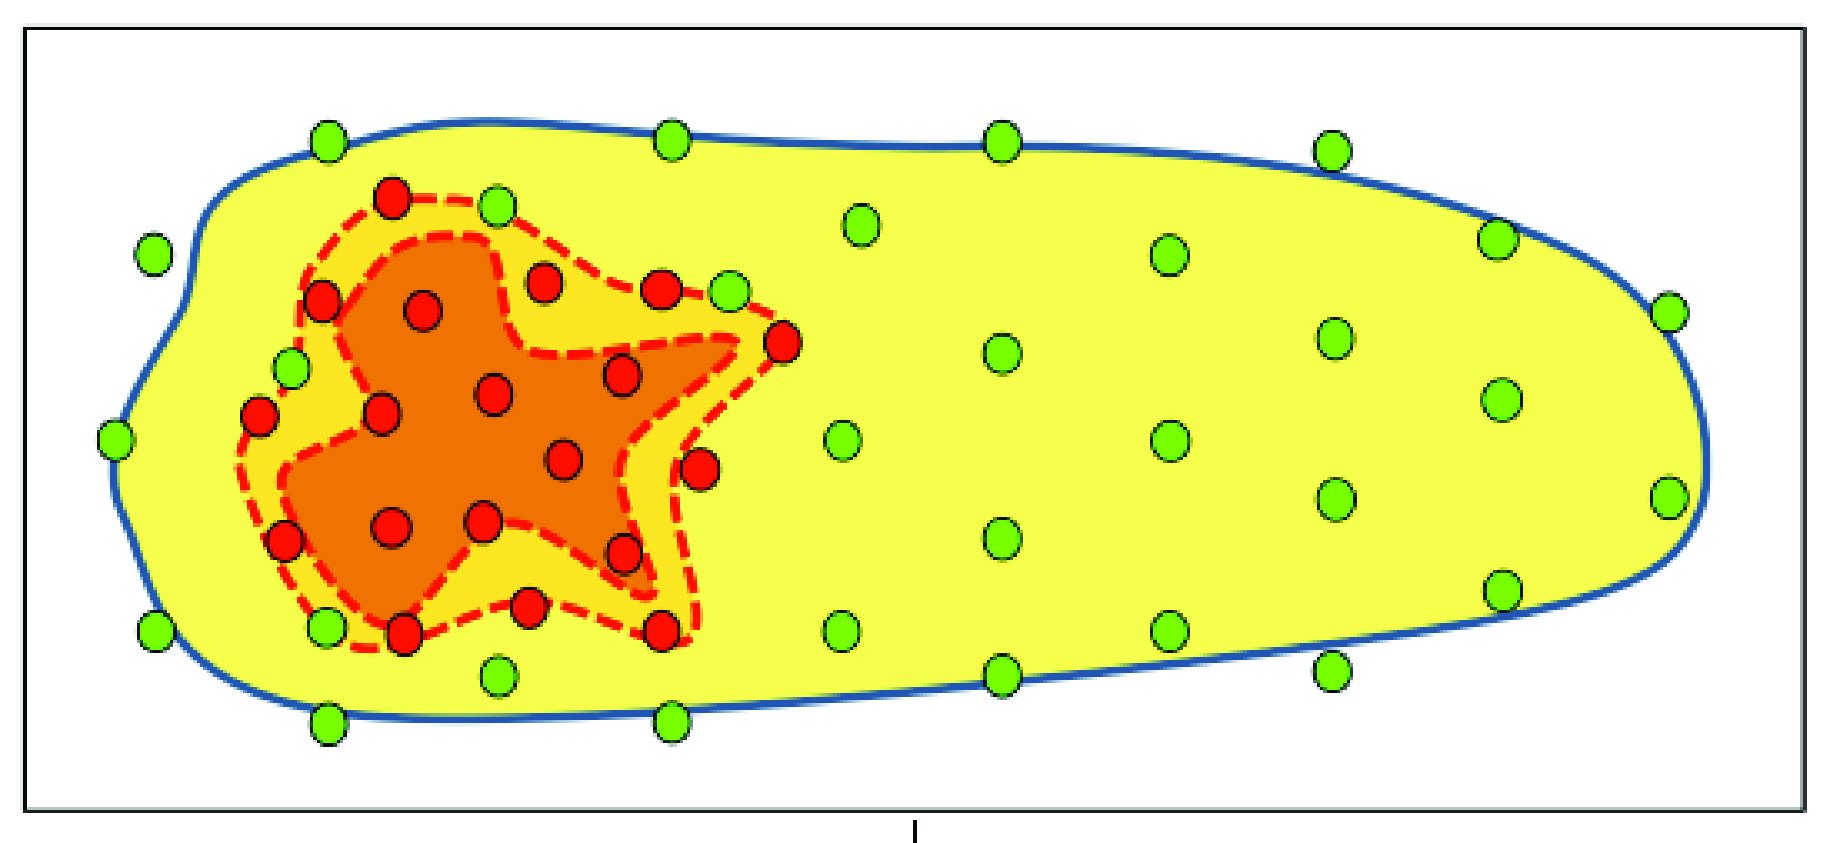
1.03 MB | Debra Tabron | Figure 3. Example combined remedy: Thermal treatment of the source zone combined with bioremediation for treating the transition zone and dissolved plume. Red dots = heaters, green dots = bioremediation injection or extraction wells. | 1 |
| 15:16, 17 January 2017 | Heron Combined Therm Fig2.jpg (file) |  |
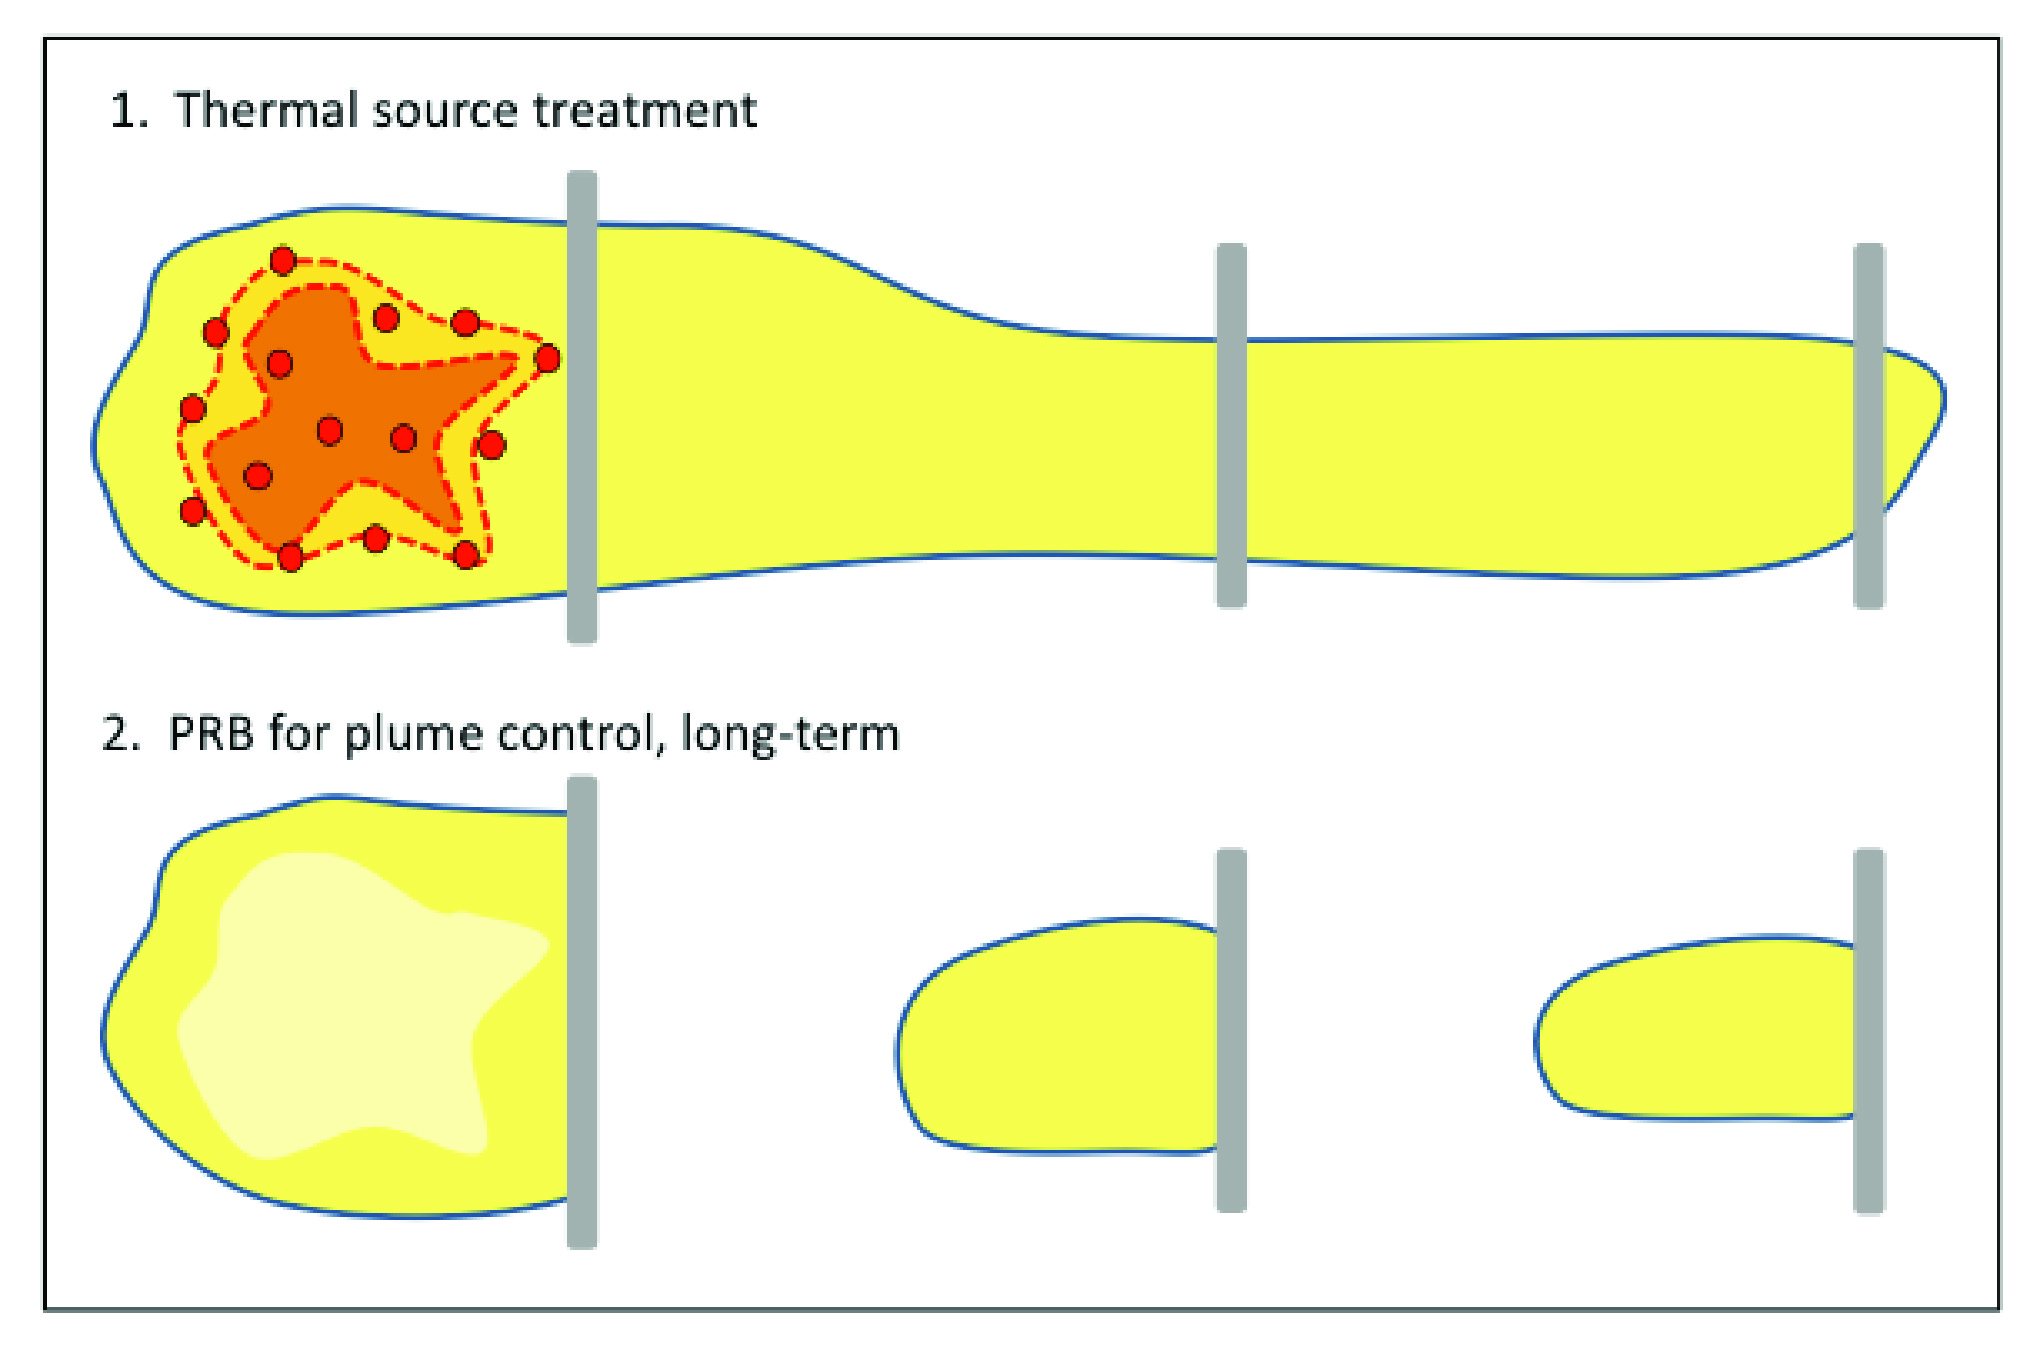
1.14 MB | Debra Tabron | Figure 2. Example combined remedy. Thermal treatment of the source zone combined with permeable reactive barriers for treating a long dissolved plume. Thermal source treatment is implemented in the first year, followed by plume treatment in a period af... | 1 |
| 15:15, 17 January 2017 | Heron Combined therm Table 1.PNG (file) |  |
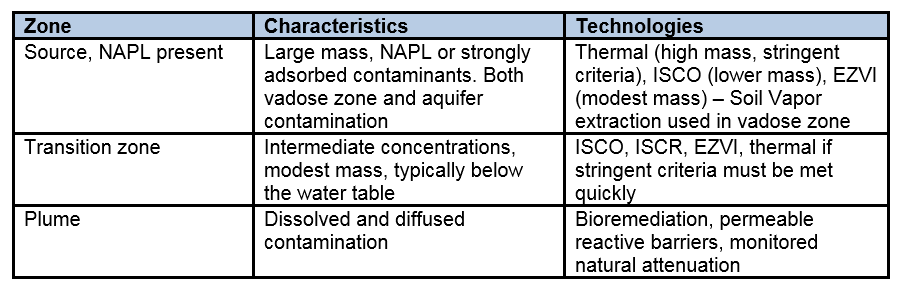
33 KB | Debra Tabron | Table 1. Technologies applied in the different zones of a complex contaminated site. | 1 |
| 15:14, 17 January 2017 | Heron Combined therm Fig1.PNG (file) |  |
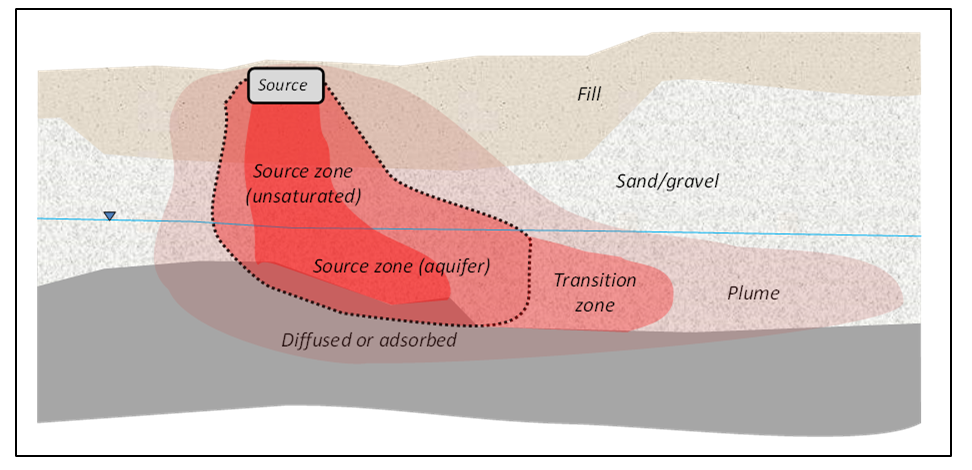
375 KB | Debra Tabron | Figure 1. Sketch of a complex site with multiple zones with different levels of contamination. | 1 |
| 13:39, 17 January 2017 | Heron ISTD Fig3.jpg (file) |  |
2.89 MB | Debra Tabron | Figure 3. ISTD well field for treatment of a 3.2-acre CVOC source zone. Electric power distribution equipment is seen in the foreground. An insulated vapor cover provides a vapor seal. | 1 |
| 13:38, 17 January 2017 | Heron ISTD Fig2.jpg (file) |  |
1.14 MB | Debra Tabron | Figure 2. Example use of ISTD to treat a PCE source zone above and below the groundwater table. | 1 |
| 13:36, 17 January 2017 | Heron ISTD Fig1.jpg (file) |  |
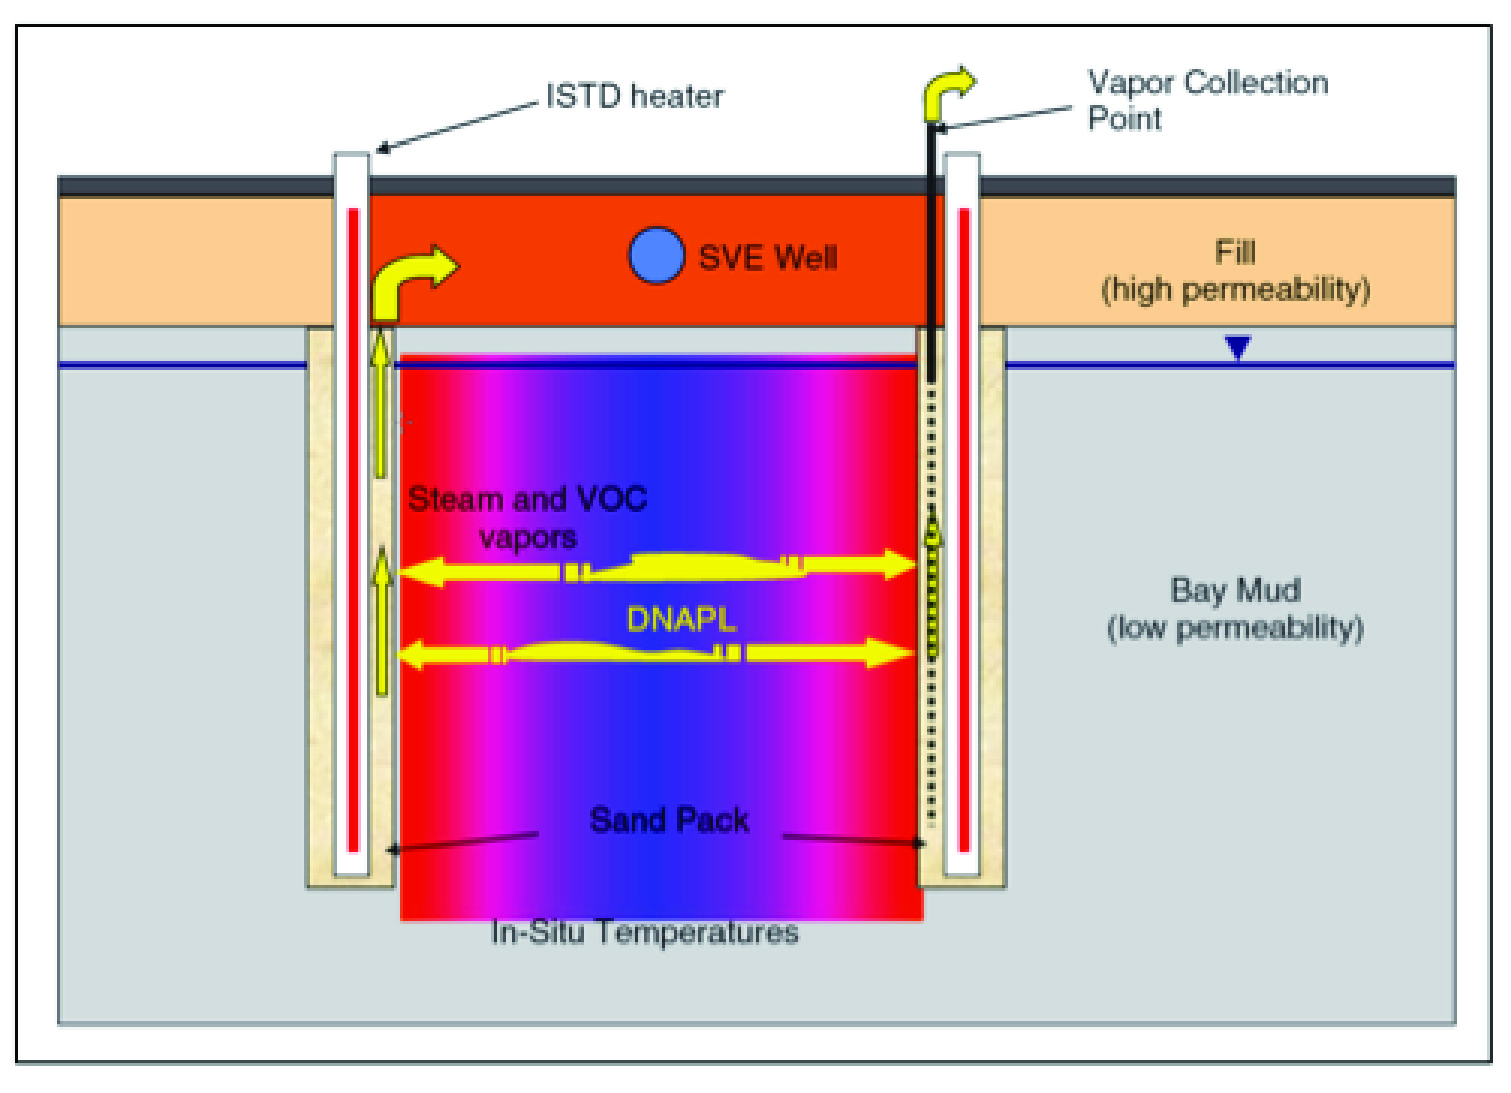
1.47 MB | Debra Tabron | Figure 1. In Situ Thermal Desorption (ISTD) schematic. | 1 |
| 15:07, 16 January 2017 | Heron EHR Fig1.jpg (file) |  |
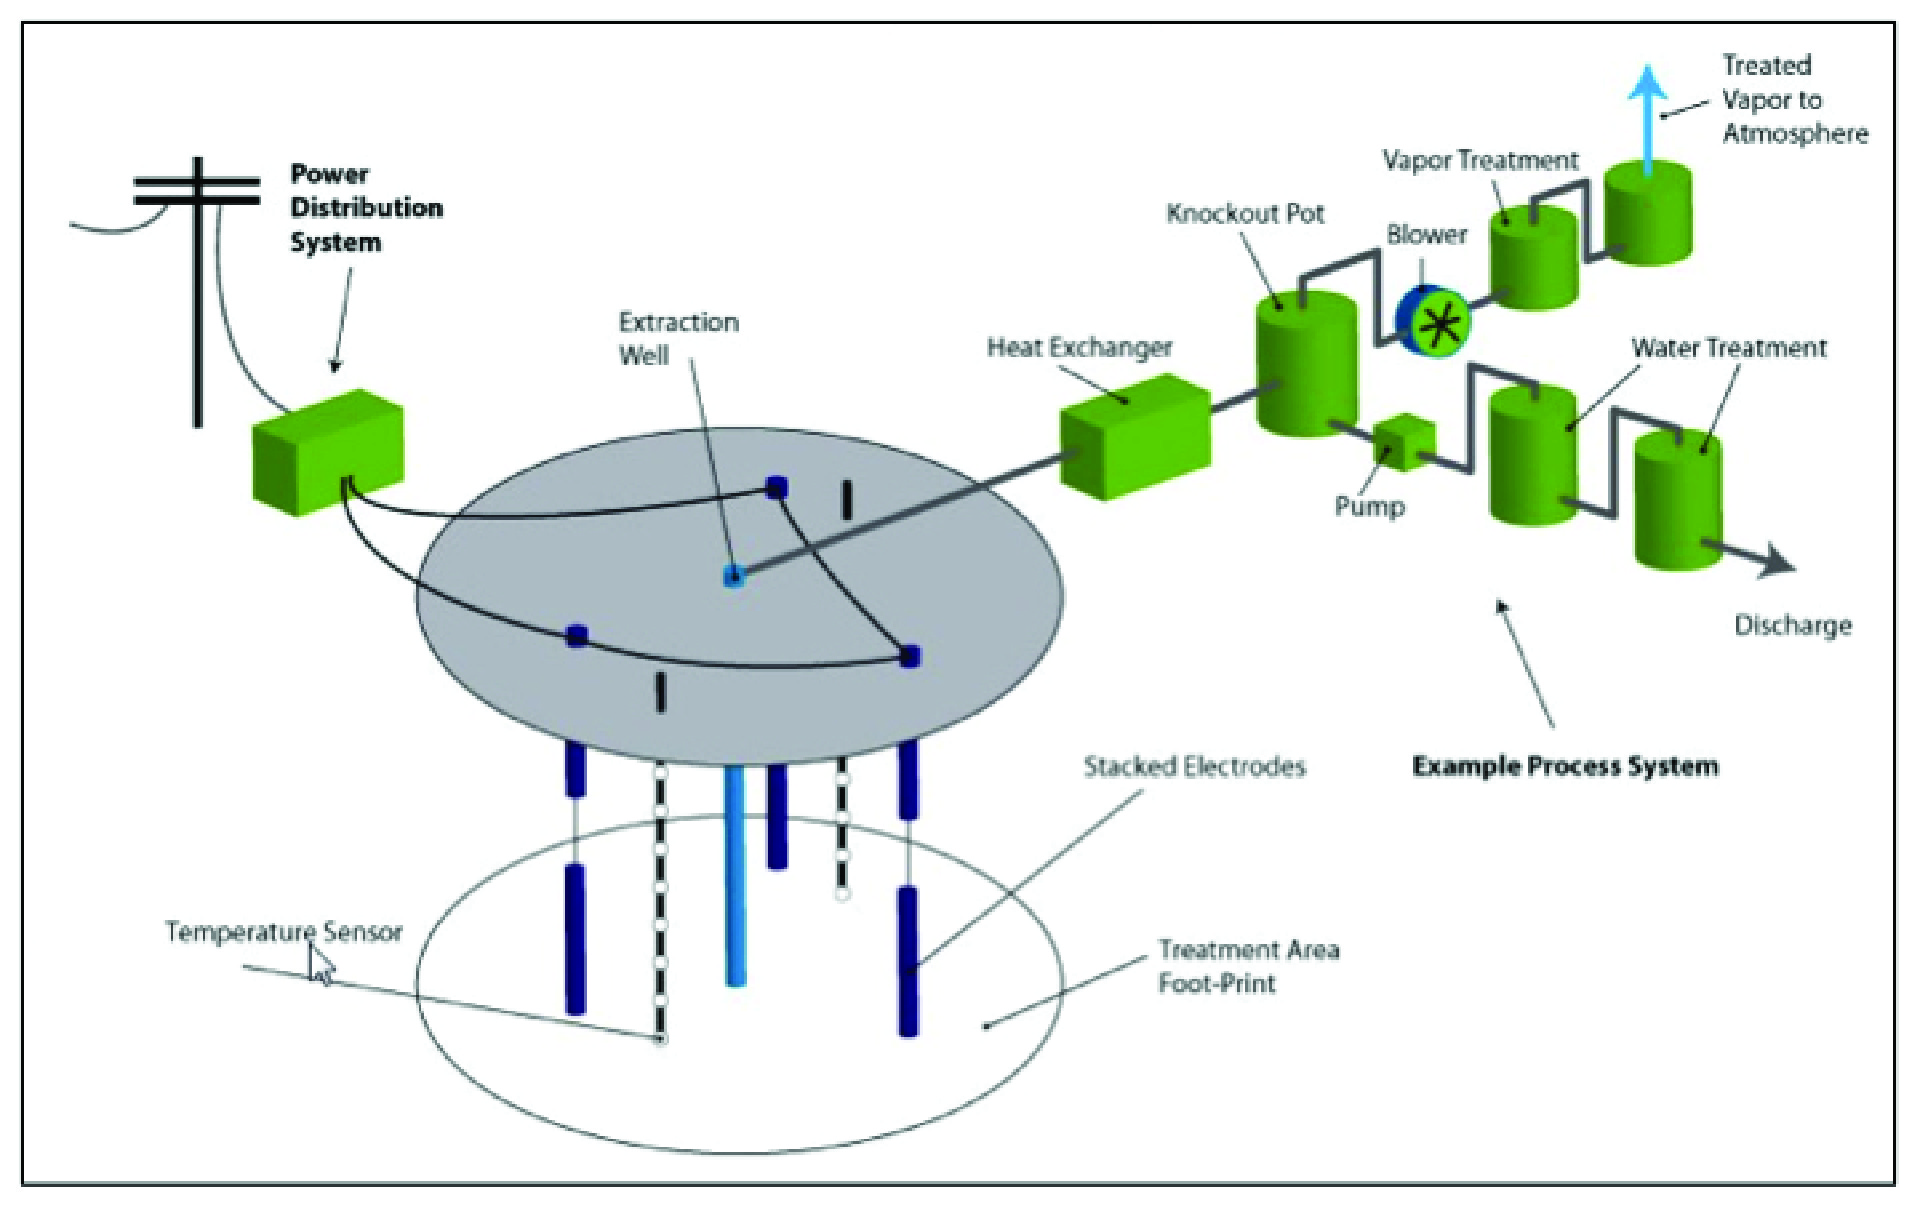
1.19 MB | Debra Tabron | Figure 1. Electrical Resistance Heating Schematic (courtesy of TerraTherm). | 1 |
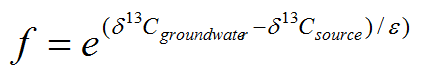
| 11:05, 13 January 2017 | Lollar-Article 1-Equation 2R.PNG (file) | 2 KB | Debra Tabron | Lollar-Equation 2-Revised | 1 | |
| 10:16, 13 January 2017 | Lollar-Article 1-Equation 2.PNG (file) | 3 KB | Debra Tabron | Lollar-Equation 2 | 1 | |
| 14:22, 11 January 2017 | Dontsova-Article 1-Figure 4.PNG (file) |  |
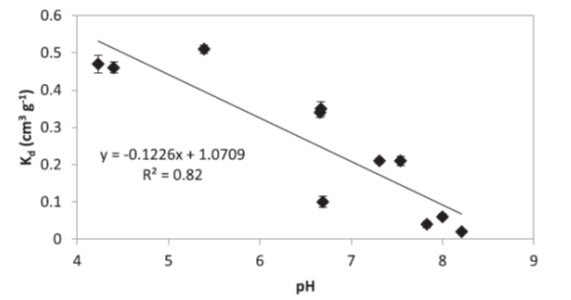
27 KB | Debra Tabron | Figure 4. Correlation between measured NTO adsorption coefficients | 1 |
| 14:21, 11 January 2017 | Dontsova-Article 1-Figure 3.PNG (file) |  |
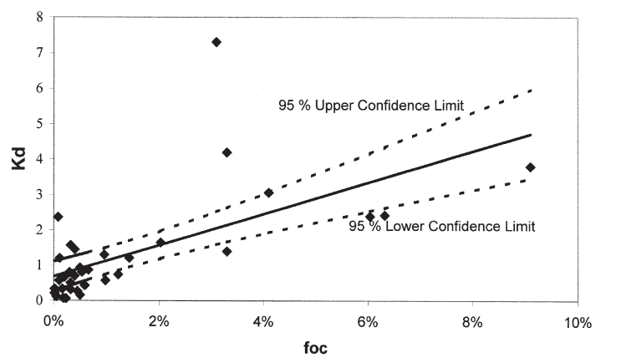
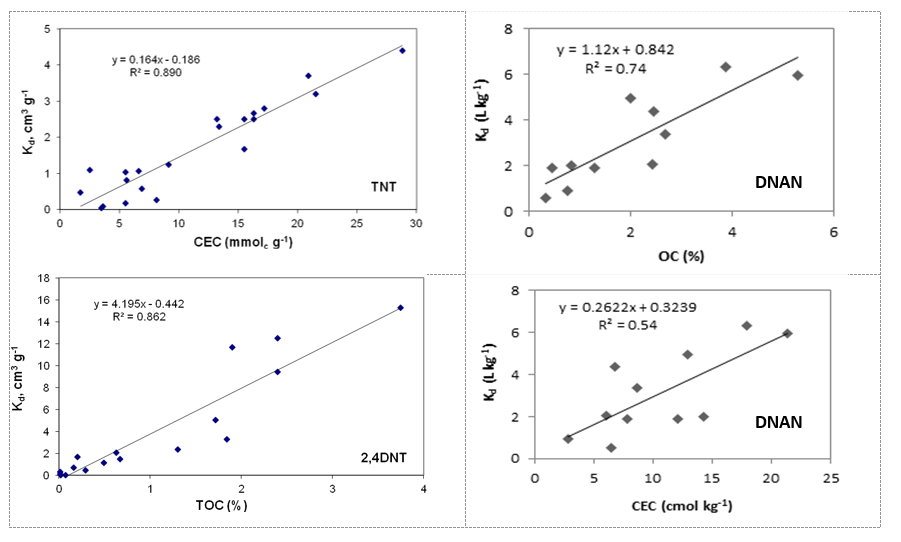
45 KB | Debra Tabron | Figure 3. Linear correlation between percent organic carbon in soil and adsorption coefficients... | 1 |
| 14:18, 11 January 2017 | Dontsova-Article 1-Figure 2.PNG (file) |  |
63 KB | Debra Tabron | Figure 2. Linear correlation bewtween measured TNT soil adsorption coefficients and cation exchange capacity (CEC) that accounts for clay and OM in the soil... | 1 |
| 14:15, 11 January 2017 | Dontsova-Article 1-Figure 1.PNG (file) |  |
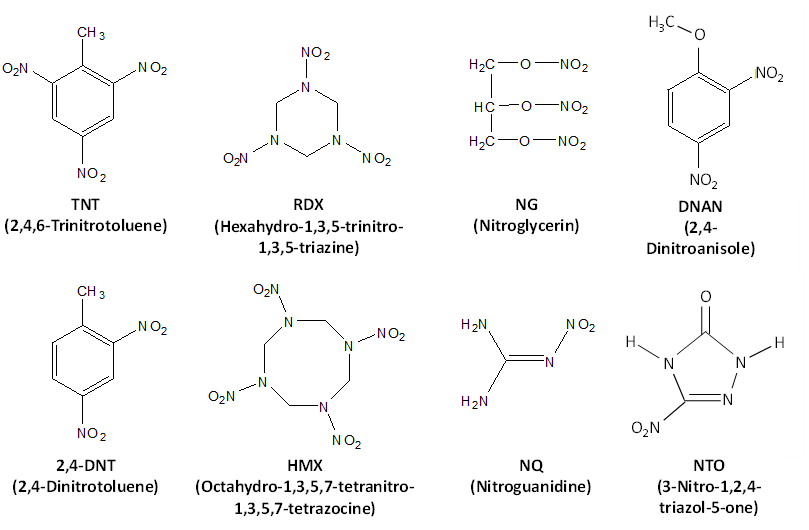
29 KB | Debra Tabron | Figure 1. Common energetic materials, modified from Taylor et al. (Taylor et al., 2015). | 1 |
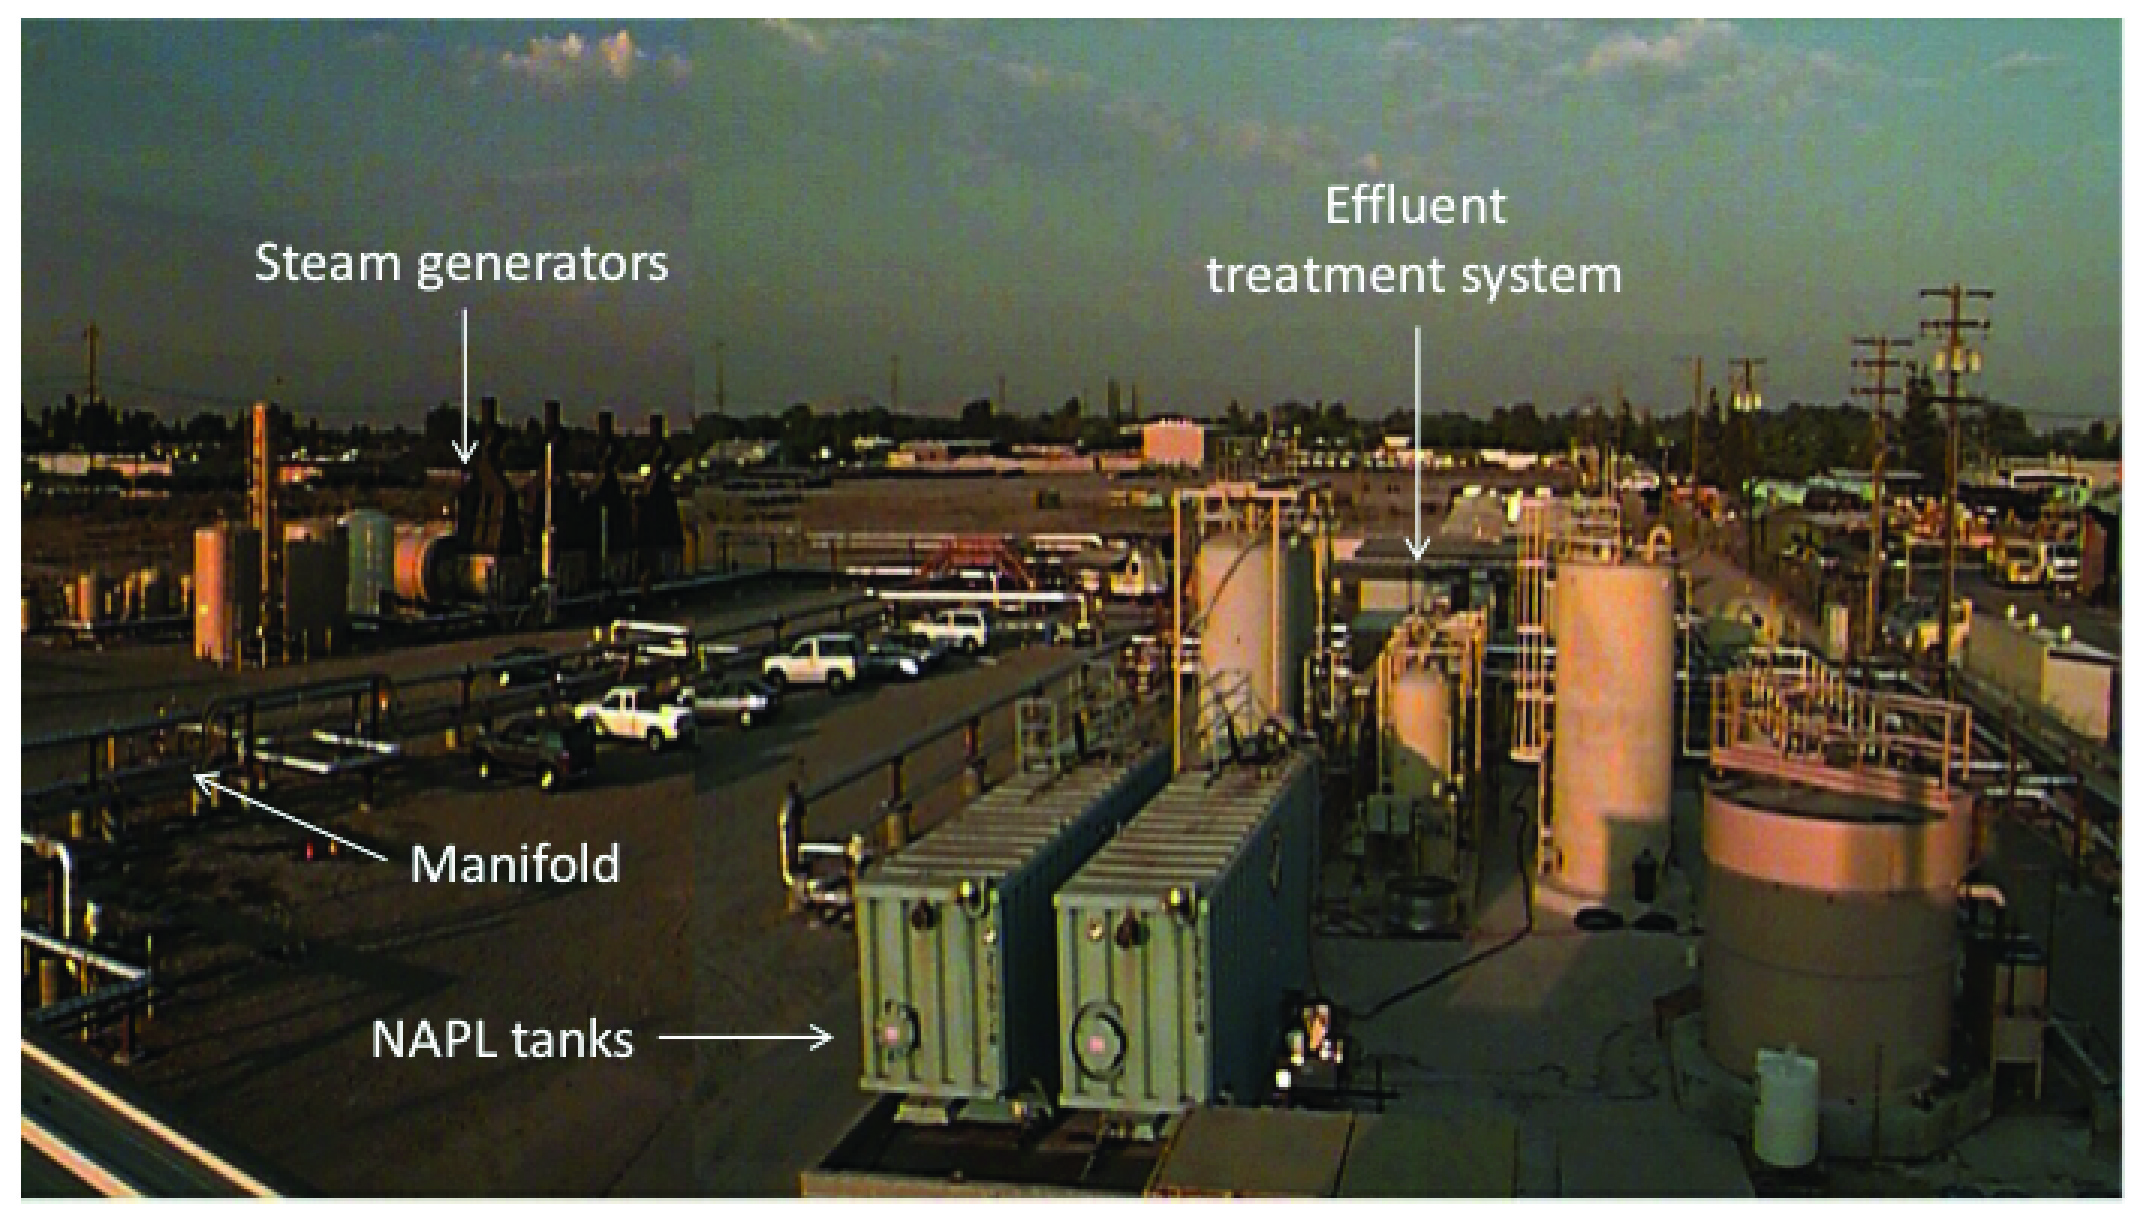
| 22:26, 10 January 2017 | Heron SEE Fig3.jpg (file) |  |
2.83 MB | Jbarnes | 1 | |
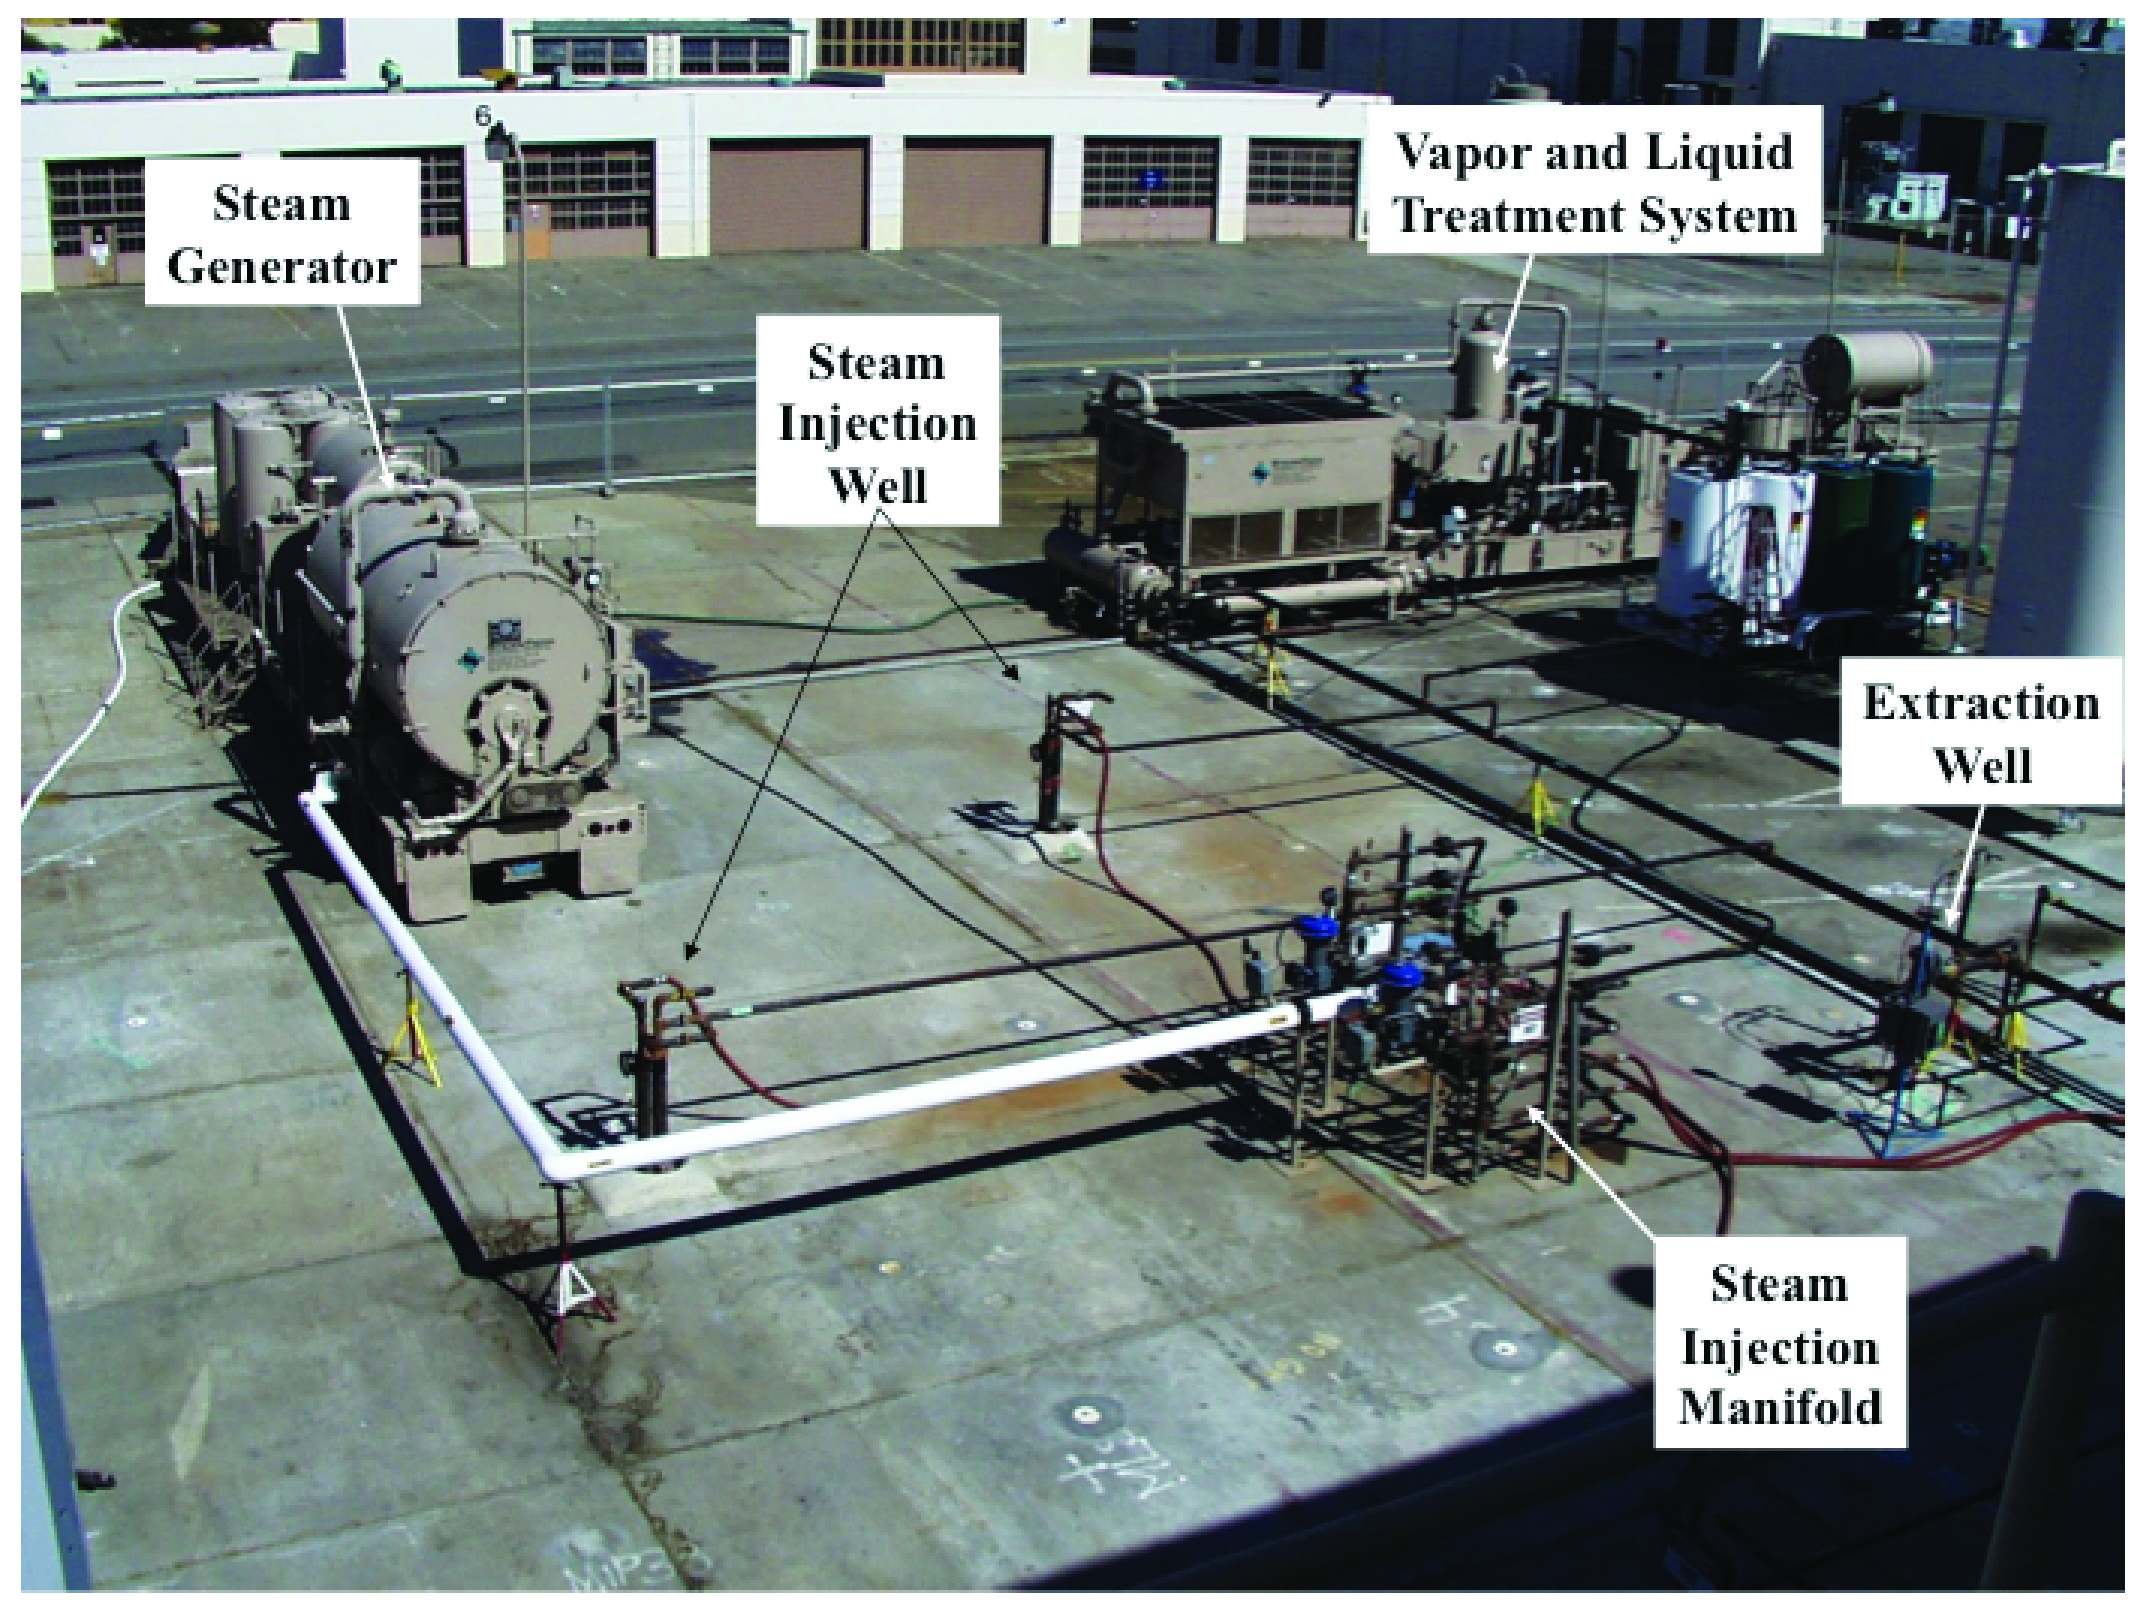
| 22:25, 10 January 2017 | Heron SEE Fig2.jpg (file) |  |
3.59 MB | Jbarnes | 1 | |
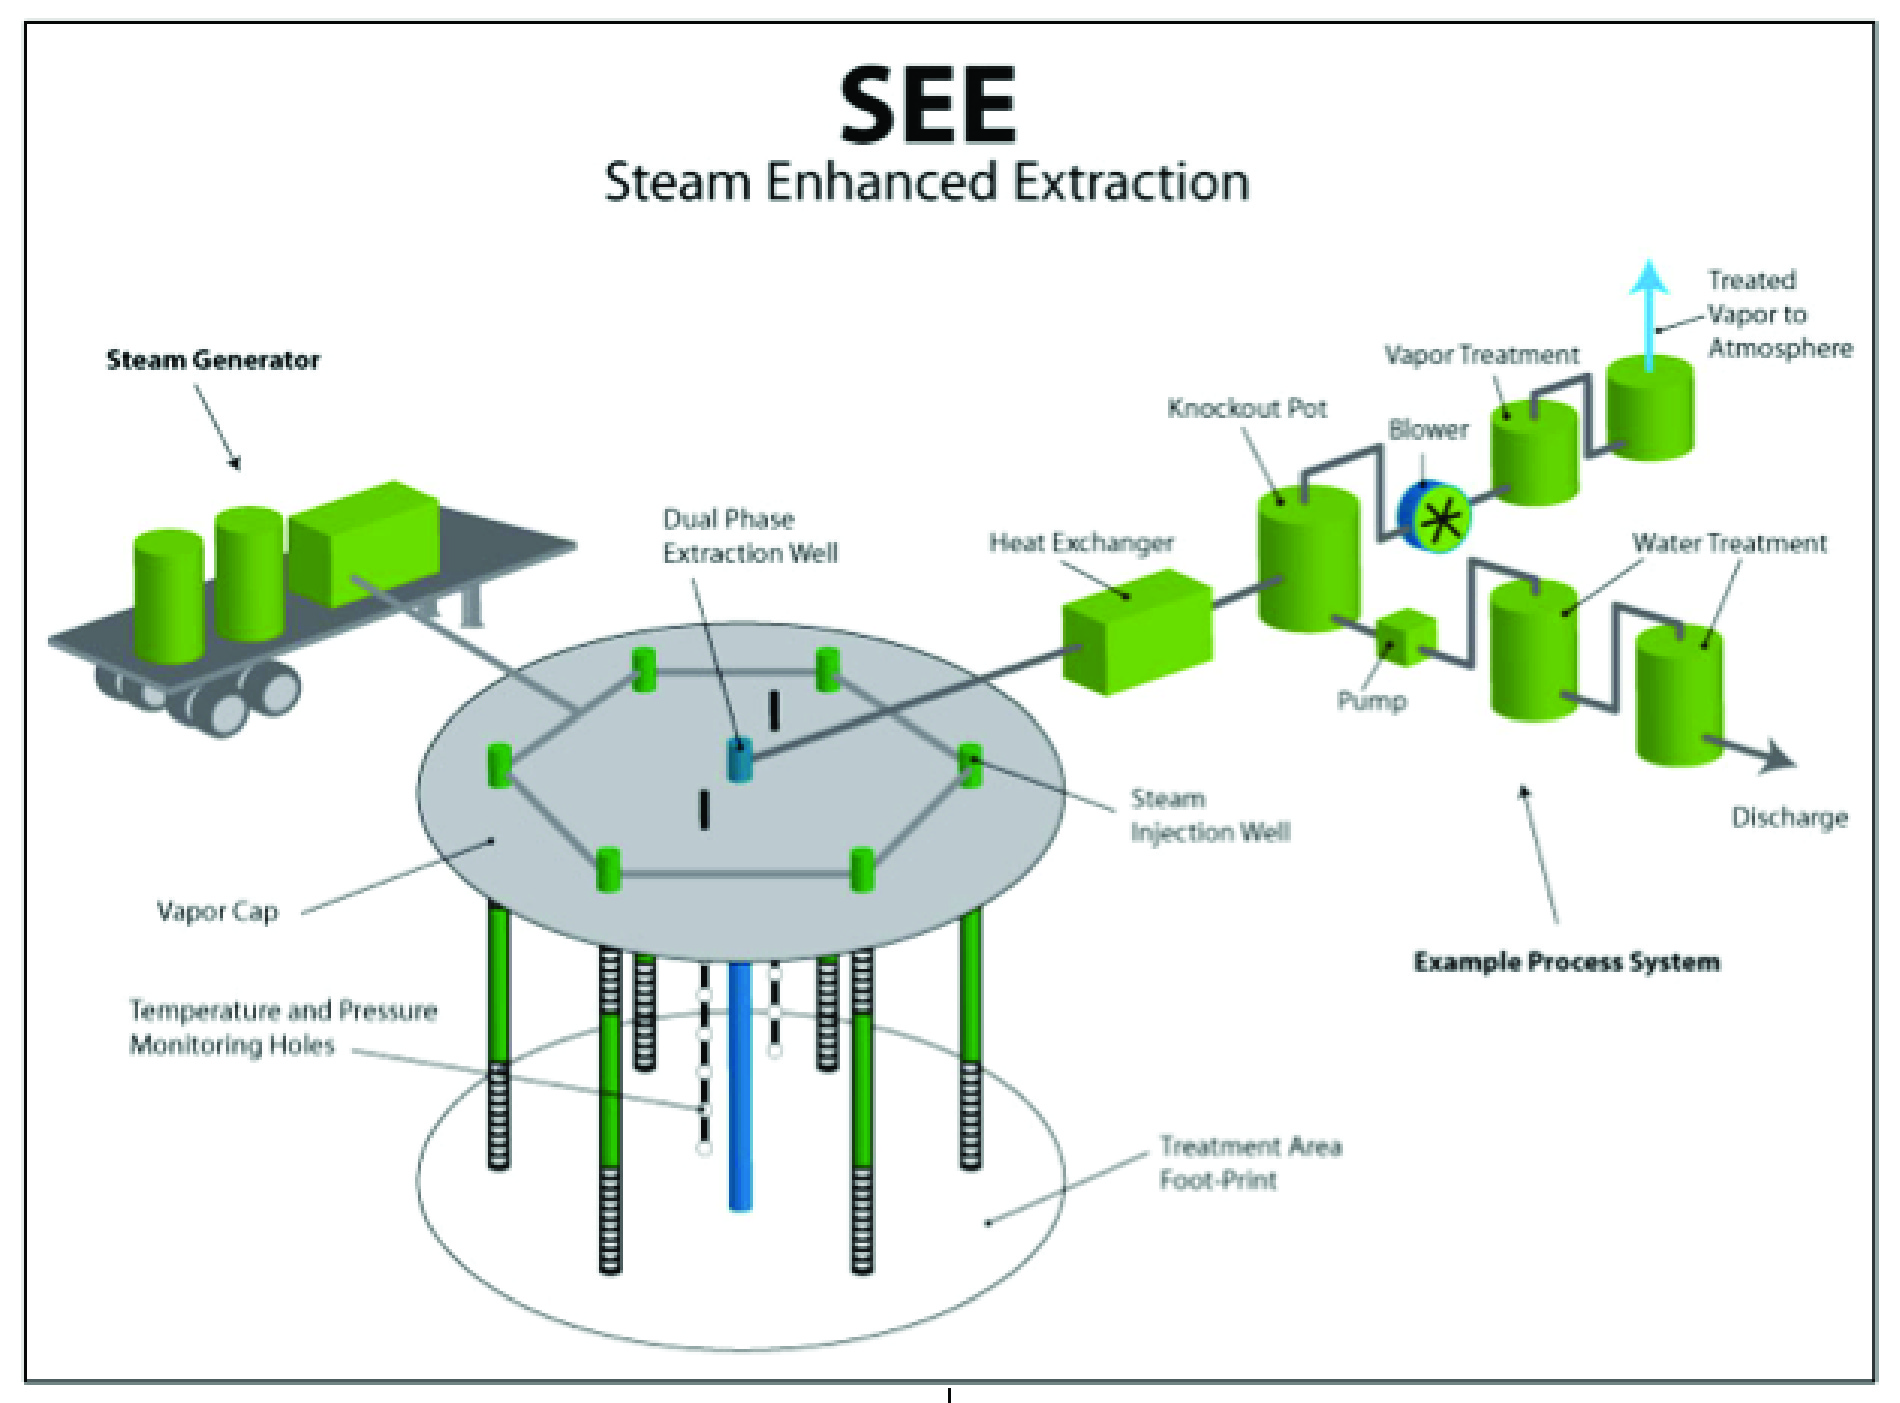
| 22:24, 10 January 2017 | Heron SEE Fig1.jpg (file) |  |
1.38 MB | Jbarnes | 1 | |
| 16:28, 10 January 2017 | Circle Open.PNG (file) |  |
230 bytes | Debra Tabron | Circle-open | 1 |
| 16:27, 10 January 2017 | Circle dark round-middle white.PNG (file) |  |
240 bytes | Debra Tabron | Circle-dark round-middle white | 1 |
| 16:27, 10 January 2017 | Circle black fill.PNG (file) |  |
212 bytes | Debra Tabron | Black fill circle | 1 |
| 16:26, 10 January 2017 | Circle with diagnal line.PNG (file) |  |
290 bytes | Debra Tabron | Circle with diagonal line | 1 |
| 14:46, 9 January 2017 | USEPA-2013-introductiontoinsitubioremediationofgroundwater.pdf (file) | 2.23 MB | Debra Tabron | USEPA, 2013. Introduction to In Situ Bioremediation of Groundwater. EPA 542-R-13-018. December, 2013. | 1 | |
| 14:08, 9 January 2017 | USEPA-2005-Five-Year Review.pdf (file) | 138 KB | Astenger | 1 | ||
| 13:57, 9 January 2017 | Davis-1998-Steam Injection.pdf (file) | 650 KB | Astenger | 1 | ||
| 13:44, 9 January 2017 | MacKinnon AnBiorem Fig2.jpg (file) |  |
88 KB | Debra Tabron | Figure 2. Example of bioaugmentation at a field site. | 1 |
| 13:41, 9 January 2017 | MacKinnon AnBiorem Fig1.jpg (file) |  |
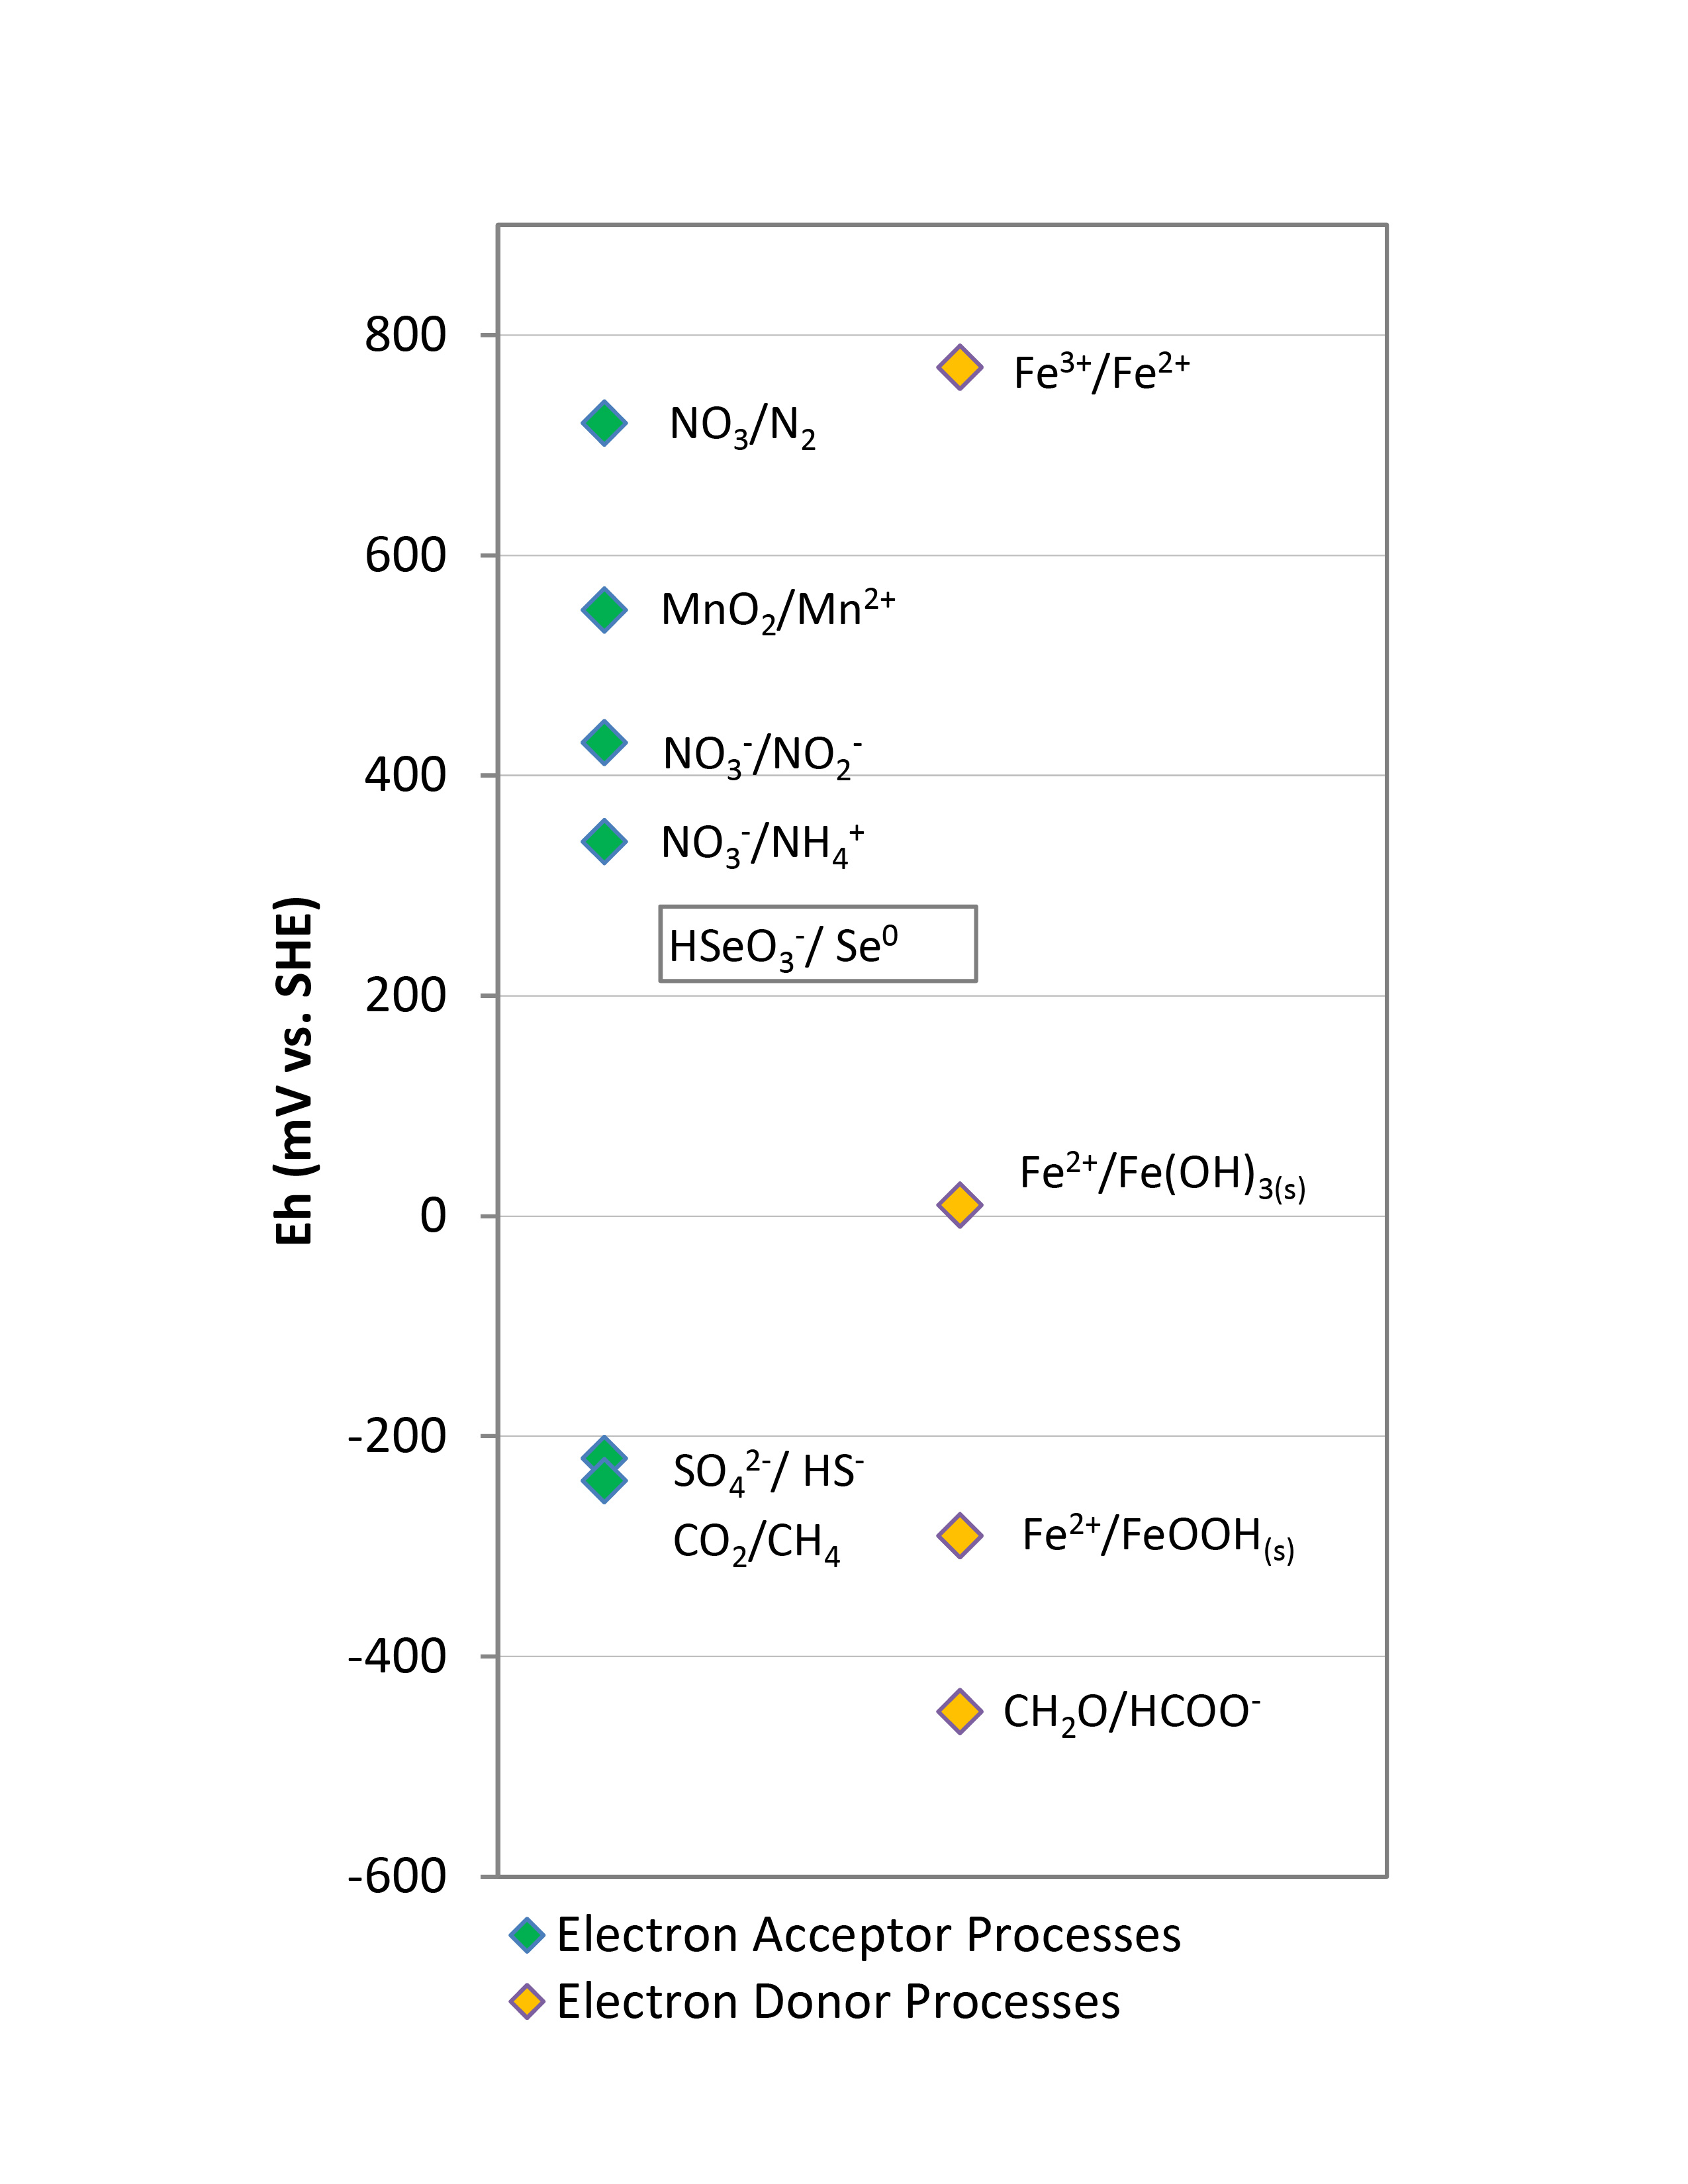
519 KB | Debra Tabron | Figure 1. Redox ladder for common electron donors and electron acceptors. | 1 |
| 10:39, 9 January 2017 | ATSDR-1995-2,4,6-trinitrotoluene.pdf (file) | 2.69 MB | Astenger | 1 | ||
| 10:00, 9 January 2017 | Spanggord-1985-Env.Fate.pdf (file) | 4.13 MB | Astenger | 1 | ||
| 09:24, 9 January 2017 | Dontsova-2007-Charact. and Fate.pdf (file) | 9.48 MB | Astenger | 1 | ||
| 09:09, 9 January 2017 | ATSDR-1997-HMX-FAQ.PDF.pdf (file) | 225 KB | Debra Tabron | Agency for Toxic Substances and Disease Registry (ATSDR), 1997. HMX Fact Sheet | 1 | |
| 09:06, 9 January 2017 | Dontsova-2014-Dissolution and Fate.pdf (file) | 3.71 MB | Astenger | 1 | ||
| 11:18, 6 January 2017 | Mackinnon-Article 2- figure 2.PNG (file) |  |
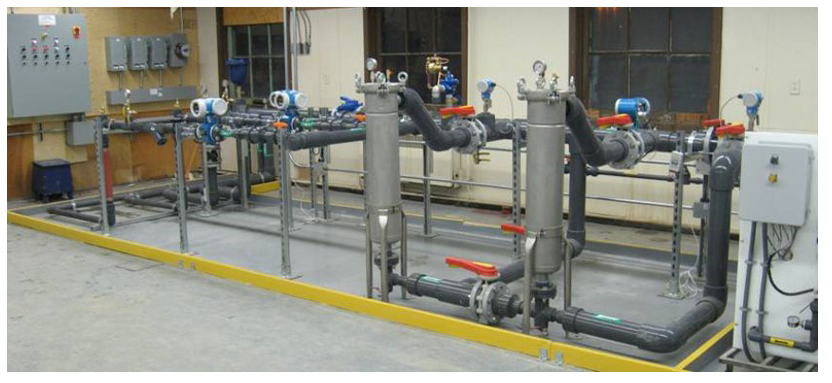
718 KB | Debra Tabron | Figure 2. Groundwater recirculation system. | 1 |
| 11:03, 6 January 2017 | Mackinnon-Article 2- figure 1.PNG (file) |  |
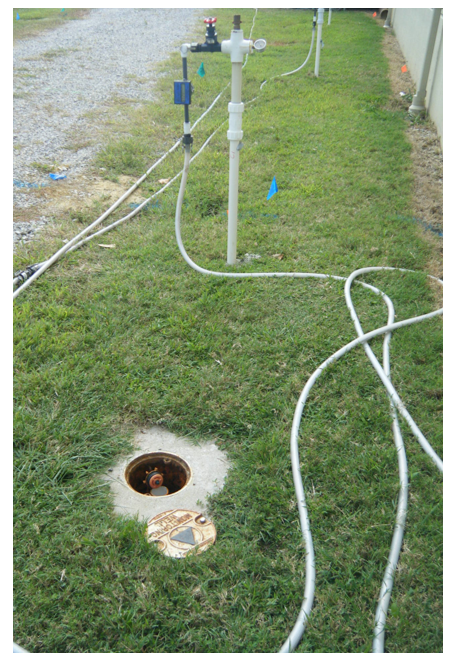
829 KB | Debra Tabron | Figure 1. Amendment addition for biobarrier. | 1 |
| 08:51, 6 January 2017 | ITRC-2007-Bioremed of Chlorinated Ethene.pdf (file) | 3.24 MB | Astenger | 1 | ||
| 08:43, 6 January 2017 | NAVFAC-2015-AttenuationPathways.pdf (file) | 3.89 MB | Astenger | 1 | ||
| 09:44, 5 January 2017 | Hawari-2014-Envl fate and ecological impact of emerging energic chemicals.pdf (file) | 3.41 MB | Debra Tabron | Hawari 2014 - Hawari, J., 2014. Annual Report 2013-2014. Environmental fate and ecological impact of emerging energetic chemicals (ADN, DNAN and its Amino-Derivatives, PETN, NTO, NQ, FOX-7, and FOX-12) and an insensitive formulation. Defense Research a... | 1 |