File list
This special page shows all uploaded files.
| Date | Name | Thumbnail | Size | User | Description | Versions |
|---|---|---|---|---|---|---|
| 16:16, 6 May 2019 | 2010-Riis-Migratioin pathways of Chlorinated Solvents.pdf (file) | 2.1 MB | Debra Tabron | Riis, C.E.; Christensen, A.G.; Hansen, M.H.; Husum, H.; Terkelsen, M., 2010. Vapor intrusion through sewer systems: Migration pathways of chlorinated solvents from groundwater to indoor air. In: Seventh Battelle International Conference on Remediation... | 1 | |
| 16:15, 6 May 2019 | 1996-Turco and Huss Rehabilitation of TCE.pdf (file) | 435 KB | Debra Tabron | Turco, M.A. and Huss, E.E., 1996. Rehabilitation of TCE-contaminated Underground Storm Water System using Trenchless Technology. Brown and Root Environmental, Wayne PA. | 1 | |
| 13:07, 2 May 2019 | 2017-Hinchee-1.4 Dioxane remediation by extreme soil XSVE ER-201326 Final Report.pdf (file) | 11.28 MB | Debra Tabron | Hinchee, R.E., P.C. Johnson, P.R. Dahlen, and D.R. Durris, 2017. 1,4-Dioxane remediation by extreme soil vapor extraction (XSVE). Final Report ESTCP Project 201326. | 1 | |
| 11:39, 2 May 2019 | 2018-Evans-ER-201324 Cost & Performance Report.pdf (file) | 2.02 MB | Debra Tabron | Evans, P., D.J. Hooper, M. Lamar, D. Nguyen, P. Dugan, M. Crimi, and N. Ruiz, 2018. Sustained in situ chemical oxidation (ISCO) of 1,4-dioxane and chlorinated VOCs using slow-release chemical oxidant cylinder. ESTCP Cost and Performance Report, ER-201324 | 1 | |
| 15:58, 1 May 2019 | 2012-Shangraw-Full-scale Treatment of 1,4-dioxane.pdf (file) | 3.47 MB | Debra Tabron | Shangraw, T. and W. Plaehn, 2012. Full-scale treatment of 1,4-dioxane using a bioreactor. Federal Remediation Technologies Roundtable Meetin | 1 | |
| 15:17, 1 May 2019 | 2007-Bowman-System and method fo remediating contaminated soil and groundwater.pdf (file) | 1.2 MB | Debra Tabron | Bowman, R.H., Lahey, T. and Herlihy, P. System and method for remediating contaminated soil and groundwater in situ, Applied Process Tech Inc, 2007. U.S. Patent 7,264,419. | 1 | |
| 09:57, 1 May 2019 | 1997-Fleming-Laboratory assessment of advanced oxidation process.pdf (file) | 2.81 MB | Debra Tabron | Fleming, E.C., M.E. Zappi, E. Toro, R. Hernandez, and K. Myters, 1997. Laboratory assessment of advanced oxidation processes for treatment of explosives and chlorinated solvents in groundwater from the former Nebraska ordnance plant. Technical Report S... | 1 | |
| 14:49, 30 April 2019 | 2000-Keel-Downtown Bellingham Air Toxics Screening Project.pdf (file) | 520 KB | Debra Tabron | Keel, L. and A. Franzmann, 2000. Downtown Bellingham air toxics screening project, 1995-1999 staff report. Northwest Air Pollution Authority (NWAPA) | 1 | |
| 16:08, 26 April 2019 | 1998-Ellis-Destroying 1,4-dioxane in byproduct streams formed during polyester.pdf (file) | 606 KB | Debra Tabron | Ellis, R.A. and J.S. Thomas, 1998. Destroying 1,4-dioxane in byproduct streams formed during polyester synthesis. United States Patent Office: Wellman Inc. | 1 | |
| 16:02, 26 April 2019 | 1997-Sachdeva-Apparatus for decontaminating a liquid surfractant.pdf (file) | 1.1 MB | Debra Tabron | achdeva, Y. and R. Gabriel, 1997. Apparatus for decontaminating a liquid surfractant of dioxane, United States: Pharm-Eco Laboratories Inc. | 1 | |
| 15:56, 26 April 2019 | 2012-Ortega-Sulfonation sulfation.pdf (file) | 1.88 MB | Debra Tabron | Ortega, J.A.T., 2012. Sulfonation/sulfation processing technology for anionic surfactant manufacture. Advances in Chemical Engineering. | 1 | |
| 15:48, 26 April 2019 | 2001-Black-Occurrence of 1,4-dioxane in cosmetic raw materials....pdf (file) | 48 KB | Debra Tabron | Black, R.E., F.J. Hurley, and D.C. Havery, 2001. Occurrence of 1,4-dioxane in cosmetic raw materials and finished cosmetic products. Journal of the Association of Official Agricultural Chemists International, 84(3), 666-670 | 1 | |
| 15:05, 26 April 2019 | 2018-USEPA-Edition of the Drinking Water Standards and Health Advisories.pdf (file) | 777 KB | Debra Tabron | US EPA, 2018(a). 2018 Edition of the Drinking Water Standards and Health Advisories. US Environmental Protection Agency, Publication number: EPA 822-F-18-001. | 1 | |
| 14:17, 26 April 2019 | 2012-ASTDR. Toxicological profile for 1,4-dioxane.pdf (file) | 6.82 MB | Debra Tabron | ATSDR, 2012. Toxicological profile for 1,4-dioxane. Agency for Toxic Substances and Disease Registry | 1 | |
| 16:11, 25 April 2019 | 2016-Knappe-Occurrence of 1,4-dioxane in the Cape Fear River.pdf (file) | 3.43 MB | Debra Tabron | Knappe, D.R.U., C. Lopez-Velandia, Z. Hopkins, and M. Sun, 2016. Occurrence of 1,4-dioxane in the Cape Fear River watershed and effectiveness of water treatment options for 1,4-dioxane control. Water Resources Research Institute of The University of No... | 1 | |
| 15:11, 25 April 2019 | 1994-Parales-Degradation of 1,4-Dioxane by an Actinomycete in Pure Culture.pdf (file) | 829 KB | Debra Tabron | Parales, R.E., J.E. Adamus, N. White, and H.D. May, 1994. Dedegradation of 1,4-dioxane by an Actinomycete in pure culture. Applied and Environmental Microbiology, 60(12), 4527-4530. | 1 | |
| 10:51, 25 April 2019 | 2017-USEPA- Technical Fact Sheet.pdf (file) | 126 KB | Debra Tabron | US EPA, 2017. Technical Fact Sheet – 1,4-Dioxane. Publication number: EPA 505-F-17-001 | 1 | |
| 10:49, 25 April 2019 | 2007-NIOSH Pocket Guide to Chemical Hazards.pdf (file) | 6.05 MB | Debra Tabron | NIOSH, 2007. NIOSH Pocket Guide to Chemical Hazards. US Department of Health and Human Services, DHHS (NIOSH) Publication Number 2005-149. | 1 | |
| 09:18, 16 April 2019 | 2018-USEPA. Remedial Technology Fact Sheet.pdf (file) | 915 KB | Debra Tabron | USEPA, 2018. Remedial Technology Fact Sheet — Activated Carbon-Based Technology for In Situ Remediation. EPA 542-f-18-001 | 1 | |
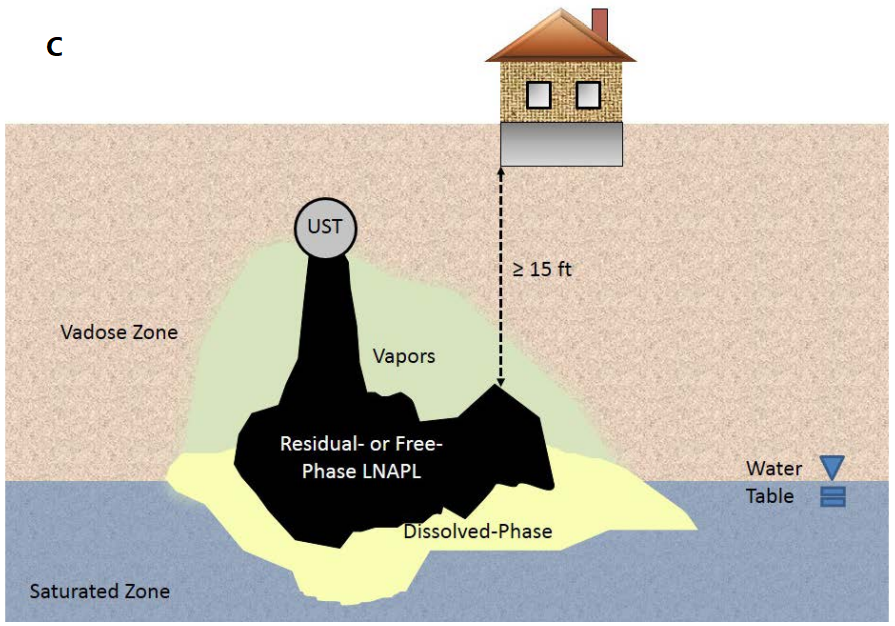
| 08:40, 5 April 2019 | Weaver1w2fig2c.png (file) |  |
584 KB | Debra Tabron | Figure 2, Panel C: Vertical separation distance from LNAPL petroleum contamination. | 1 |
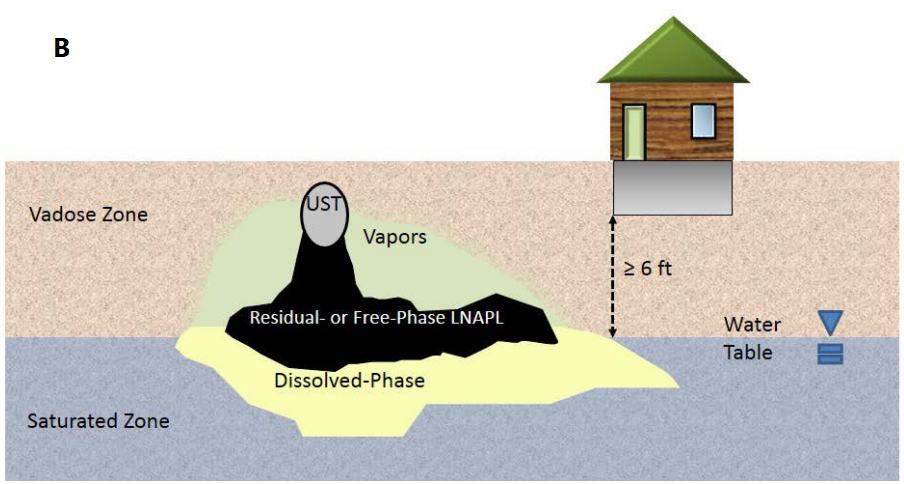
| 08:38, 5 April 2019 | Weaver1w2fig2b.png (file) |  |
426 KB | Debra Tabron | Figure 2, Panel B: Vertical separation distance from aqueous phase petroleum contamination. | 1 |
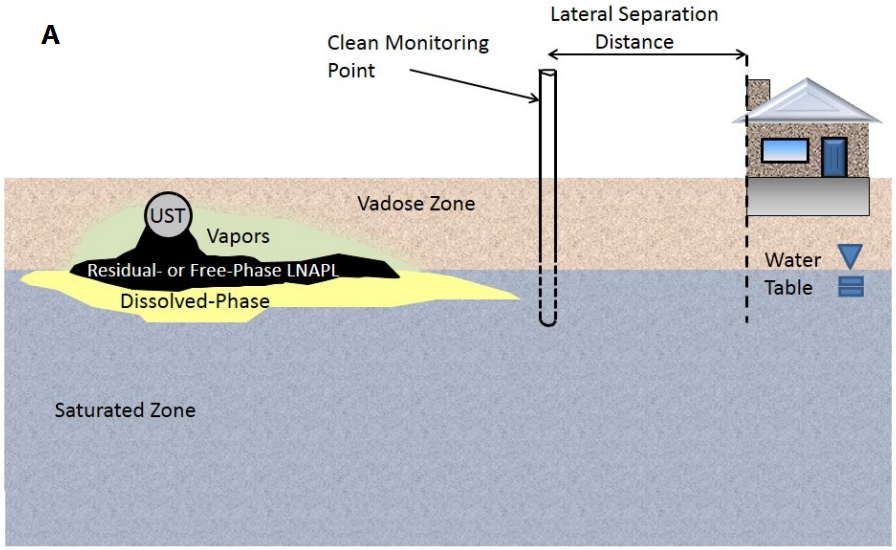
| 08:37, 5 April 2019 | Weaver1w2fig2a.png (file) |  |
479 KB | Debra Tabron | Figure 2, Panel A: Lateral separation distance from petroleum contamination. | 1 |
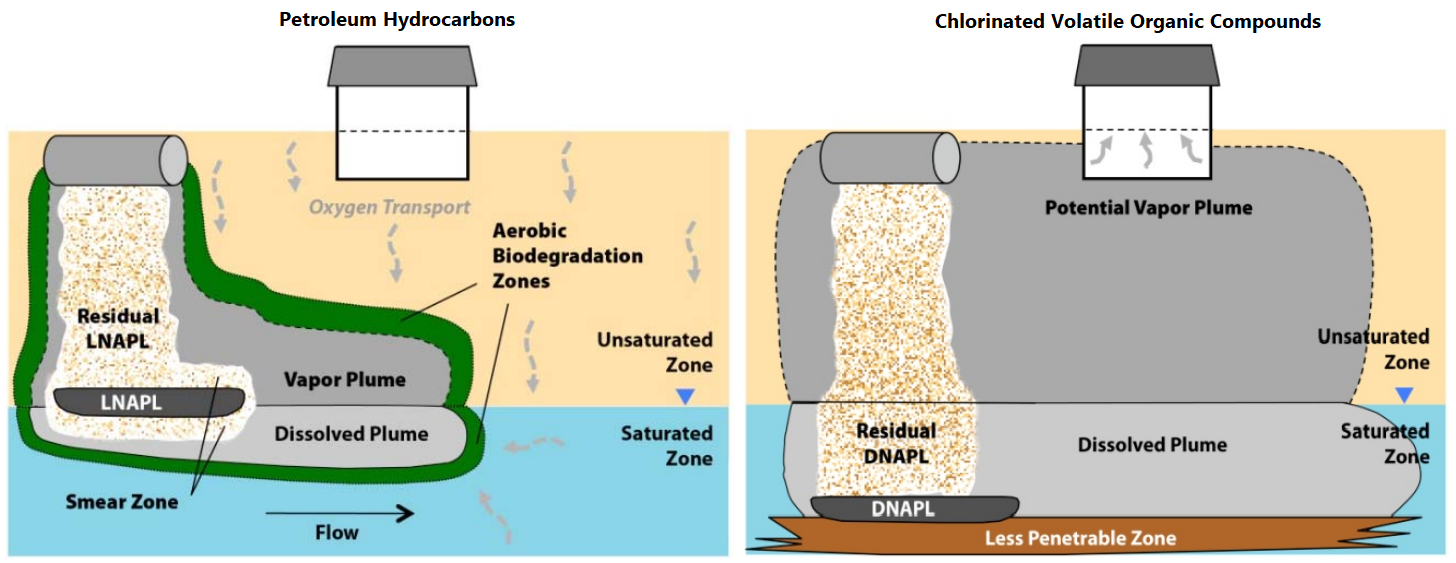
| 08:31, 5 April 2019 | Weaver1w2fig1.png (file) |  |
598 KB | Debra Tabron | Figure 1 Typical conceptual models for vapor intrusion from a release of petroleum hydrocarbons (such as a fuel spill) and for a release of chlorinated volatile organic compounds | 1 |
| 13:02, 4 April 2019 | 2009-Davis- Bioattenuation of Petroleum Hydrocarbon Vapors in the Subsurface.pdf (file) | 789 KB | Debra Tabron | Davis, R.V. 2009. Bioattenuation of Petroleum Hydrocarbon Vapors in the Subsurface: Update on Recent Studies and Proposed Screening Criteria for the Vapor‐Intrusion Pathway. LUSTLine Bulletin 61:11‐14. New England Interstate Water Pollution Control... | 1 | |
| 12:53, 4 April 2019 | 2013-USEPA-Evaluation of Empirical Data to Support soil Vapor intrusion Screening Criteria.pdf (file) | 2.71 MB | Debra Tabron | U.S. Environmental Protection Agency (USEPA), 2013. Evaluation of Empirical Data to Support Soil Vapor Intrusion Screening Criteria for Petroleum Hydrocarbon Compounds. Office of Underground Storage Tanks, Washington, D.C. EPA 510-R-13-001. Report pdf. | 1 | |
| 10:51, 4 April 2019 | 2012b-USEPA-An Approach for Dev. Site-Specific Lateral and Vertical Inclusion Zones....pdf (file) | 2.87 MB | Debra Tabron | U.S. Environmental Protection Agency (USEPA), 2012. An Approach for developing site-specific lateral and vertical inclusion zones within which structures should be evaluated for petroleum vapor intrusion due to releases of motor fuel from underground s... | 1 | |
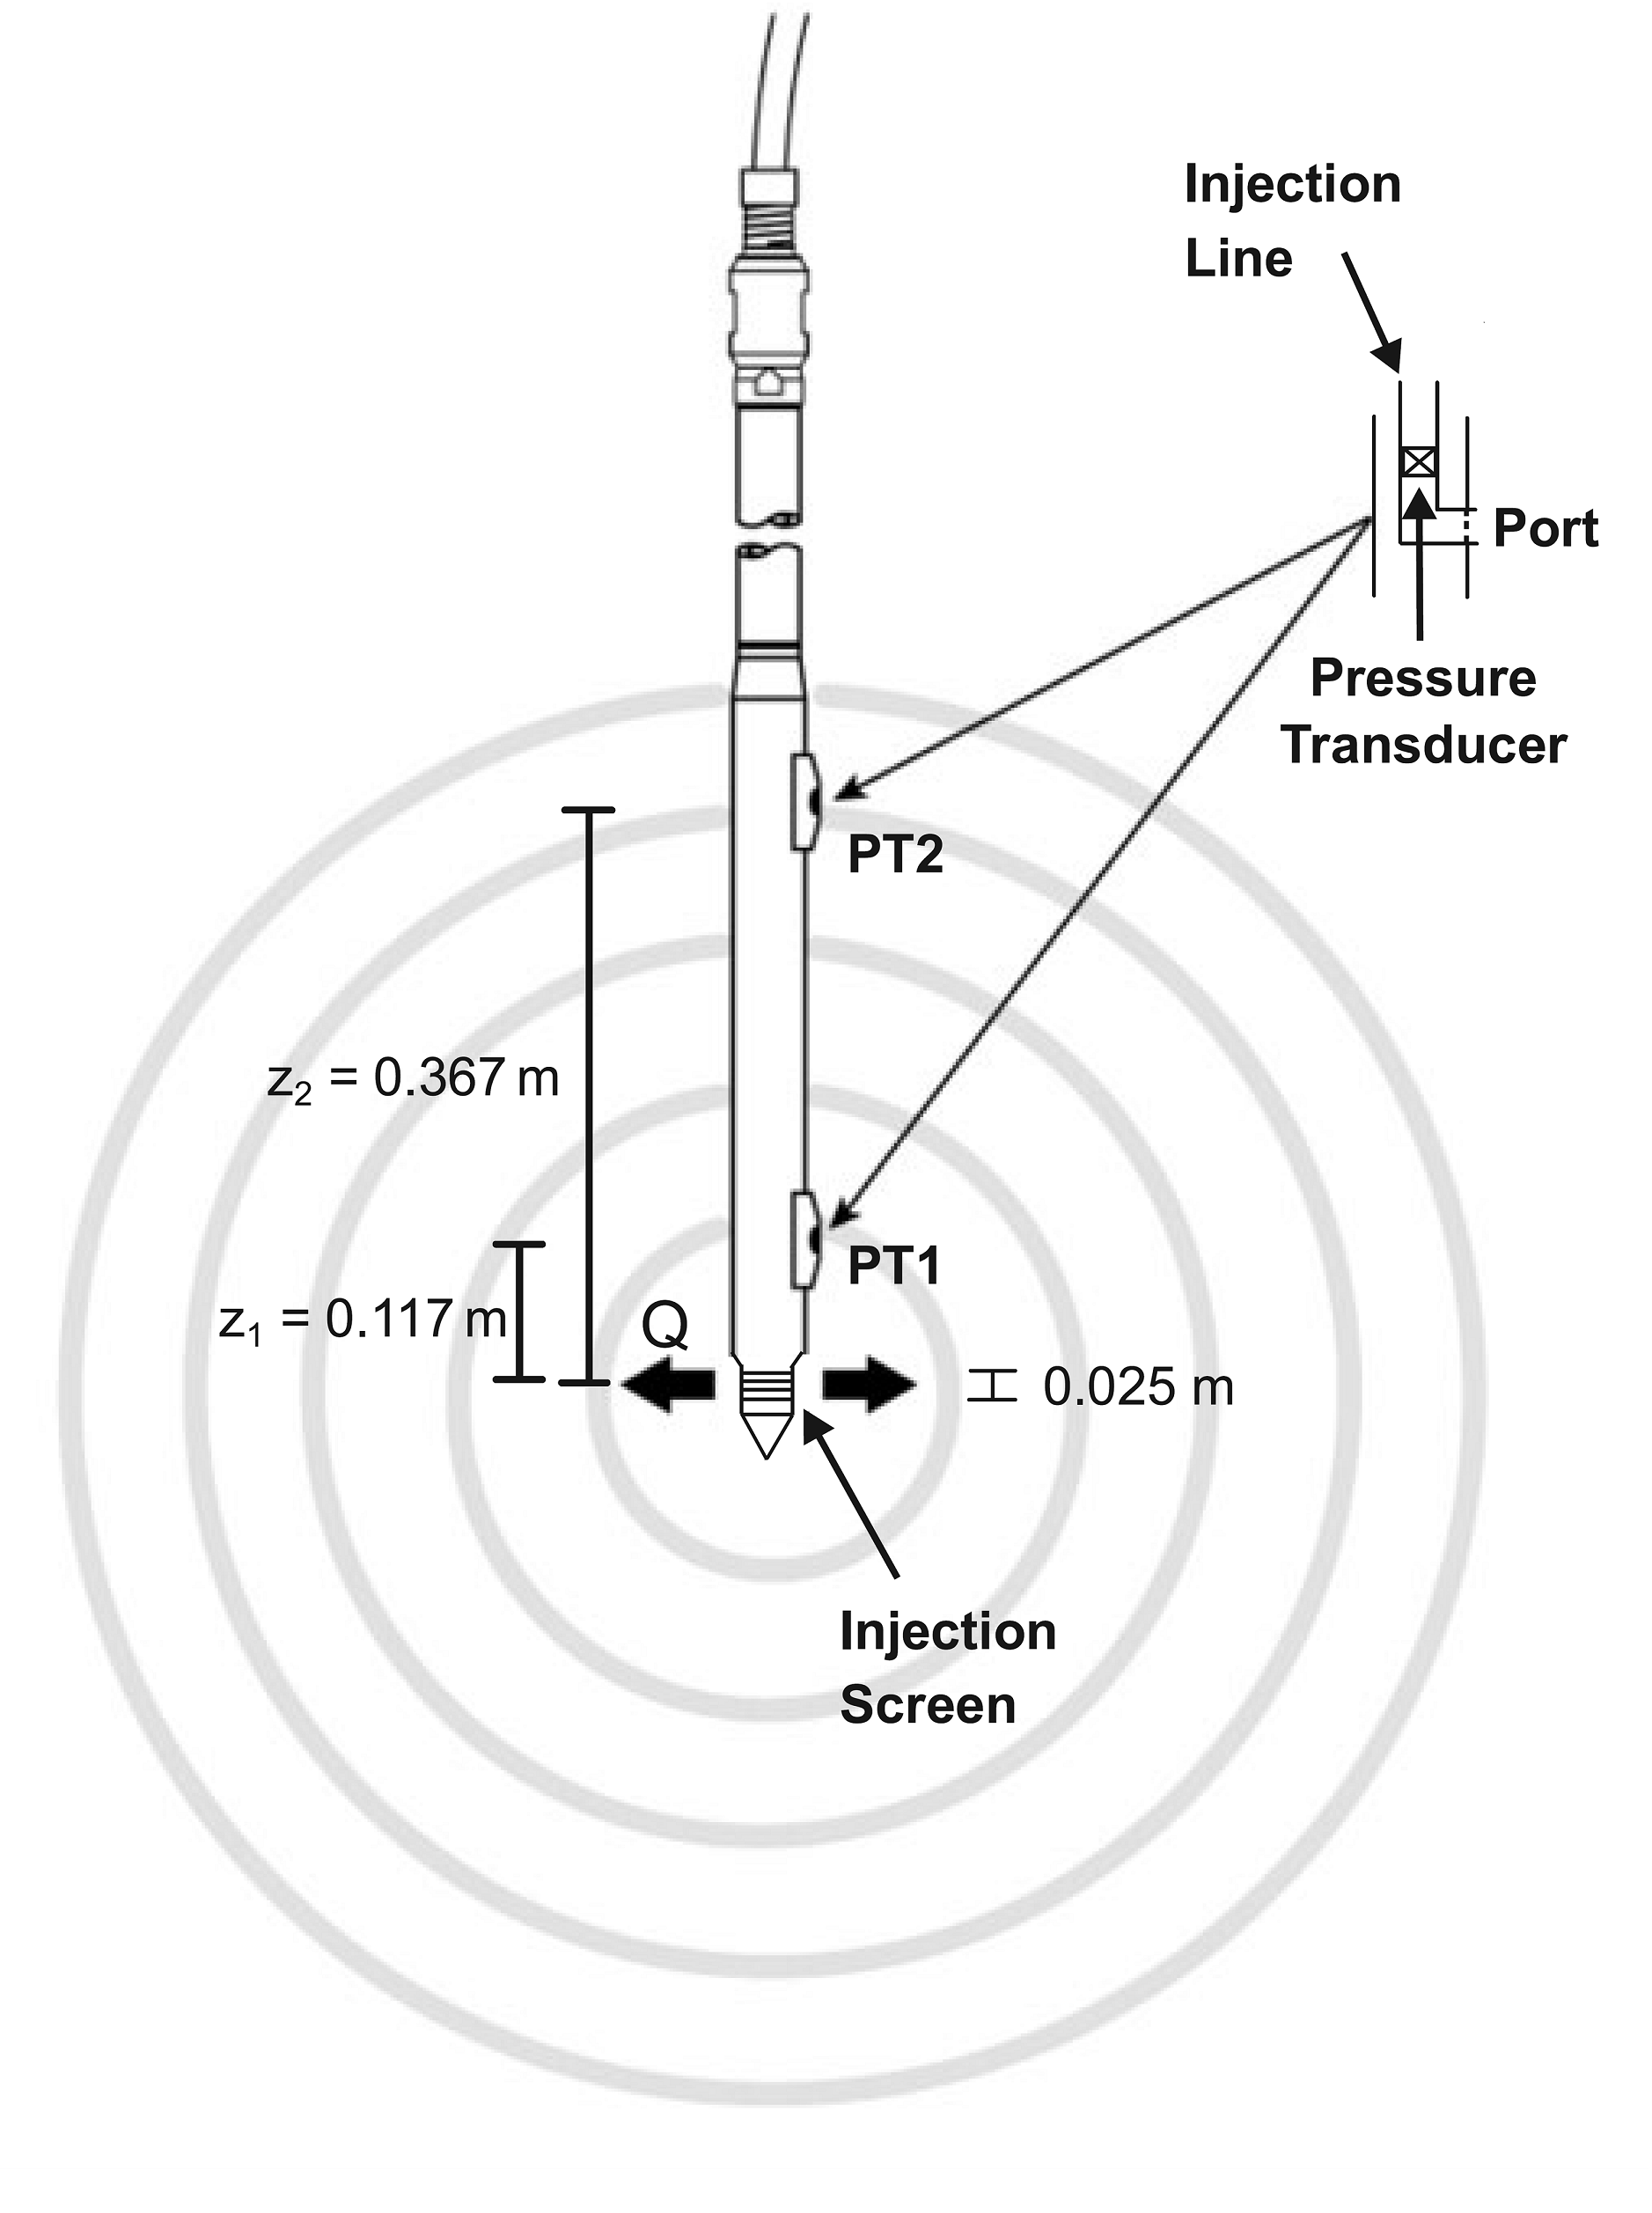
| 09:44, 2 April 2019 | Liu1w2 Fig7A 2.png (file) |  |
698 KB | Debra Tabron | Figure 7A. Schematic of the DPP (not to scale). | 1 |
| 09:44, 21 March 2019 | GreenTank.mp4 (file) | 2.15 MB | Jhurley | Dye tank simulation of matrix diffusion. | 1 | |
| 15:26, 6 March 2019 | 2000-Yeh-Hydraulic Tomography..Development of a new aquifer test method.pdf (file) | 1.37 MB | Debra Tabron | Yeh, T.C.J., and S. Liu. 2000. Hydraulic tomography: Development of a new aquifer test method. Water Resources Research 36, no. 8: 2095-2105. | 1 | |
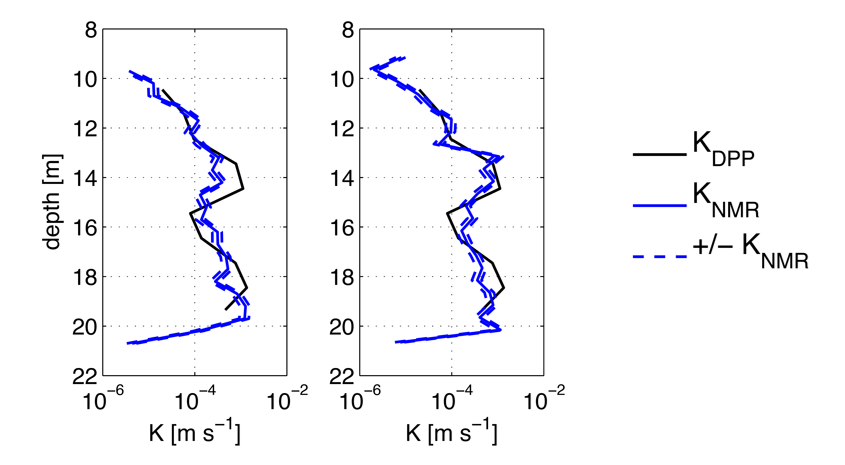
| 13:37, 5 March 2019 | Liu1w2 Fig9C.png (file) |  |
56 KB | Debra Tabron | Figure 9C. Comparison of NMR and DPP ''K'' estimates at two GEMS locations. The dash lines show the range of the NMR ''K'' estimates due to the uncertainty in the empirical parameters used in the pore size - ''K'' relationship. (Knight et al., 2016) | 1 |
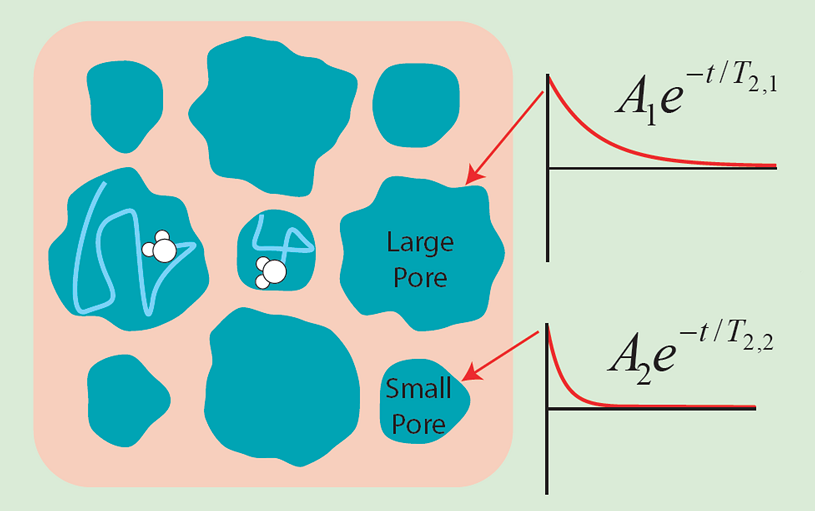
| 13:36, 5 March 2019 | Liu1w2 Fig9B.png (file) |  |
113 KB | Debra Tabron | Figure 9B. NMR responses as a function of pore size, where ''A'' is the initial magnetization, T<sub>2</sub> is NMR relaxation time. (Grunewald et al., 2011) | 1 |
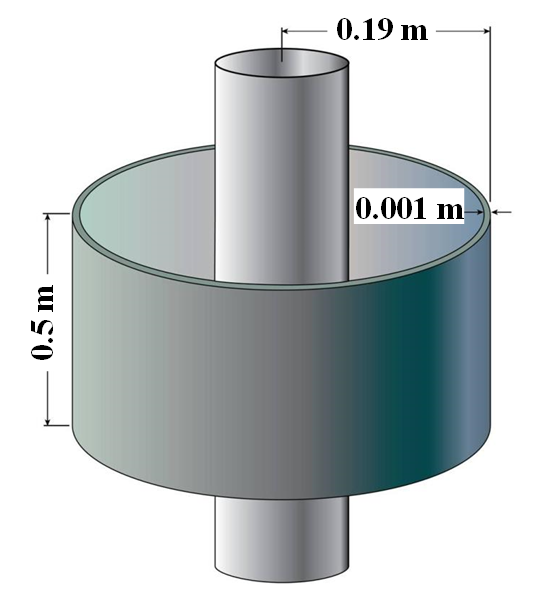
| 13:35, 5 March 2019 | Liu1w2 Fig9A.png (file) |  |
88 KB | Debra Tabron | Figure 9A. Measurement domain around a NMR borehole probe. | 1 |
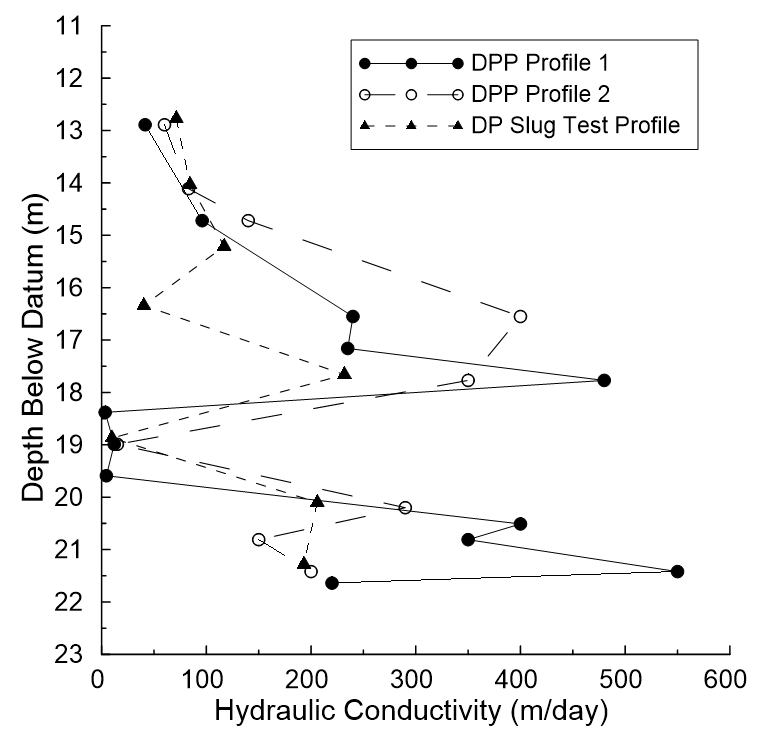
| 13:34, 5 March 2019 | Liu1w2 Fig8.png (file) |  |
39 KB | Debra Tabron | Figure 8. Comparison of DPP and DP multilevel slug test ''K'' profiles at GEMS. The slug test profile is located 2 m northwest of DPP profile 1, and 2 m southeast of DPP profile 2. (Butler, 2005) | 1 |
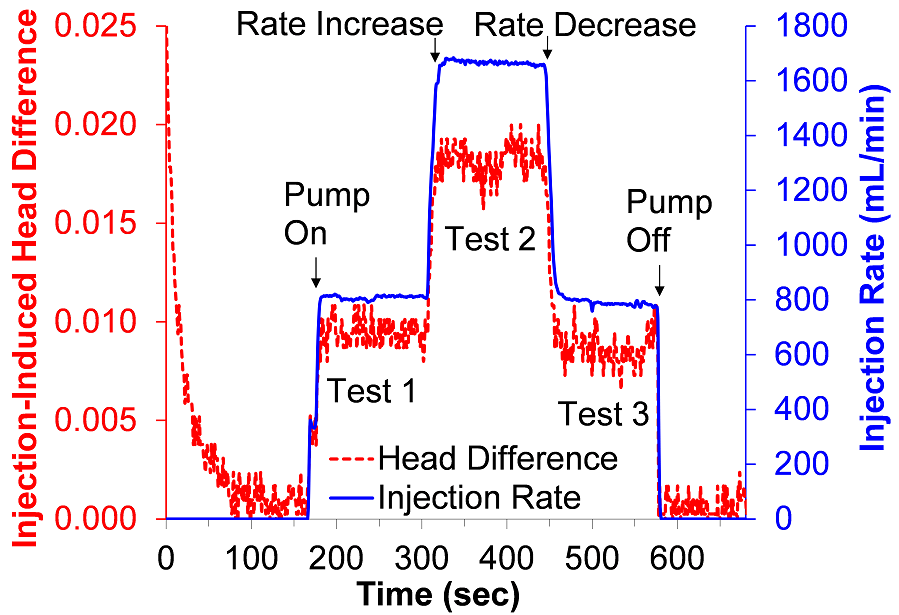
| 13:33, 5 March 2019 | Liu1w2 Fig7B.png (file) |  |
123 KB | Debra Tabron | Figure 7B. Example DPP test sequence at GEMS (Liu et al., 2012) | 1 |
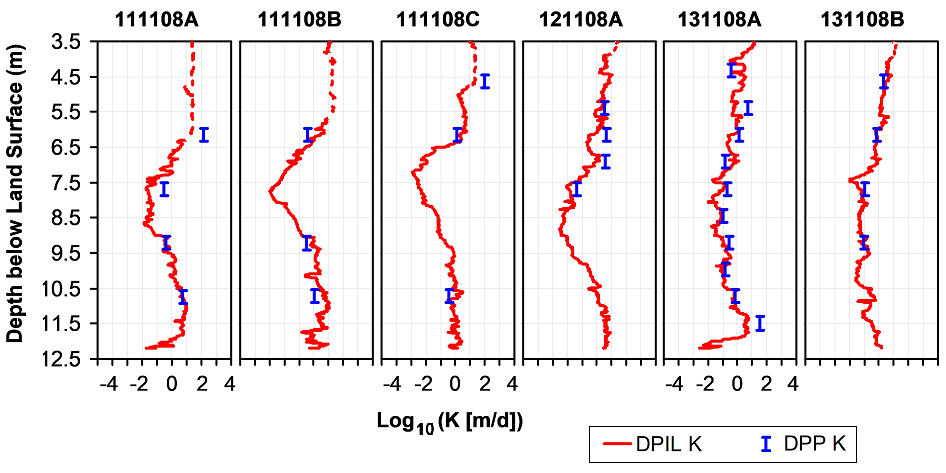
| 13:31, 5 March 2019 | Liu1w2 Fig6C.png (file) |  |
81 KB | Debra Tabron | Figure 6C. Six example DPIL (red curve) ''K'' profiles calibrated by collocated Direct Push Permeameter tests (blue bars) at the MacroDispersion Experiment (MADE) site, Columbus, MS. The dashed curves represent the upper ''K'' limit for continuous DPIL... | 1 |
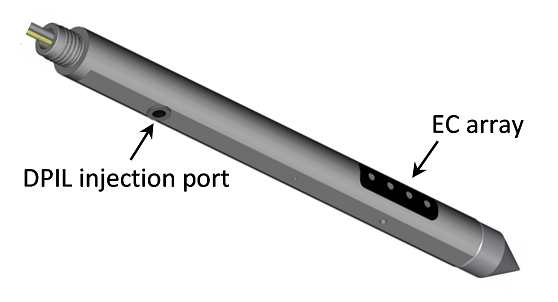
| 13:30, 5 March 2019 | Liu1w2 Fig6B.png (file) |  |
44 KB | Debra Tabron | Figure 6B. Artistic rendering of the HPT (continuous DPIL probe combined with an EC Wenner array) (Lessoff et al., 2010). | 1 |
| 13:29, 5 March 2019 | Liu1w2 Fig6A.png (file) |  |
64 KB | Debra Tabron | Figure 6A. Schematic of the DPIL with a screen attached to the probe rod at its lower end (Liu et al., 2012). | 1 |
| 13:27, 5 March 2019 | Liu1w2 Fig5.png (file) |  |
75 KB | Debra Tabron | Figure 5. Schematic diagram showing the borehole flowmeter profiling procedure (Molz et al., 1989). | 1 |
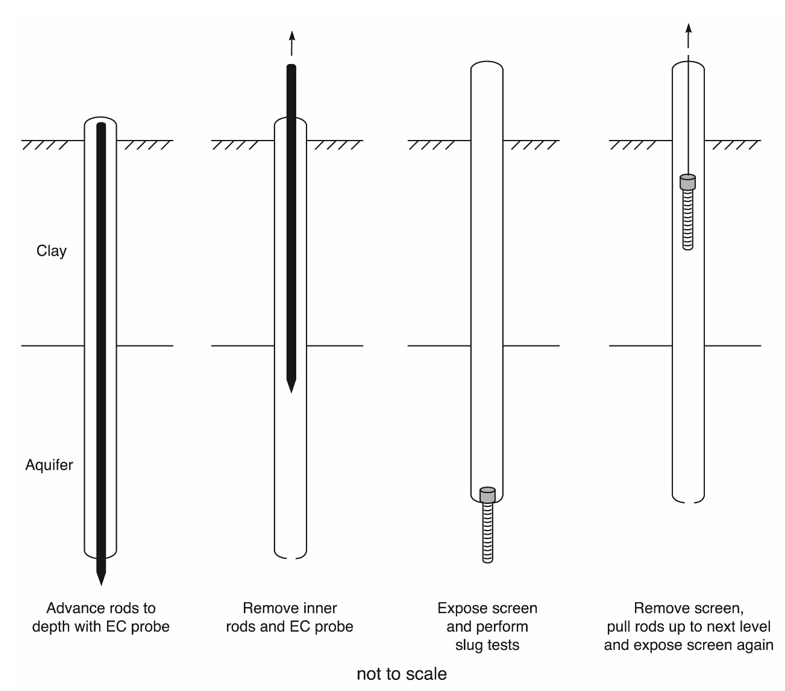
| 13:21, 5 March 2019 | Liu1w2 Fig4.png (file) |  |
59 KB | Debra Tabron | Figure 4. Schematic illustrating hydrostratigraphic profiling, the combination of electrical conductivity (EC) and multilevel slug test profiling (Sellwood et al., 2005). | 1 |
| 13:20, 5 March 2019 | Liu1w2 Fig3.png (file) |  |
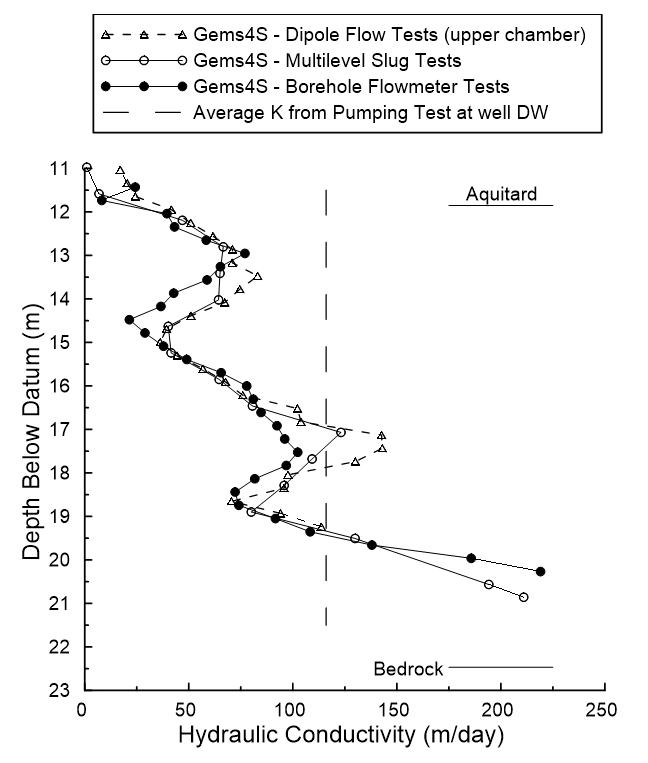
49 KB | Debra Tabron | Figure 3. ''K'' estimates from different field methods at GEMS (Butler, 2005). Well DW is located 2 m east of GEMS4S. | 1 |
| 13:18, 5 March 2019 | Liu1w2 Fig2B.png (file) |  |
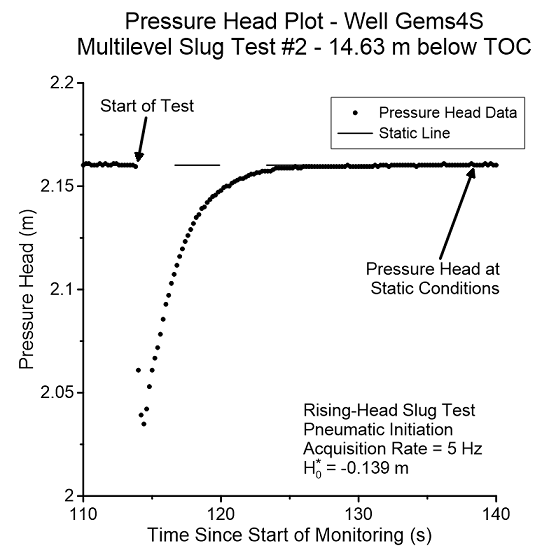
58 KB | Debra Tabron | Figure 2B. Example data plot from a multilevel slug test at GEMS. Test is initiated by sudden depressurization of a pressurized air column | 1 |
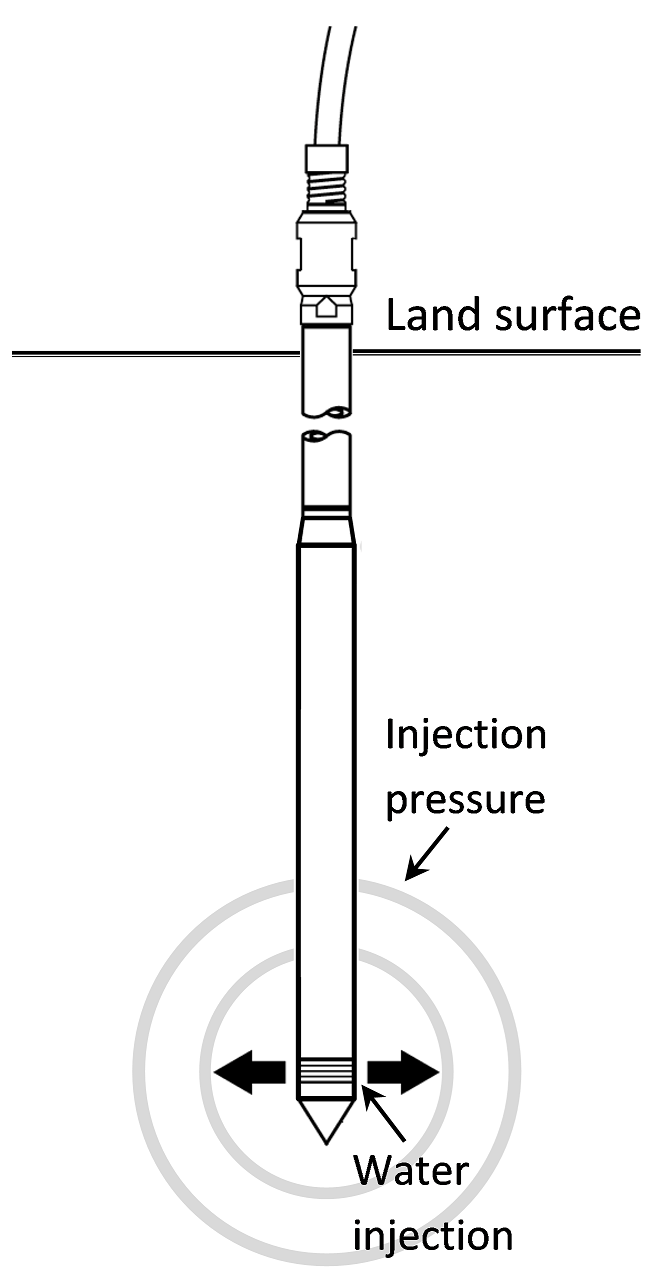
| 13:18, 5 March 2019 | Liu1w2 Fig2A.png (file) |  |
271 KB | Debra Tabron | Figure 2A. Schematic of a falling-head slug test (water flows from well into aquifer) performed in a multi-level slug-test system. Head change is introduced in standpipe, which is directly connected to the interval isolated by the straddle packers (not... | 1 |
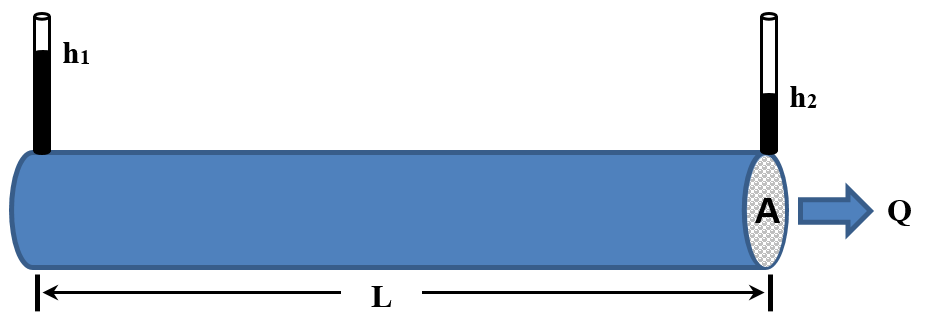
| 13:09, 5 March 2019 | Liu1w2 Fig1.png (file) |  |
12 KB | Debra Tabron | Figure 1. Schematic of Darcy’s Law flow experiment. | 1 |
| 13:08, 5 March 2019 | Liu1w2 Eq6.png (file) | 6 KB | Debra Tabron | 1 | ||
| 13:07, 5 March 2019 | Liu1w2 Eq5.png (file) | 4 KB | Debra Tabron | 1 | ||
| 13:05, 5 March 2019 | Liu1w2 Eq4.png (file) |  |
7 KB | Debra Tabron | 1 | |
| 13:04, 5 March 2019 | Liu1w2 Eq3.png (file) | 4 KB | Debra Tabron | 1 | ||
| 13:04, 5 March 2019 | Liu1w2 Eq2.png (file) | 4 KB | Debra Tabron | 1 | ||
| 13:03, 5 March 2019 | Liu1w2 Eq1.png (file) | 3 KB | Debra Tabron | 1 | ||
| 16:49, 18 February 2019 | Allen-King1w2 Fig5.png (file) |  |
126 KB | Debra Tabron | 1 |