File list
This special page shows all uploaded files.
| Date | Name | Thumbnail | Size | User | Description | Versions |
|---|---|---|---|---|---|---|
| 16:19, 9 January 2020 | Wilson1w2Fig5.png (file) |  |
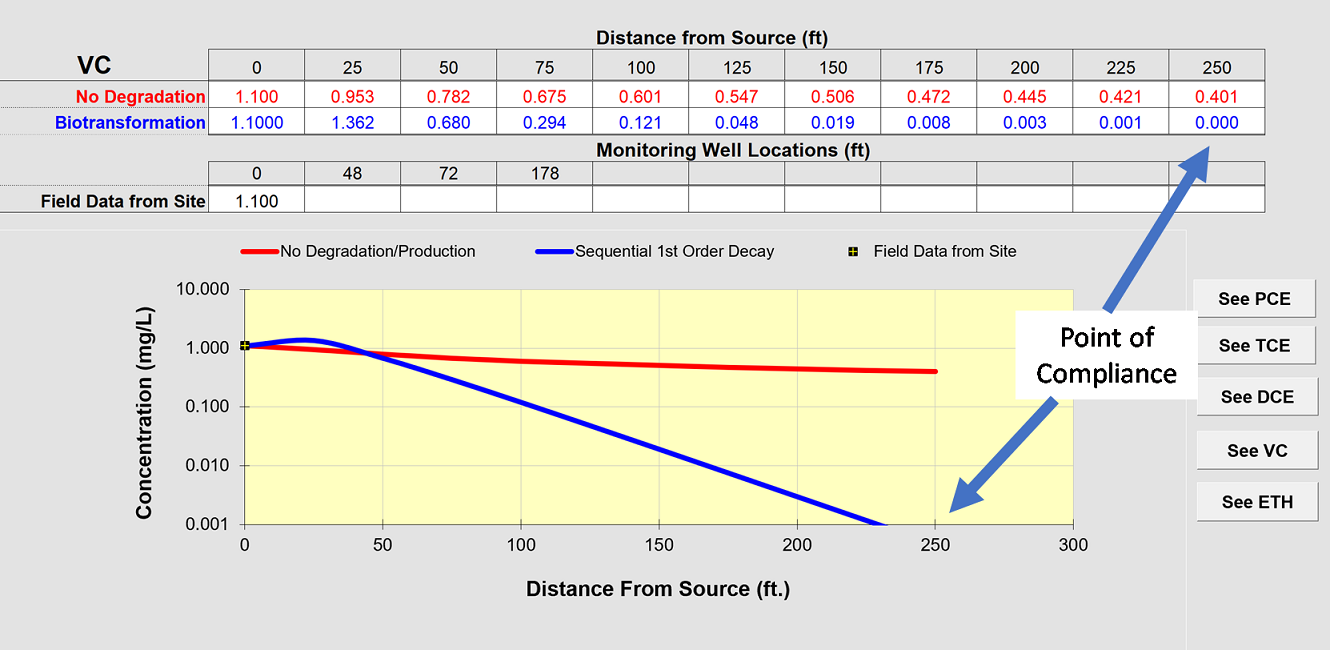
197 KB | Debra Tabron | Figure 5. Output of the RUN CENTERLINE simulation of conditions after an active remedy was implemented with a source concentration of 1.1 mg/L, projecting the concentration of vinyl chloride at a distance corresponding to a point-of-compliance well. | 1 |
| 16:16, 9 January 2020 | Wilson1w2Fig4.png (file) |  |
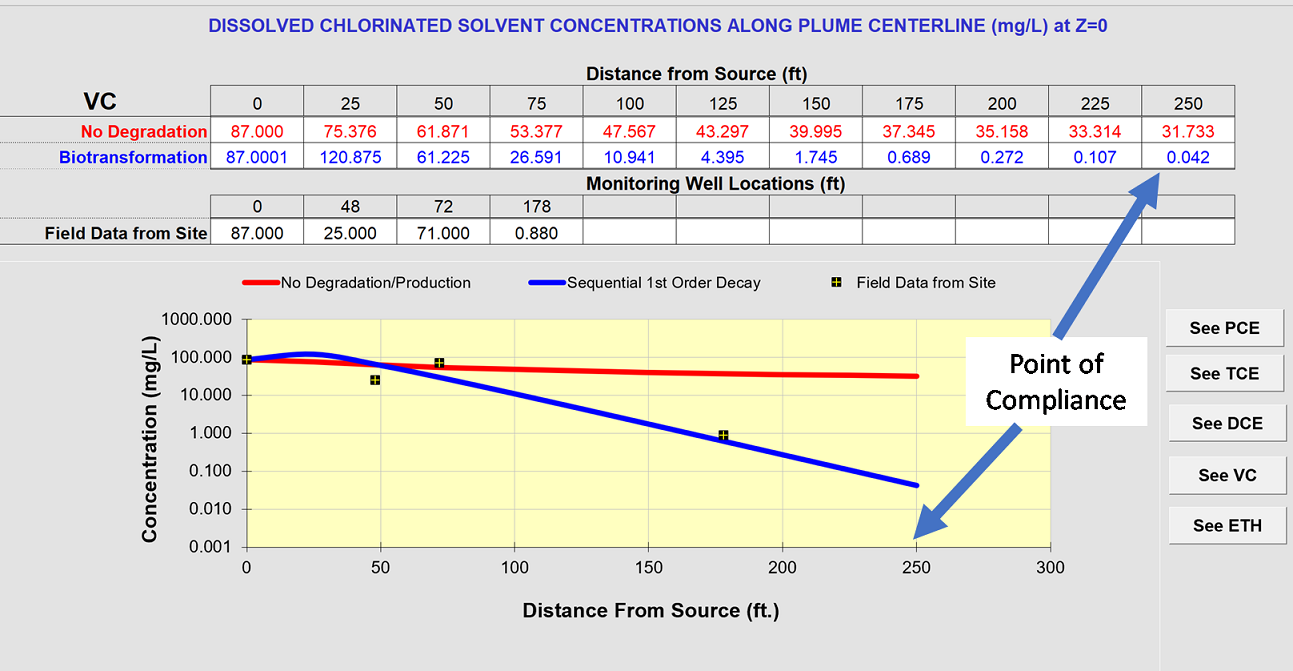
240 KB | Debra Tabron | Figure 4. Output of the RUN CENTERLINE simulation in BIOCHLOR comparing the fit between the simulation and the field data for vinyl chloride before an active remedy was implemented. | 1 |
| 16:14, 9 January 2020 | Wilson1w2Fig3.png (file) |  |
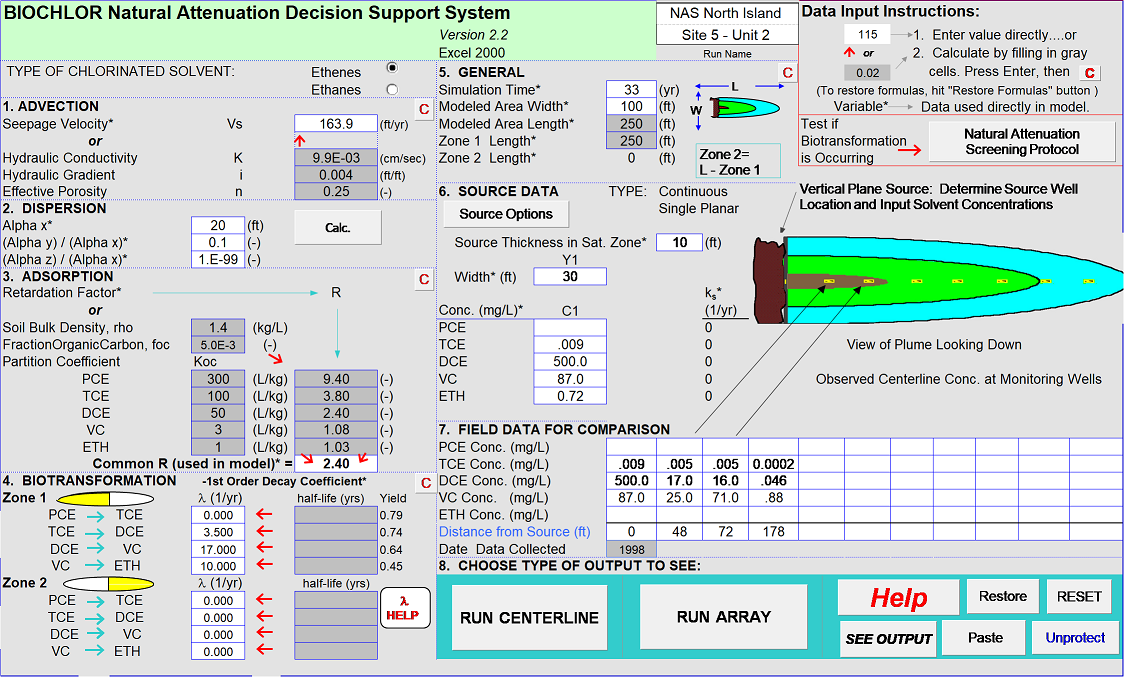
458 KB | Debra Tabron | Figure 3. The data input screen for BIOCHLOR before remediation with cis-1,2-Dichloroethene (DCE) and vinyl chloride (VC) source concentrations of 500 and 87 mg/L respectively at the source when the release first occurred | 1 |
| 16:06, 9 January 2020 | Wilson1w2Fig2.png (file) |  |
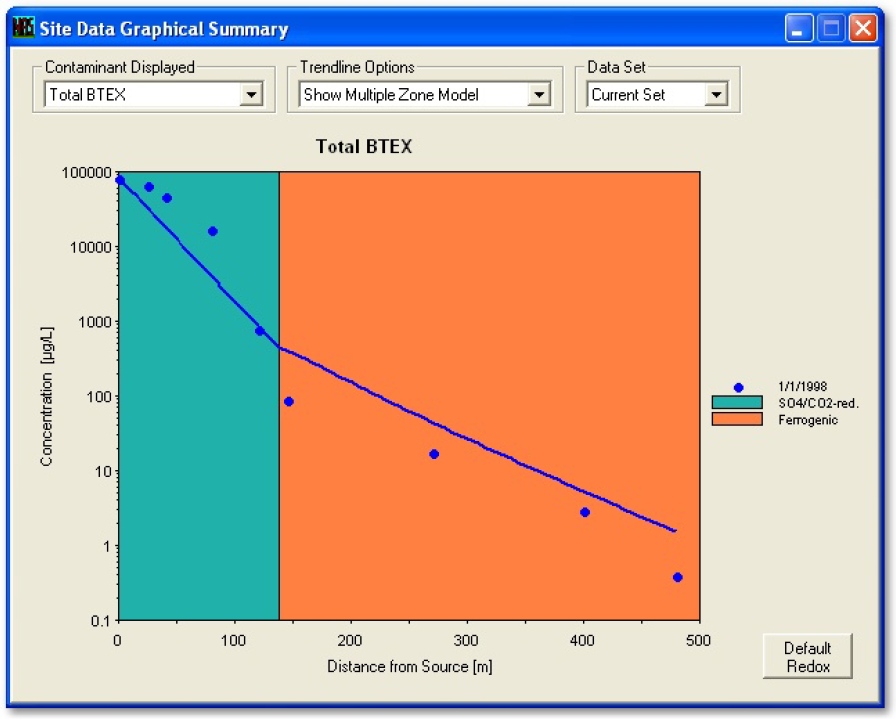
237 KB | Debra Tabron | Figure 2. Example calibration of NAS to natural attenuation of total BTEX at a site (Figure 17 of NAS User’s Manual). | 1 |
| 16:00, 9 January 2020 | Wilson1w2Fig1.png (file) |  |
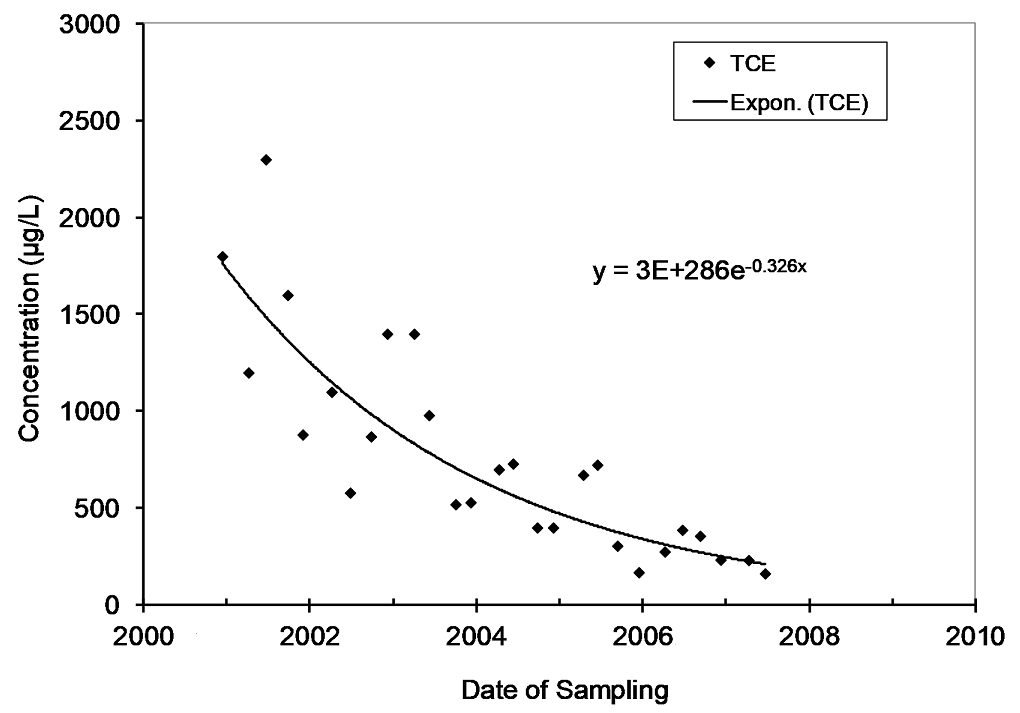
55 KB | Debra Tabron | Figure 1. Attenuation of Trichloroethene (TCE) over time in a monitoring well at a site in Michigan. The concentration vs. time rate constant is 0.326 per year and largely represents the rate of the attenuation of the source of contaminants in the aq... | 1 |
| 15:55, 9 January 2020 | Yuncu1w2Benzene.png (file) |  |
20 KB | Jhurley | 1 | |
| 10:02, 27 December 2019 | Schwartz 2014 NCA3 Chap 05 Transportation.pdf (file) | 4.68 MB | Jhurley | 1 | ||
| 09:40, 27 December 2019 | Bjornas 2015 A guide to RCPs.pdf (file) | 129 KB | Jhurley | 1 | ||
| 16:10, 26 December 2019 | Kotamarthi1w2Fig4.png (file) |  |
77 KB | Jhurley | 2 | |
| 16:17, 19 December 2019 | Kotamarthi1w2Fig5.png (file) |  |
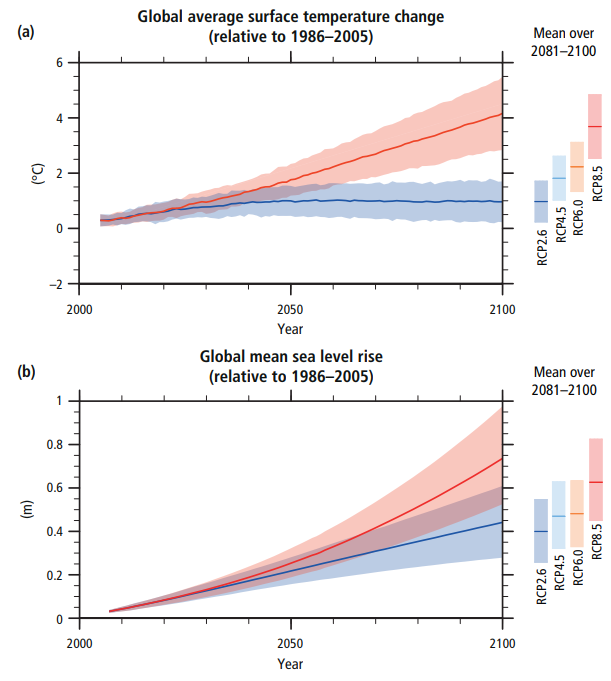
83 KB | Debra Tabron | Figure 5- (a) Global average near-surface air temperature; and (b) mean sea level rise projections <ref name = "IPCC2014B"/>. | 1 |
| 16:02, 19 December 2019 | Kotamarthi1w2Fig3.png (file) |  |
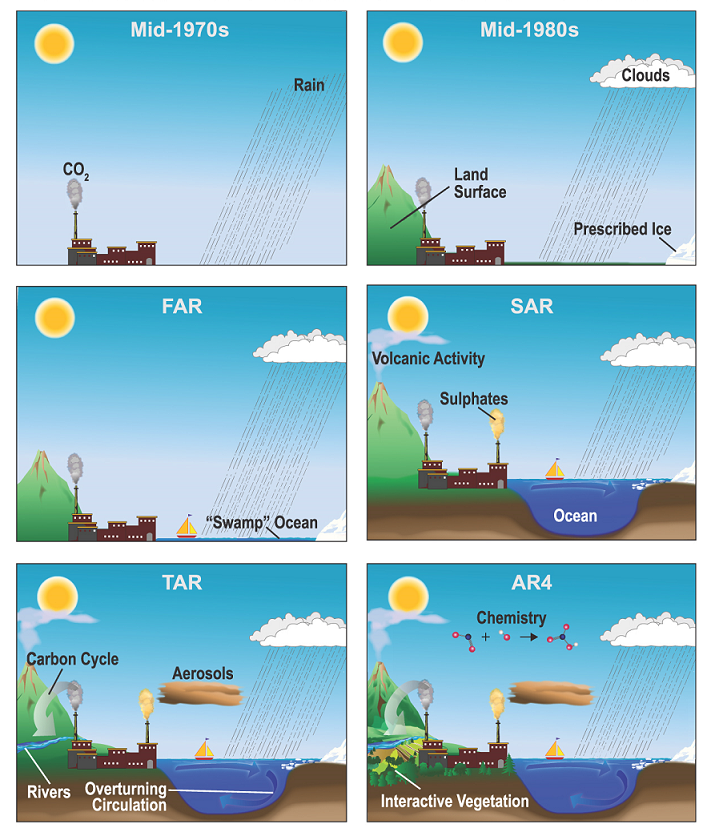
748 KB | Debra Tabron | Figure 3: Evolution of climate models over the past 50 years (IPCC, 2013) <ref name= "IPCC2013"> IPCC, 2013. Climate Change 2013: The Physical Science Basis. Contribution of Working Group I to the Fifth Assessment Report of the Intergovernmental Panel... | 1 |
| 15:56, 19 December 2019 | Kotamarthi1w2Fig2.png (file) |  |
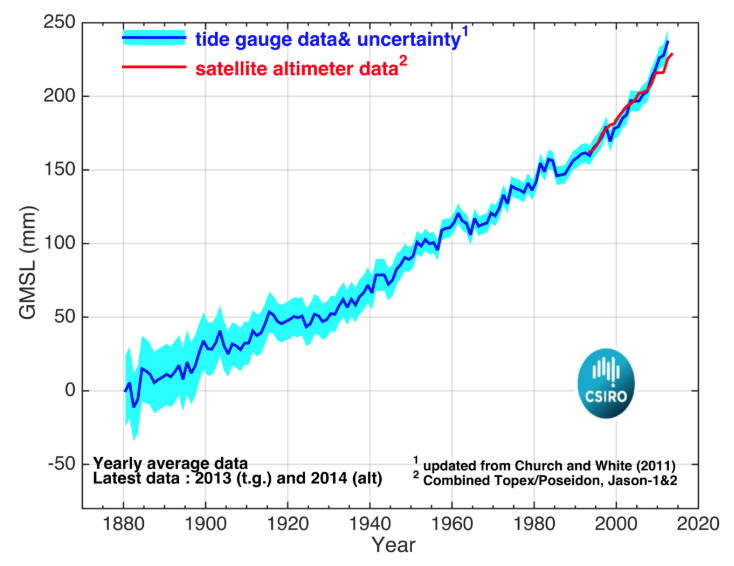
109 KB | Debra Tabron | Figure 2. Changes in global mean sea-level (GMSL) from 1880 to present. Source: [https://research.csiro.au/slrwavescoast/sea-level/ Global Mean Sea Level (GMSL) – 1880 to the end of 2014] | 1 |
| 15:55, 19 December 2019 | Kotamarthi1w2Fig1.png (file) |  |
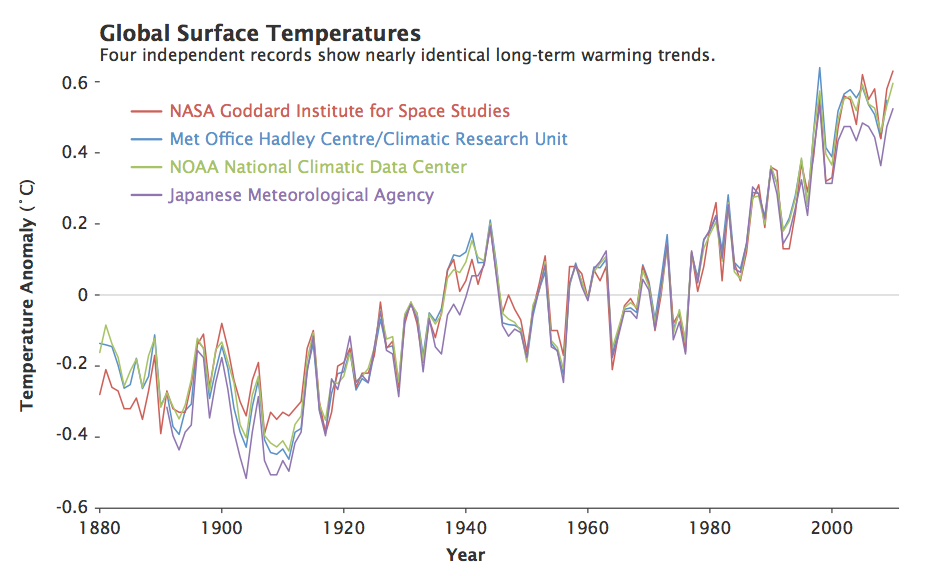
133 KB | Debra Tabron | Figure 1: Global surface temperature anomalies for the past 100+ years compared to the 1961-1990 average. Source | 1 |
| 10:48, 19 December 2019 | 2017-USGCRP-Climate Science Special Report Fourth National Climate Assessment, Vol 1..pdf (file) | 27.81 MB | Debra Tabron | U.S. Global Change Research Program (USGCRP), 2017. Climate Science Special Report: Fourth National Climate Assessment, Volume I (Wuebbles, D. J., D.W. Fahey, K.A. Hubbard, D.J. Dokkeb, B.C. Stewart and T.K. Maycock(eds)). U.S. Global Change Research P... | 1 | |
| 10:33, 19 December 2019 | 2012-Taylor-An overview of CMIP5 and the experiment design.pdf (file) | 1.83 MB | Debra Tabron | Taylor, K.E., R.J. Stouffer, G.A. Meehl, 2012. An overview of CMIP5 and the experiment design. Bulletin of the American Meteorological Society, vol. 93, pp. 485-498. doi:10.1175/BAMS-D-11-00094.1 | 1 | |
| 09:53, 19 December 2019 | 2012-Parris-Global sea level rise scenarios for the US National Climate Assessment.pdf (file) | 5.61 MB | Debra Tabron | Parris, A., P. Bromirski, V. Burkett, D. Cayan, M. Culver, J. Hall, R. Horton, K. Knuuti, R. Moss, J. Obeysekera, A. Sallenger, and J. Weiss. 2012. Global sea level rise scenarios for the US National Climate Assessment. NOAA Tech Memo OAR CPO-1. 37 pp. | 1 | |
| 08:57, 19 December 2019 | 2010-NIH-HealthEffectsOfClimateChange(NIEHS).pdf (file) | 268 KB | Debra Tabron | National Institutes of Health (NIH), 2010. Fact Sheet – Health Effects of Climate Change | 1 | |
| 17:06, 18 December 2019 | 2014b-IPCC-Climate Change Synthesis rReport-Fifth Assessment.pdf (file) | 13.87 MB | Debra Tabron | IPCC, 2014b: Climate Change 2014: Synthesis report. Contribution of working groups I, II and III to the Fifth Assessment Report of the Intergovernmental Panel on Climate Change (Core Writing Team, R.K. Pachauri and L.A. Meyer (eds.)). IPCC, Geneva, Swi... | 1 | |
| 16:51, 18 December 2019 | 2014a-climate change - Impacts, Adaptation, and vulnerability. Part A. global and Sectoral Aspects.pdf (file) | 96.09 MB | Debra Tabron | IPCC, 2014a. Climate Change 2014: Impacts, Adaptation, and Vulnerability. Part A: Global and Sectoral Aspects. Contribution of Working Group II to the Fifth Assessment Report of the Intergovernmental Panel on Climate Change [Field, C.B., V.R. Barros, D... | 1 | |
| 16:37, 18 December 2019 | 2013-IPCC-Climate Change-The Physical science basis.pdf (file) | 49.79 MB | Debra Tabron | They Physical science basis | 1 | |
| 16:27, 18 December 2019 | 2007-IPCC-Climate change synthesis report.pdf (file) | 6.22 MB | Debra Tabron | IPCC, 2007. Climate Change 2007: Synthesis report. Contribution of working groups I, II and III to the Fourth Assessment Report of the Intergovernmental Panel on Climate Change (Core Writing Team, Pachauri, R.K and Reisinger, A. (eds.)). IPCC, Geneva,... | 1 | |
| 16:10, 18 December 2019 | 2001-IPCC-Climate Change Synthesis Report - Third Assessment.pdf (file) | 14.76 MB | Debra Tabron | IPCC, 2001. Climate Change 2001: Synthesis report. Contribution of working groups I, II, and III to the Third Assessment Report of the Intergovernmental Panel on Climate Change. Watson, R.T. ed. Cambridge University Press, Cambridge UK and New York USA... | 1 | |
| 16:01, 18 December 2019 | 1995-IPCC-2nd Assessment Report.pdf (file) | 596 KB | Debra Tabron | IPCC, 1995. Climate Change 1995: IPCC Second Assessment Report. 73p | 1 | |
| 15:19, 18 December 2019 | 1992-IPCC-Climate Change Assessment Report.pdf (file) | 14.51 MB | Debra Tabron | Intergovernmental Panel on Climate Change (IPCC), 1992. Climate Change: The IPCC 1990 and 1992 Assessments. 180p. ISBN : 0-662-19821-2 | 1 | |
| 14:52, 18 December 2019 | 2016-Eyring-Overview of the Coupled Model Intercomparison Project Phase 6.pdf (file) | 1.38 MB | Debra Tabron | Eyring, V., Bony, S., Meehl, G. A., Senior, C. A., Stevens, B., Stouffer, R. J., and Taylor, K. E. , 2016. Overview of the Coupled Model Intercomparison Project Phase 6 (CMIP6) experimental design and organization, Geosci. Model Dev., 9, 1937–1958.... | 1 | |
| 14:22, 18 December 2019 | 2019-Bevis-Accelerationg changes in ice mass within Greenland.pdf (file) | 2.12 MB | Debra Tabron | Bevis, M., Harig, C., Khan, S.A., Brown, A., Simons, F.J., Willis, M., Fettweis, X., Van Den Broeke, M.R., Madsen, F.B., Kendrick, E. and Caccamise, D.J., 2019. Accelerating changes in ice mass within Greenland, and the ice sheet’s sensitivity to atm... | 1 | |
| 14:10, 18 December 2019 | 1896-Arrhenius. On the Influence of Carbonic Acid.....pdf (file) | 4.31 MB | Debra Tabron | Arrhenius S., 1896. On the Influence of Carbonic Acid in the Air upon the Temperature of the Ground. Philosophical Magazine and Journal of Science, Series 5, vol. 41, pp. 237–276. | 1 | |
| 15:47, 12 December 2019 | Ghosh1w2Fig2.png (file) |  |
763 KB | Jhurley | 2 | |
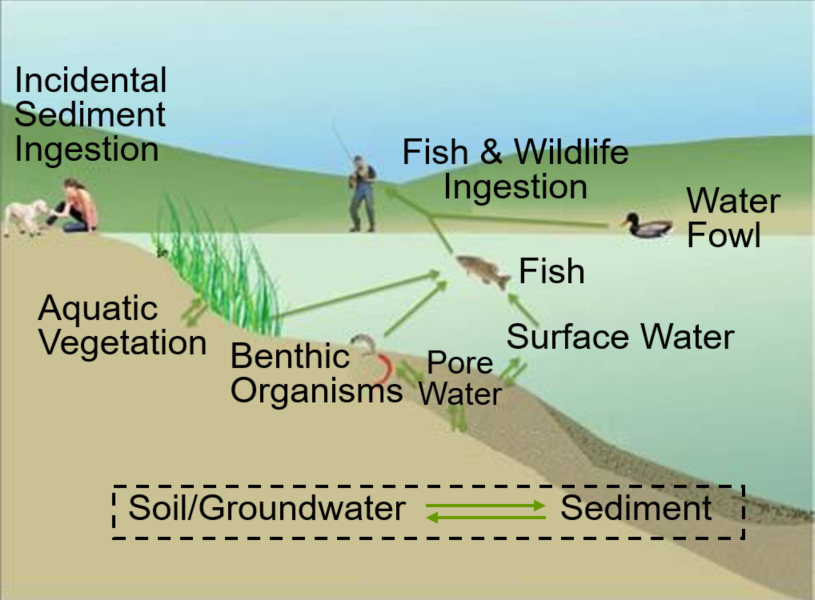
| 15:46, 12 December 2019 | Ghosh1w2Fig1.png (file) |  |
349 KB | Jhurley | 2 | |
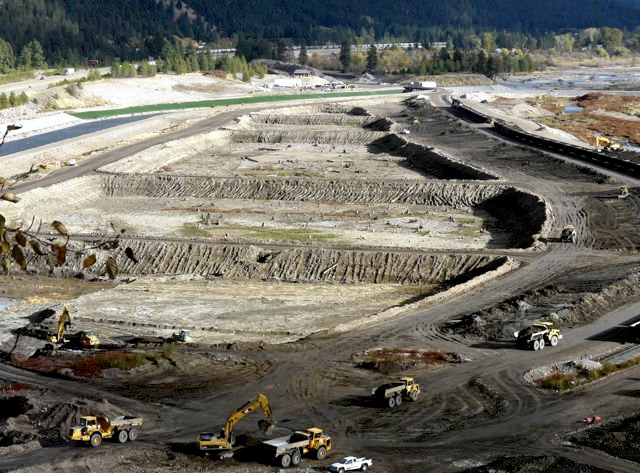
| 16:50, 25 November 2019 | Ghosh1w2Fig3.png (file) |  |
735 KB | Debra Tabron | Figure 3. Sediment removal being conducted at the Milltown Reservoir Sediments Superfund Site in Missoula County, Montana. | 1 |
| 11:18, 25 November 2019 | 2017-USEPA-Contaminated Sediment Remediation Guidance for Hazardous Waste Sites.pdf (file) | 5.76 MB | Debra Tabron | USEPA, 2017. Remediating Contaminated Sediment Sites - Clarification of Several Key Remedial Investigation/Feasibility Study and Risk Management Recommendations, and Updated Contaminated Sediment Technical Advisory Group Operating Procedures. OLEM Dire... | 1 | |
| 11:10, 25 November 2019 | 2005-USEPA-Contaminated Sediment Remediation Guidance for Hazardous Waste Sites.pdf (file) | 2.98 MB | Debra Tabron | USEPA, 2005. Contaminated Sediment Remediation Guidance for Hazardous Waste Sites. EPA-540-R-05-012. OSWER 9355.0-85. | 1 | |
| 10:55, 25 November 2019 | 2002-USEPA- Principles for Managing Contaminated Sediment Risks at Hazardous Waste Sites.pdf (file) | 733 KB | Debra Tabron | USEPA, 2002. Principles for Managing Contaminated Sediment Risks at Hazardous Waste Sites. OSWER Directive 9285.6–08. | 1 | |
| 16:40, 22 November 2019 | 1998-USEPA-EPA Contaminated Sediment Mgmt Strategy.pdf (file) | 6.31 MB | Debra Tabron | USEPA, 1998. EPA’s Contaminated Sediment Management Strategy. EPA-823-R-98-001. | 1 | |
| 16:29, 22 November 2019 | 2019-SERDP ESTCP-Managing Contaminated Sediments.pdf (file) | 210 KB | Debra Tabron | SERDP/ESTCP Managing Contaminated Sediments, accessed 29 August 2019. | 1 | |
| 16:12, 22 November 2019 | 2011-ITRC incorporating bioavailability Considerations into the Evaluation of Contaminated Sediment Sites.pdf (file) | 5.53 MB | Debra Tabron | ITRC, 2011. Incorporating Bioavailability Considerations into the Evaluation of Contaminated Sediment Sites, accessed 29 August 2019 | 1 | |
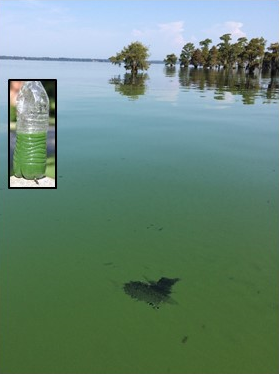
| 17:14, 18 November 2019 | 2016-Olson-Evaluating the effectiveness of water remediation techniques.pdf (file) | 491 KB | Debra Tabron | Olson, I., 2016. Evaluating the effectiveness of water remediation techniques for nutrient reduction and the control of cyanobacteria blooms in municipal drinking water reservoirs in the SE United States. | 1 | |
| 10:05, 14 November 2019 | Beckley1w2 Fig3a.png (file) |  |
260 KB | Jhurley | 1 | |
| 16:07, 13 November 2019 | 1999-Bricker-National Estuarine Eutrophication Assessment.pdf (file) | 3.61 MB | Debra Tabron | Bricker, S.B., Clement, C.G., Pirhalla, D.E., Orlando, S.P., Farrow, D.R.G. 1999. National Estuarine Eutrophication Assessment: Effects of nutrient enrichment in the Nation’s estuaries. Silver Spring: NOAA, National Ocean Service, Special Projects Of... | 1 | |
| 15:16, 13 November 2019 | Falta1w2 Fig7.png (file) |  |
289 KB | Jhurley | 1 | |
| 12:01, 13 November 2019 | Hall1w2Fig3.png (file) |  |
443 KB | Debra Tabron | Figure 3. Diagram showing the eutrophication process. | 1 |
| 12:00, 13 November 2019 | Hall1w2Fig2.png (file) |  |
109 KB | Debra Tabron | Figure 1. Phytoplankton come in many shapes and sizes | 1 |
| 11:59, 13 November 2019 | Hall1w2Fig1.png (file) |  |
901 KB | Debra Tabron | Figure 1. Phytoplankton come in many shapes and sizes | 1 |
| 16:57, 11 November 2019 | Falta1w2 Fig7.mp4 (file) | 39.59 MB | Debra Tabron | Figure 7: Video tutorial demonstrating use of REMChlor-MD. | 1 | |
| 14:11, 5 November 2019 | Falta1w2 Fig2.PNG (file) |  |
261 KB | Debra Tabron | 1 | |
| 11:50, 5 November 2019 | Falta1w2 Fig6.png (file) |  |
156 KB | Debra Tabron | Figure 6: Top view (''xy'') of concentration contours computed with the fine-grid numerical model (top) and with REMChlor-MD (bottom) at 130 years. | 1 |
| 11:47, 5 November 2019 | Falta1w2 Fig5.png (file) |  |
171 KB | Debra Tabron | Figure 5: Top view (xy) of concentration contours computed with the fine-grid numerical model (top) and with REMChlor-MD (bottom) at 30 years. | 1 |
| 11:45, 5 November 2019 | Falta1w2 Fig4.png (file) |  |
57 KB | Debra Tabron | Figure 4: Simulated mass discharge at downstream edge of fine-grid MT3DMS and REMChlore-MDmodels. | 1 |
| 11:44, 5 November 2019 | Falta1w2 Fig3.png (file) |  |
68 KB | Debra Tabron | Figure 3: Concentration profiles in fractures at 1, 49, 51 and 100 years. | 1 |
| 11:42, 5 November 2019 | Falta1w2 Fig2.png (file) |  |
927 KB | Debra Tabron | Figure 2: A typical fine grid model capable of simulating matrix diffusion. | 1 |