File:Bekins1w2 Fig3.PNG
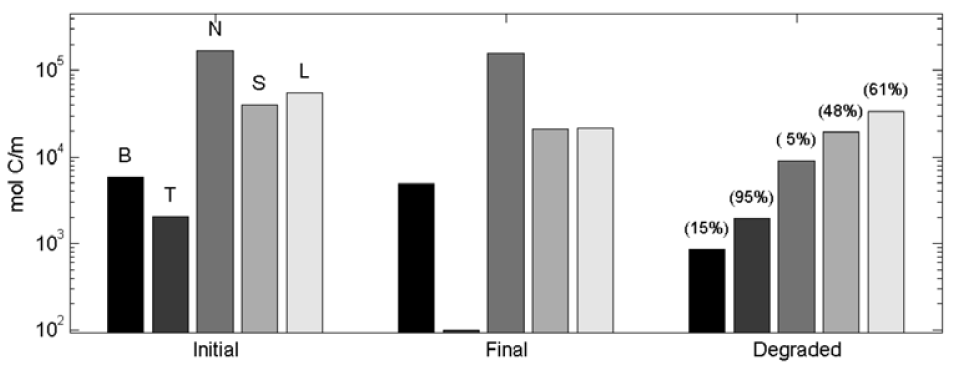
Revision as of 17:47, 13 June 2019 by Debra Tabron (talk | contribs) (Figure 3. Concentrations integrated over 2D cross-sectional area for modeled five oil phase components (B: BEX, T: toluene, N: NVDOC, S: short chain n-alkanes, L: long chain n-alkanes), at the initial time of the spill, at the final simulation time (10...)
Size of this preview: 800 × 309 pixels. Other resolutions: 320 × 124 pixels | 958 × 370 pixels.
Original file (958 × 370 pixels, file size: 37 KB, MIME type: image/png)
Summary
Figure 3. Concentrations integrated over 2D cross-sectional area for modeled five oil phase components (B: BEX, T: toluene, N: NVDOC, S: short chain n-alkanes, L: long chain n-alkanes), at the initial time of the spill, at the final simulation time (10,000 days), and for the degraded amount over the simulation period. For each component, the percentage of its initial amount that is degraded at the end of the simulation period is printed in parentheses. Figure reprinted from Ng et al. 2015.
File history
Click on a date/time to view the file as it appeared at that time.
| Date/Time | Thumbnail | Dimensions | User | Comment | |
|---|---|---|---|---|---|
| current | 17:47, 13 June 2019 | 958 × 370 (37 KB) | Debra Tabron (talk | contribs) | Figure 3. Concentrations integrated over 2D cross-sectional area for modeled five oil phase components (B: BEX, T: toluene, N: NVDOC, S: short chain n-alkanes, L: long chain n-alkanes), at the initial time of the spill, at the final simulation time (10... |
- You cannot overwrite this file.
File usage
The following page links to this file: