File:Slater-Article 2-Figure 1.PNG
Revision as of 19:15, 31 January 2017 by Debra Tabron (talk | contribs) (Figure 1. Resistivity imaging at the 300 Area of the Hanford Facility, Richland, WA. (a) location of 2D resistivity survey lines. (b) selected 2D resistivity profiles (locations in part a) showing imaging of variations in depth to the Hanford-Ringold c...)

Size of this preview: 800 × 384 pixels. Other resolutions: 320 × 154 pixels | 890 × 427 pixels.
Original file (890 × 427 pixels, file size: 630 KB, MIME type: image/png)
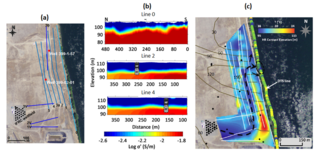
Figure 1. Resistivity imaging at the 300 Area of the Hanford Facility, Richland, WA. (a) location of 2D resistivity survey lines. (b) selected 2D resistivity profiles (locations in part a) showing imaging of variations in depth to the Hanford-Ringold contact. (c) Map view of depth to the Hanford-Ringold contact estimated from the electrical resistivity data, showing evidence of a paleochannel controlling groundwater discharge into the river (modified from Mwakanyamale et al. (2012)
File history
Click on a date/time to view the file as it appeared at that time.
| Date/Time | Thumbnail | Dimensions | User | Comment | |
|---|---|---|---|---|---|
| current | 19:15, 31 January 2017 | | 890 × 427 (630 KB) | Debra Tabron (talk | contribs) | Figure 1. Resistivity imaging at the 300 Area of the Hanford Facility, Richland, WA. (a) location of 2D resistivity survey lines. (b) selected 2D resistivity profiles (locations in part a) showing imaging of variations in depth to the Hanford-Ringold c... |
- You cannot overwrite this file.
File usage
The following page links to this file: