Difference between revisions of "File:Wilson1w2Fig1.png"
Debra Tabron (talk | contribs) (Figure 1. Attenuation of Trichloroethene (TCE) over time in a monitoring well at a site in Michigan. The concentration vs. time rate constant is 0.326 per year and largely represents the rate of the attenuation of the source of contaminants in the aq...) |
(No difference)
|
Latest revision as of 21:00, 9 January 2020
Summary
Figure 1. Attenuation of Trichloroethene (TCE) over time in a monitoring well at a site in Michigan. The concentration vs. time rate constant is 0.326 per year and largely represents the rate of the attenuation of the source of contaminants in the aquifer.
File history
Click on a date/time to view the file as it appeared at that time.
| Date/Time | Thumbnail | Dimensions | User | Comment | |
|---|---|---|---|---|---|
| current | 21:00, 9 January 2020 | 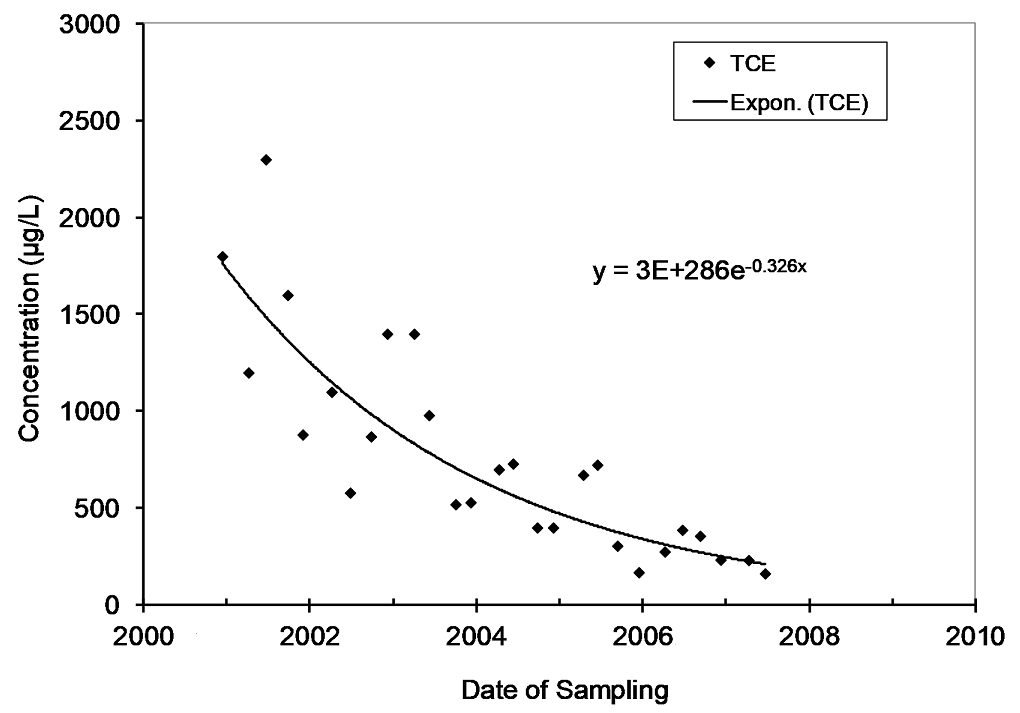 | 1,020 × 713 (55 KB) | Debra Tabron (talk | contribs) | Figure 1. Attenuation of Trichloroethene (TCE) over time in a monitoring well at a site in Michigan. The concentration vs. time rate constant is 0.326 per year and largely represents the rate of the attenuation of the source of contaminants in the aq... |
- You cannot overwrite this file.
File usage
The following page links to this file: