File list
This special page shows all uploaded files.
| Date | Name | Thumbnail | Size | Description | Versions |
|---|---|---|---|---|---|
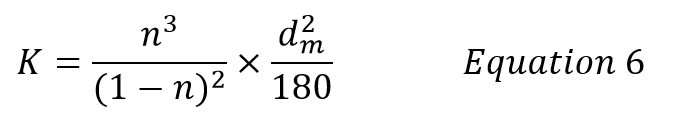
| 18:08, 5 March 2019 | Liu1w2 Eq6.png (file) | 6 KB | 1 | ||
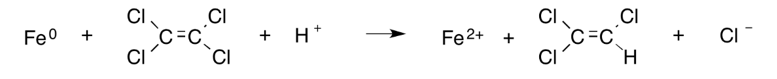
| 18:33, 16 October 2015 | Hexachloroethane.png (file) |  |
6 KB | 1 | |
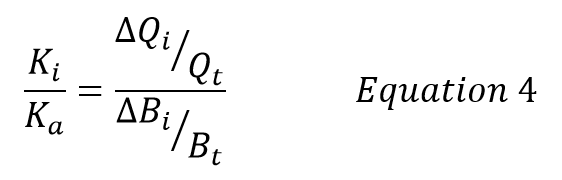
| 18:05, 5 March 2019 | Liu1w2 Eq4.png (file) |  |
7 KB | 1 | |
| 13:38, 11 November 2016 | No Author-Article 1-Table 1.PNG (file) |  |
7 KB | Table 1. Median lethal concentration of NTO to Ceriodaphnia (mg/L) | 1 |
| 21:42, 18 February 2019 | Allen-King1w2 Eq5.png (file) | 8 KB | 1 | ||
| 15:16, 18 November 2016 | Salter-Blanc-Contaminants Treated-Equation 5.PNG (file) | 8 KB | 1 | ||
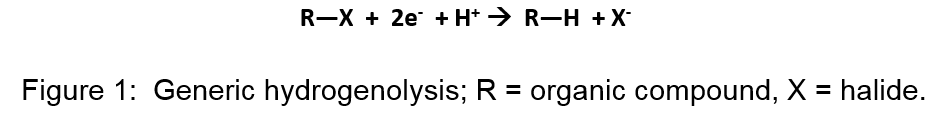
| 15:07, 19 January 2017 | Freedman Article 1 Figure 1.PNG (file) | 8 KB | Figure 1. Generic hydrogenolysis; R = organic compound, X = halide. | 1 | |
| 18:25, 16 October 2015 | 1,1,2-Trichloroethane.png (file) |  |
8 KB | 1 | |
| 15:15, 18 November 2016 | Salter-Blanc-Contaminants Treated-Equation 4.PNG (file) | 9 KB | 1 | ||
| 20:37, 27 April 2020 | Beal1w2 Fig8.png (file) |  |
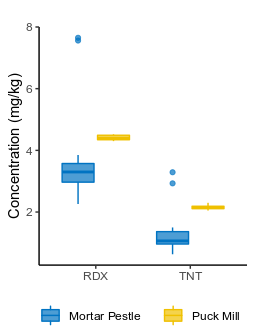
9 KB | Figure 8: Effect of machine grinding on RDX and TNT concentration and precision in soil from a hand grenade range. Data from Walsh et al. | 1 |
| 14:35, 16 May 2016 | Wilson 3 Fig4.png (file) |  |
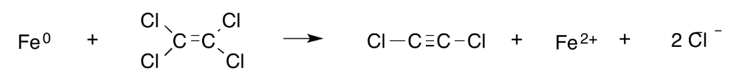
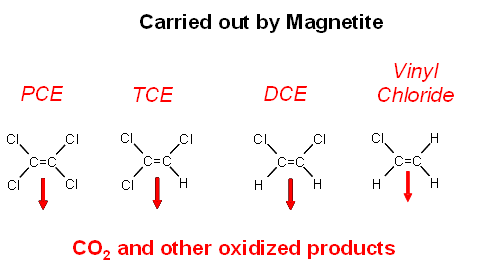
9 KB | Figure 4. Degradation of chlorinated alkenes carried out by magnetite | 2 |
| 21:11, 26 August 2016 | McCall Article 3 Figure 2.PNG (file) |  |
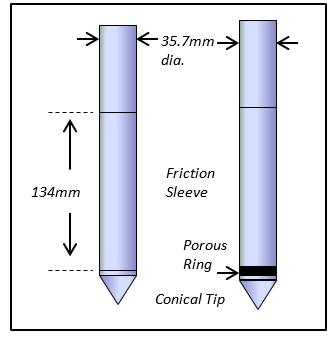
10 KB | Figure 2: A CPT cone (left) and piezocone (right) with porous ring. | 1 |
| 15:39, 19 January 2017 | Freedman Article 1 Figure 4.PNG (file) |  |
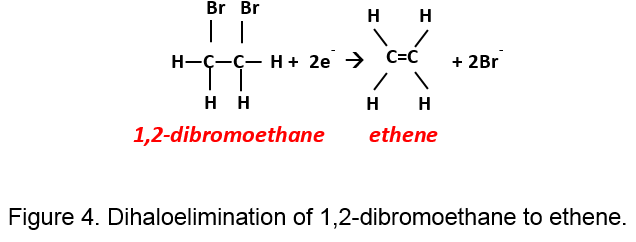
10 KB | Figure 4. Dihaloelimination of 1,2-dibromoethane to ethene. | 1 |
| 20:38, 27 April 2020 | Beal1w2 Fig9.png (file) |  |
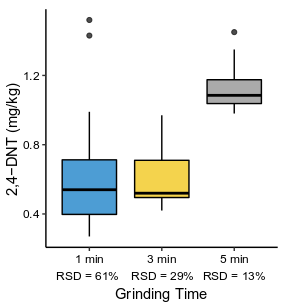
10 KB | Figure 9: Effect of puck milling time on 2,4-DNT concentration and precision in soil from a firing point. Data from Walsh et al. | 1 |
| 15:18, 18 November 2016 | Salter-Blanc-Contaminants Treated-Equation 7.PNG (file) | 11 KB | 1 | ||
| 14:13, 7 September 2016 | Newell-Article 1-Equation 2r.jpg (file) | 11 KB | Chuck Newell- Article 2 - Equation 2 | 1 | |
| 14:42, 7 September 2016 | Newell-Article 1-Equation 1rr.jpg (file) | 11 KB | Newell-Article 1-Equation 1 | 1 | |
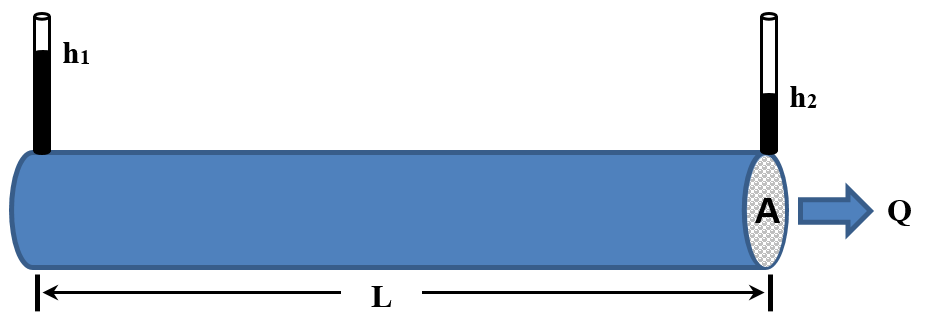
| 18:09, 5 March 2019 | Liu1w2 Fig1.png (file) |  |
12 KB | Figure 1. Schematic of Darcy’s Law flow experiment. | 1 |
| 14:09, 7 September 2016 | Newell-Article 1-Equation 1r.jpg (file) | 12 KB | Chuck Newell - Article 1 - Equation 1 | 1 | |
| 18:46, 15 September 2016 | Gerhard Equation 1.JPG (file) | 12 KB | Figure 1. Smoldering charcoal example of a flameless, self-sustaining combustion reaction. | 2 | |
| 14:48, 16 May 2016 | Wilson 3 Fig1.png (file) |  |
12 KB | Figure 1. Degradation of chlorinated alkenes | 1 |
| 20:30, 11 August 2016 | McCall-Article 1-Figure 4.PNG (file) |  |
13 KB | Figure 4: Bottom-up tremie grouting through a tool string. | 1 |
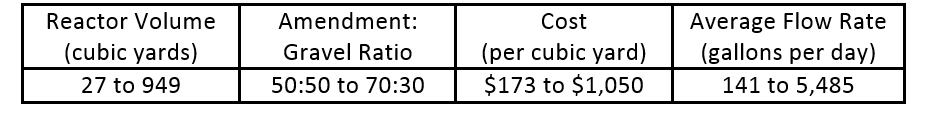
| 21:54, 1 February 2017 | Gamlin SBGR Table 1.PNG (file) | 14 KB | Table 1. SBGR Construction and Cost Details | 1 | |
| 14:57, 29 August 2016 | McCall Article 3 Figure 10.PNG (file) |  |
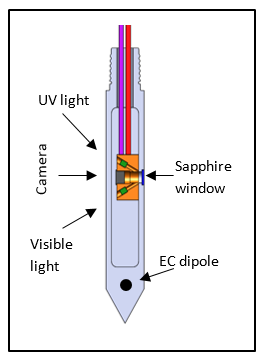
14 KB | Figure 10: Schematic of the OIP Probe. | 1 |
| 18:42, 9 November 2018 | Kamath1w2 Fig5.png (file) |  |
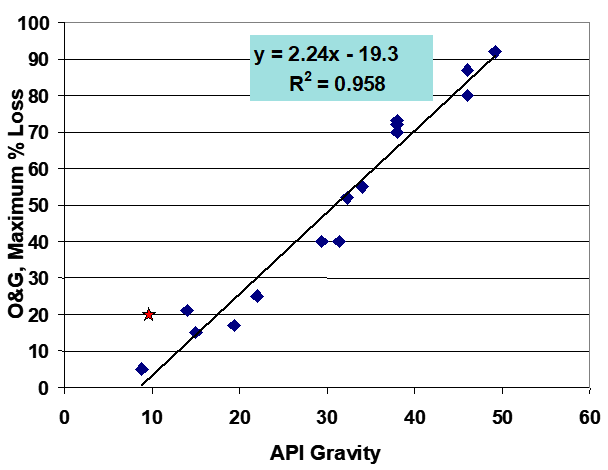
15 KB | Figure 5. Correlation between API gravity (specific weight of the crude) and the predicted extent of biodegradation as measured by oil and grease (O&G) (McMillen et al., 2004[5]) | 1 |
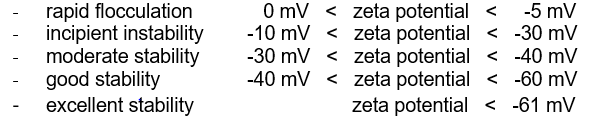
| 20:57, 13 November 2018 | Rules of thumb for negatively charged emulsions.PNG (file) | 15 KB | - rapid flocculation 0 mV < zeta potential < -5 mV - incipient instability -10 mV < zeta potential < -30 mV - moderate stability -30 mV < zeta potential < -40 mV - good stability -40 mV < zeta potential < -60 m... | 1 | |
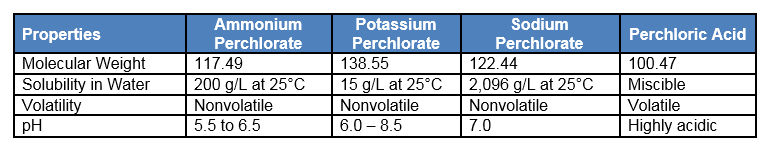
| 14:35, 13 October 2016 | Krug-Article 1. Table1 perchlorate rev.PNG (file) | 15 KB | Table 1. Perchlorate Physical and Chemical Properties | 1 | |
| 19:14, 17 October 2018 | Borden2w2Fig6.png (file) |  |
16 KB | Figure 6. Fraction of H2CO3 not ionized (α) versus pH. | 1 |
| 21:39, 18 February 2019 | Allen-King1w2 Eq3.png (file) | 18 KB | 1 | ||
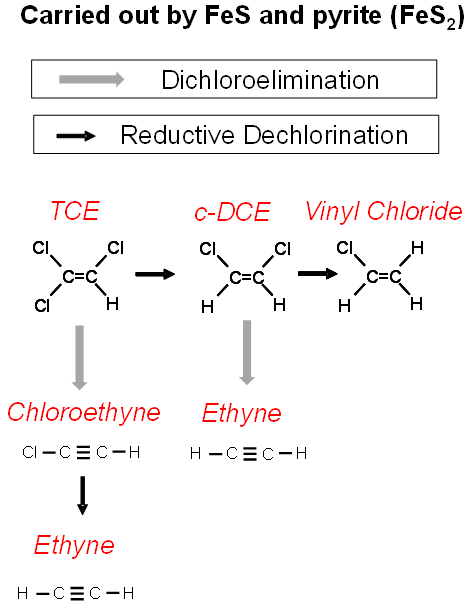
| 14:10, 16 May 2016 | Wilson 3 Fig3.png (file) |  |
18 KB | Carried out by FeS and Pyrite | 1 |
| 17:23, 11 February 2019 | Hatzinger1w2 Fig1.png (file) |  |
19 KB | Figure 1. NDMA chemical structure | 1 |
| 19:07, 17 October 2018 | Borden2w2Fig2.png (file) |  |
20 KB | Figure 2. Cumulative frequency distribution of groundwater pH measurements at site in eastern North Carolina where soil pH is approximately 5. | 1 |
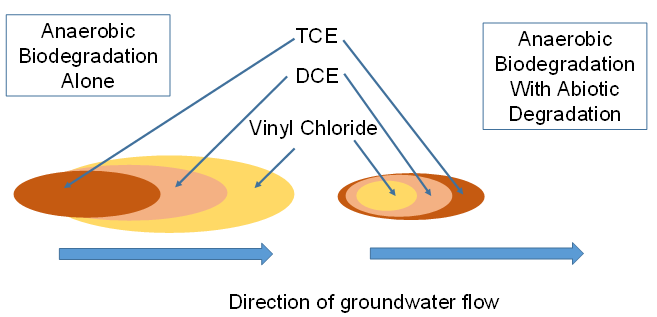
| 14:27, 16 May 2016 | Wilson 3 Fig5.png (file) |  |
20 KB | Figure 5. Biodegradation alone vs. biodegradation with abiotic degradaton | 1 |
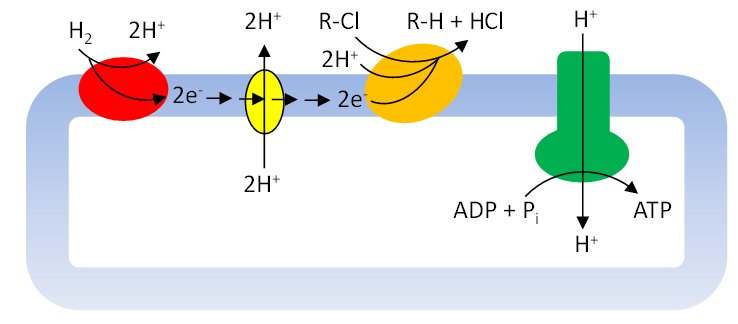
| 15:45, 19 January 2017 | Freedman Article 1 Figure 6.PNG (file) |  |
21 KB | Figure 6. Schematic representation of a microbial cell carrying out organohalide respiration. Blue shape = the cell membrane; red oval = hydrogenase; yellow oval = electron carrier and proton translocation; orange oval = reductive dehalogenase; green s... | 1 |
| 14:53, 29 August 2016 | McCall Article 3 Figure 8.PNG (file) |  |
21 KB | Figure 8: Schematic of MIP depicting principles of operation. | 1 |
| 18:44, 9 November 2018 | Kamath1w2 Fig6b.png (file) |  |
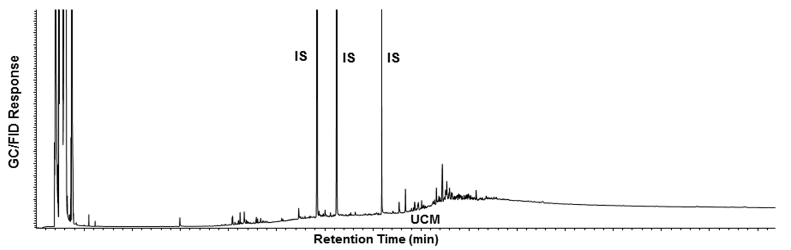
22 KB | Chromatogram of weathered crude oil | 1 |
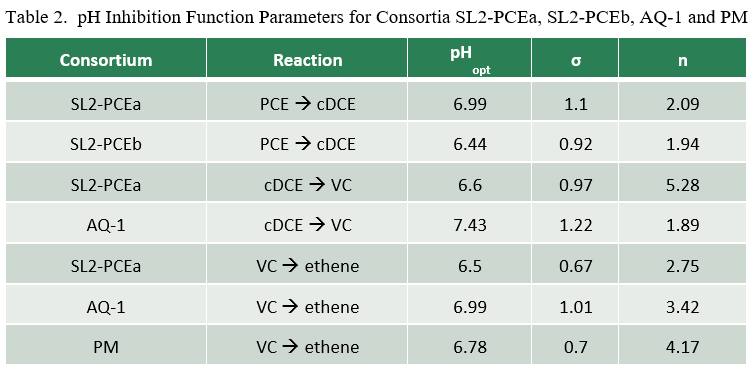
| 15:09, 22 August 2018 | Borden1w2 Table 2.PNG (file) |  |
22 KB | 2 | |
| 14:59, 20 June 2016 | Adamson-Article 2-Table 2-Trade-off.PNG (file) |  |
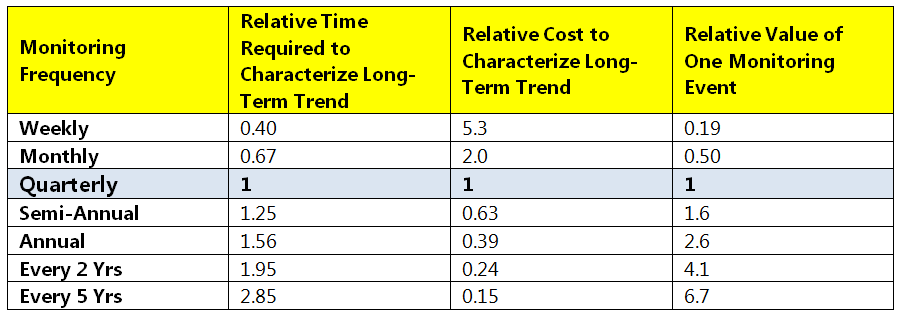
22 KB | Table 2. Trade-Off Between Monitoring Frequency and Monitoring Time | 1 |
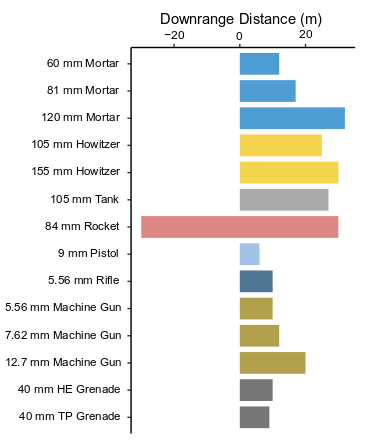
| 20:28, 27 April 2020 | Beal1w2 Fig1.png (file) |  |
23 KB | Figure 1: Downrange distance of visible propellant plume on snow from the firing of different munitions. Note deposition behind firing line for the 84-mm rocket. Data from: Walsh et al. | 1 |
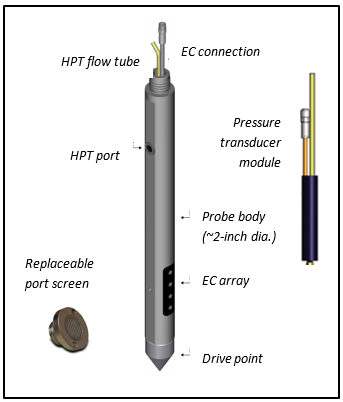
| 14:46, 29 August 2016 | McCall Article 3 Figure 6.PNG (file) |  |
24 KB | Figure 6: Schematic of an HPT probe. | 1 |
| 18:13, 18 August 2016 | McCall Article 2. Figure 6.PNG (file) |  |
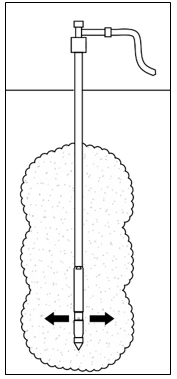
24 KB | Figure 6: Components of a direct push soil gas sampling tool string for active soil gas sampling. | 1 |
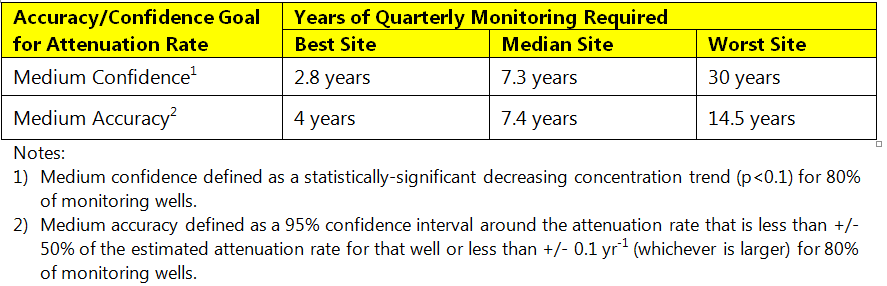
| 14:57, 20 June 2016 | Adamson-Article 2-Table 1.PNG (file) |  |
24 KB | Table 1. Monitoring Data Required to Determine Long-Term Attenuation Rate | 1 |
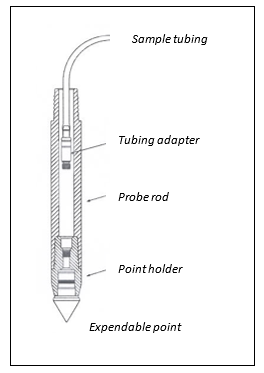
| 18:15, 18 August 2016 | McCall Article 2. Figure 7.PNG (file) |  |
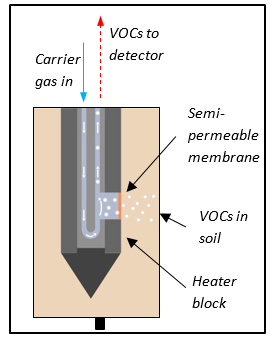
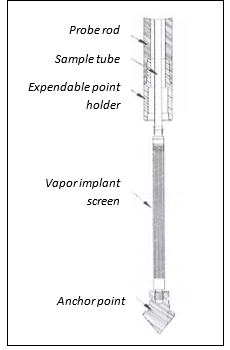
24 KB | Figure 7: Components of a screened implant system for long term monitoring of VOCs in soil gas. | 1 |
| 20:32, 11 August 2016 | McCall-Article 1-Figure 5.PNG (file) |  |
24 KB | Figure 5: Top-down materials injection with a pressure activated probe. | 1 |
| 21:33, 24 February 2016 | OhioEPA-2001-Division of Envl Response and Revitalization fact sheet.pdf (file) | 25 KB | Division of Environmental Response and Revitalization Remedial Response Program Fact Sheet Remediation Using Monitored Natural Attenuation | 1 | |
| 14:44, 16 May 2016 | Wilson 3 Fig2.PNG (file) |  |
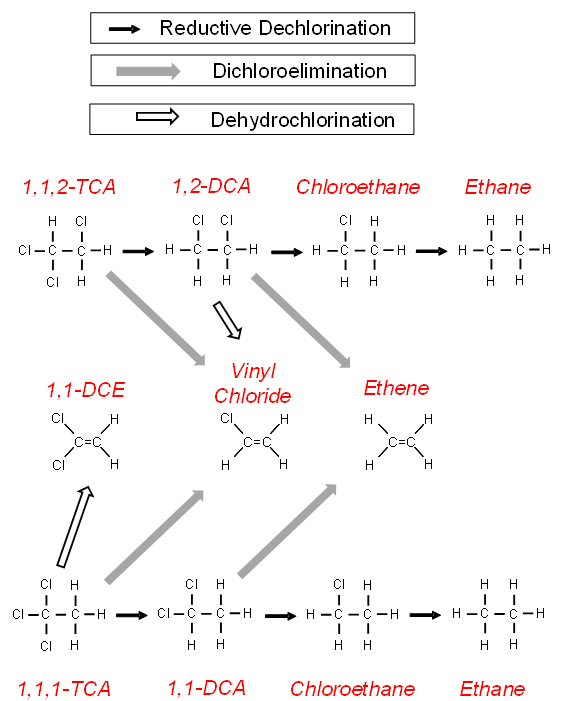
25 KB | Degradation of chlorinated alkanes to ethane | 1 |
| 22:00, 30 January 2019 | Johnson1w2 Fig1.png (file) |  |
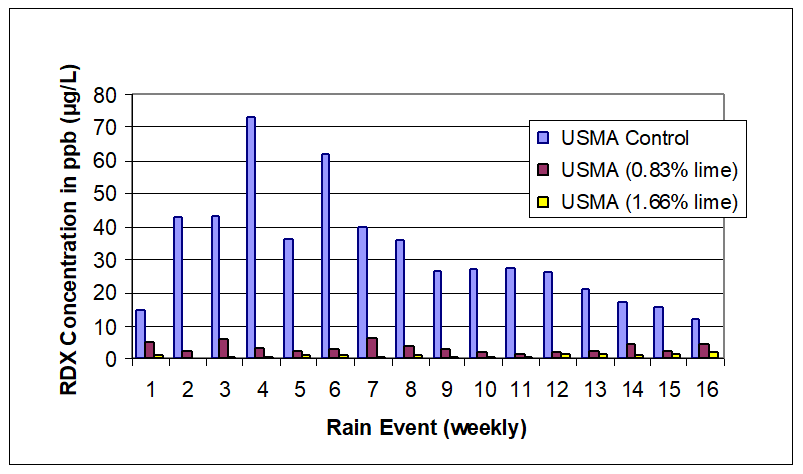
26 KB | Figure 1: RDX concentrations in leachate by rain event for meso-scale lysimeters containing hand grenade range soils as reported by Larson et al. (2007) | 1 |
| 19:22, 11 January 2017 | Dontsova-Article 1-Figure 4.PNG (file) |  |
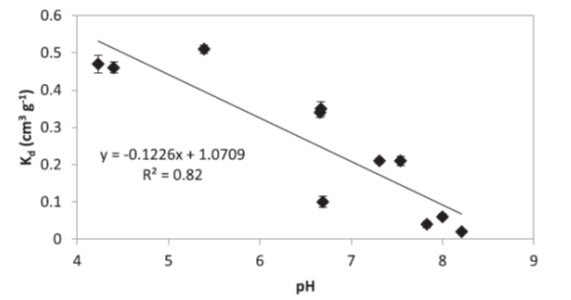
27 KB | Figure 4. Correlation between measured NTO adsorption coefficients | 1 |
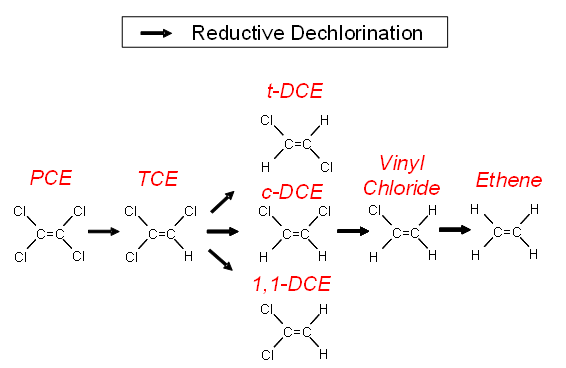
| 15:10, 19 January 2017 | Freedman Article 1 Figure 2.PNG (file) |  |
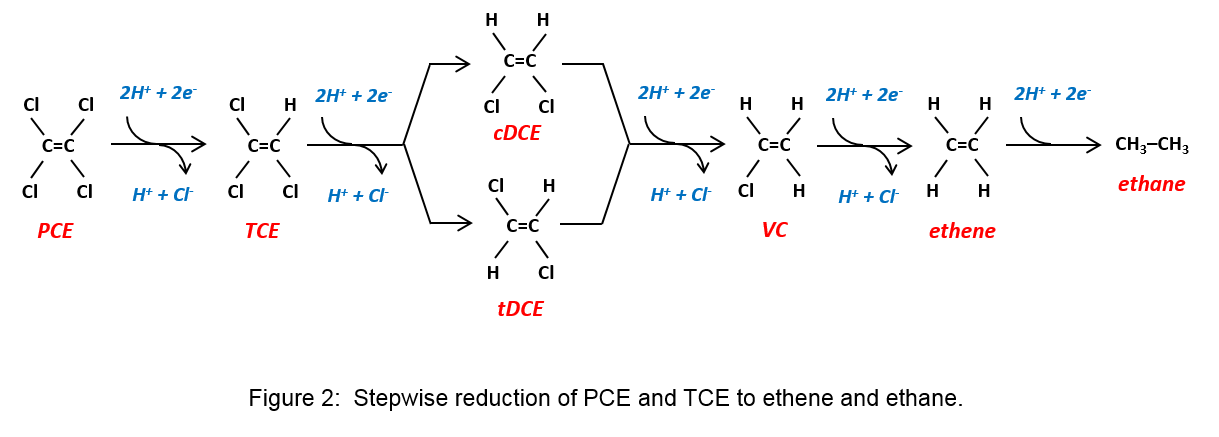
27 KB | Figure 2. Stepwise reduction of PCE and TCE to ethene and ethane | 1 |
| 15:59, 22 August 2018 | Annable1w2Fig4.PNG (file) |  |
27 KB | 2 |