Search results
Page title matches
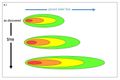
File:Wilson 1 Fig1a.JPG (939 × 625 (135 KB)) - 16:08, 10 May 2016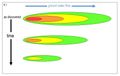
File:Wilson 1 Fig1b.JPG (939 × 594 (130 KB)) - 16:12, 10 May 2016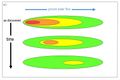
File:Wilson 1 Fig1c.JPG (935 × 626 (146 KB)) - 16:13, 10 May 2016
File:USACE-2002-Soil Vapor Extraction and Bioventing-EM 1110-1-4001.pdf ...002. Engineering and Design: Soil Vapor Extraction and Bioventing. EM 1110-1-4001, U.S. Army Corps of Engineers, Washington, D.C(0 × 0 (3.6 MB)) - 17:50, 11 May 2016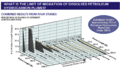
File:Wilson 2 Figure 1. BTEX.PNG Figure 1. Distribution of BTEX plume lengths from 604 hydrocarbon sites (Newell and(870 × 501 (343 KB)) - 18:47, 13 May 2016File:FAQ-ChlorinatedSolvents-ER-200530-1-.pdf (0 × 0 (2.46 MB)) - 19:46, 24 May 2016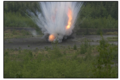
File:Walsh-Article 1-Figure 1.PNG Figure 1. Range ordnance disposal operation. Blow-in-place (BIP) operations often re(940 × 623 (1.13 MB)) - 20:04, 11 November 2016
File:Walsh-Article 1-Figure 2.PNG (1,270 × 438 (678 KB)) - 20:06, 11 November 2016
File:Walsh-Article 1-Figure 3.PNG (1,317 × 467 (1.08 MB)) - 20:06, 11 November 2016
File:Walsh-Article 1-Figure 4.PNG (549 × 516 (570 KB)) - 20:08, 11 November 2016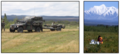
File:Walsh-Article 1-Figure 5.PNG (1,170 × 530 (1.25 MB)) - 20:09, 11 November 2016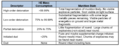
File:Walsh-Article 1-Table 3.PNG (1,150 × 445 (59 KB)) - 20:10, 11 November 2016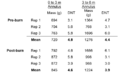
File:Walsh-Article 1-Table 5.PNG (834 × 531 (28 KB)) - 20:12, 11 November 2016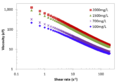
File:Truex 1 Fig1.png Figure 1. Xanthan gum concentration influence on fluid viscosity and rheology for se(910 × 631 (32 KB)) - 20:42, 30 June 2016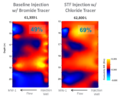
File:Truex 1 Fig2.png (663 × 543 (253 KB)) - 20:46, 30 June 2016File:Haley-2009-Aquatic toxicity of 3-Nitro-1,2,4-triazol-5-one..pdf ...M.V., R.G. Kuperman, and R.T. Checkai. 2009. Aquatic toxicity of 3-nitro-1,2,4-triazol-5-one (NTO). ECBC-TR-726. Edgewood Chemical Biological Center ((0 × 0 (2.53 MB)) - 14:35, 12 July 2016File:USEPA-2007-MNA of Inorganic Contaminants in GW, Vol 1 Technical Basis for Assessment.pdf ...ored Natural Attenuation of Inorganic Contaminants in Groundwater, Volume 1 Technical Basis for Assessment, Edited by R.G. Ford, R.T. Wilkin, and R.W.(0 × 0 (2.16 MB)) - 20:17, 4 August 2016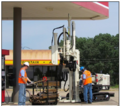
File:McCall-Article 1-Figure 1.PNG Figure 1: A track mounted DP machine set up for collection of soil and groundwater s(407 × 358 (342 KB)) - 20:19, 11 August 2016
File:McCall-Article 1-Figure 2.PNG (395 × 299 (315 KB)) - 20:21, 11 August 2016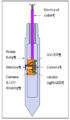
File:McCall-Article 1-Figure 3.PNG (252 × 433 (32 KB)) - 20:26, 11 August 2016


Page text matches
File:Wilson 2 Figure 1. BTEX.PNG Figure 1. Distribution of BTEX plume lengths from 604 hydrocarbon sites (Newell and(870 × 501 (343 KB)) - 18:47, 13 May 2016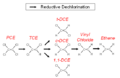
File:Wilson 3 Fig1.png Figure 1. Degradation of chlorinated alkenes(566 × 368 (12 KB)) - 14:48, 16 May 2016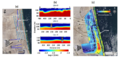
File:Slater-Article 2-Figure 1.PNG Figure 1. Resistivity imaging at the 300 Area of the Hanford Facility, Richland, WA.(890 × 427 (630 KB)) - 19:15, 31 January 2017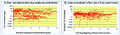
File:Fig1 LTM1 Overview.jpg Figure 1. Example of long term monitoring data from 52 source zone monitoring wells(3,179 × 921 (2.09 MB)) - 12:53, 17 June 2016
File:Adamson-Article 2-Table 1.PNG Table 1. Monitoring Data Required to Determine Long-Term Attenuation Rate(887 × 286 (24 KB)) - 14:57, 20 June 2016File:Walsh-Article 1-Figure 1.PNG Figure 1. Range ordnance disposal operation. Blow-in-place (BIP) operations often re(940 × 623 (1.13 MB)) - 20:04, 11 November 2016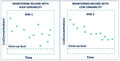
File:Fig1 LTM DataVariability.jpg Figure 1. Effect of Short-term Variability on Evaluation of Long-Term Contaminant At(2,809 × 1,419 (1.53 MB)) - 17:43, 24 June 2016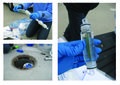
File:Fig1 PassiveSampling.jpg Figure 1. The Snap Sampler<sup>TM</sup> is an example of a passive grab sampler. Th(1,625 × 1,148 (1.53 MB)) - 19:55, 24 June 2016File:Truex 1 Fig1.png Figure 1. Xanthan gum concentration influence on fluid viscosity and rheology for se(910 × 631 (32 KB)) - 20:42, 30 June 2016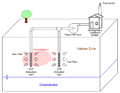
File:Truex 3 Fig1.png Figure 1. Conceptual Diagram of Basic SVE System for Vadose Zone Remediation(800 × 619 (73 KB)) - 17:35, 1 July 2016File:Haley-2009-Aquatic toxicity of 3-Nitro-1,2,4-triazol-5-one..pdf ...M.V., R.G. Kuperman, and R.T. Checkai. 2009. Aquatic toxicity of 3-nitro-1,2,4-triazol-5-one (NTO). ECBC-TR-726. Edgewood Chemical Biological Center ((0 × 0 (2.53 MB)) - 14:35, 12 July 2016File:Reiffsteck-2010-A New Hydraulic Profiling Tool including CPT Measurements.pdf ...Cone Penetration Testing. Volume 2: Equipment and Procedures, Paper No. 1-11, 8 pages(0 × 0 (280 KB)) - 14:54, 27 July 2016File:USEPA-2007-MNA of Inorganic Contaminants in GW, Vol 1 Technical Basis for Assessment.pdf ...ored Natural Attenuation of Inorganic Contaminants in Groundwater, Volume 1 Technical Basis for Assessment, Edited by R.G. Ford, R.T. Wilkin, and R.W.(0 × 0 (2.16 MB)) - 20:17, 4 August 2016File:USEPA-1999-Understanding variation in partition coefficient, Kd values-Vol 1.pdf ...1999. Understanding variation in partition coefficient, Kd, values, Volume 1 – The Kd model, methods of measurement, and application of chemical react(0 × 0 (3.61 MB)) - 20:45, 4 August 2016File:McCall-Article 1-Figure 1.PNG Figure 1: A track mounted DP machine set up for collection of soil and groundwater s(407 × 358 (342 KB)) - 20:19, 11 August 2016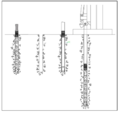
File:McCall Article 2. Figure 1.PNG Figure 1: Sampling sequence with an open-barrel, single-tube soil sampling system. T(402 × 378 (39 KB)) - 19:34, 19 August 2016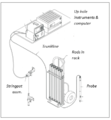
File:McCall Article 3 Figure 1.PNG Figure 1: General components of a DP logging system.(415 × 448 (58 KB)) - 21:10, 26 August 2016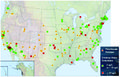
File:Krug-Article 1. Fig1 perchlorate.jpg Figure 1: Perchlorate Releases and Drinking Water Detections(1,592 × 1,021 (1.88 MB)) - 20:00, 30 August 2016
File:Krug-Article 1. Table1 perchlorate.PNG Table 1. Perchlorate Physical and Chemical Properties(1,150 × 278 (31 KB)) - 20:04, 30 August 2016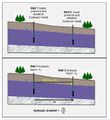
File:Newell-Article 1-Fig1.JPG Figure 1. Hydraulic gradient (typically described in units of m/m or ft/ft) is the d(650 × 708 (139 KB)) - 01:07, 9 May 2018


