Search results
Page title matches

File:Freedman Article 1 Equation 1.PNG (210 × 38 (962 bytes)) - 15:04, 19 January 2017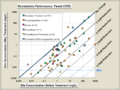
File:Crimi 1 Fig1a.png Fig 1. Change in Maximum Parent Compound Concentration by Technology Variant for(525 × 392 (63 KB)) - 13:51, 14 April 2016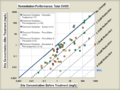
File:Crimi 1 Fig1b.png Fig 1. Change in Maximum Parent Compound Concentration by Technology Variant for(524 × 392 (63 KB)) - 13:54, 14 April 2016
File:1,1,1-trichloroethane.png (120 × 124 (3 KB)) - 18:23, 16 October 2015
File:1,1,2,2-Tetrachloroethane.png (343 × 263 (5 KB)) - 15:03, 18 October 2015
File:1,1,2-Trichloroethane.png (425 × 315 (8 KB)) - 18:25, 16 October 2015
File:1,1-Dichloroethane.png (100 × 74 (1 KB)) - 18:26, 16 October 2015
File:1,1-Dichloroethene.png (2,000 × 1,684 (48 KB)) - 18:26, 16 October 2015
File:1,2-dichloroethane.png (100 × 71 (1 KB)) - 18:28, 16 October 2015
File:Cis-1,2-dichloroethene.png (100 × 76 (6 KB)) - 18:32, 16 October 2015
File:ISCR Figure 1 Tratnyek.jpg (1,650 × 1,781 (861 KB)) - 20:25, 10 December 2015
File:1,1,1,2-Tetrachloroethane 2.png (401 × 263 (5 KB)) - 19:56, 16 October 2015
File:1,1,1,2-Tetrachloroethane.png (401 × 263 (5 KB)) - 15:15, 18 October 2015
File:1,1,2-Trichloroethane.svg.png (500 × 371 (10 KB)) - 15:26, 18 October 2015
File:1,1-Dichloroethane 2.svg.png (500 × 348 (16 KB)) - 15:31, 18 October 2015
File:Trans-1,2-dichloroethene.png (708 × 543 (7 KB)) - 16:00, 18 October 2015
File:1,1-Dichloroethene.svg.png (500 × 421 (9 KB)) - 16:04, 18 October 2015
File:NJDEP-SRP-2012-MNA Technical Guidance v 1 0.pdf (0 × 0 (2.8 MB)) - 21:13, 24 February 2016File:Results of Analyses for 1,4-Dioxane in Groundwater Samples.pdf Results of Analyses for 1,4-dioxane in groundwater samples(0 × 0 (4.74 MB)) - 17:01, 5 May 2016File:2013 EPA Technical Fact Sheet 1,4-Dioxane.pdf Technical Fact Sheet for 1,4-Dioxane(0 × 0 (88 KB)) - 17:40, 5 May 2016
File:Wilson 1 Fig1a.JPG (939 × 625 (135 KB)) - 16:08, 10 May 2016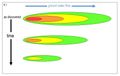
File:Wilson 1 Fig1b.JPG (939 × 594 (130 KB)) - 16:12, 10 May 2016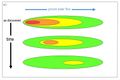
File:Wilson 1 Fig1c.JPG (935 × 626 (146 KB)) - 16:13, 10 May 2016File:USACE-2002-Soil Vapor Extraction and Bioventing-EM 1110-1-4001.pdf ...002. Engineering and Design: Soil Vapor Extraction and Bioventing. EM 1110-1-4001, U.S. Army Corps of Engineers, Washington, D.C(0 × 0 (3.6 MB)) - 17:50, 11 May 2016
File:Wilson 2 Figure 1. BTEX.PNG Figure 1. Distribution of BTEX plume lengths from 604 hydrocarbon sites (Newell and(870 × 501 (343 KB)) - 18:47, 13 May 2016File:FAQ-ChlorinatedSolvents-ER-200530-1-.pdf (0 × 0 (2.46 MB)) - 19:46, 24 May 2016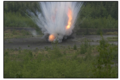
File:Walsh-Article 1-Figure 1.PNG Figure 1. Range ordnance disposal operation. Blow-in-place (BIP) operations often re(940 × 623 (1.13 MB)) - 20:04, 11 November 2016
File:Walsh-Article 1-Figure 2.PNG (1,270 × 438 (678 KB)) - 20:06, 11 November 2016
File:Walsh-Article 1-Figure 3.PNG (1,317 × 467 (1.08 MB)) - 20:06, 11 November 2016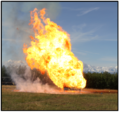
File:Walsh-Article 1-Figure 4.PNG (549 × 516 (570 KB)) - 20:08, 11 November 2016
File:Walsh-Article 1-Figure 5.PNG (1,170 × 530 (1.25 MB)) - 20:09, 11 November 2016
File:Walsh-Article 1-Table 3.PNG (1,150 × 445 (59 KB)) - 20:10, 11 November 2016
File:Walsh-Article 1-Table 5.PNG (834 × 531 (28 KB)) - 20:12, 11 November 2016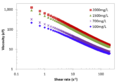
File:Truex 1 Fig1.png Figure 1. Xanthan gum concentration influence on fluid viscosity and rheology for se(910 × 631 (32 KB)) - 20:42, 30 June 2016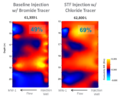
File:Truex 1 Fig2.png (663 × 543 (253 KB)) - 20:46, 30 June 2016File:Haley-2009-Aquatic toxicity of 3-Nitro-1,2,4-triazol-5-one..pdf ...M.V., R.G. Kuperman, and R.T. Checkai. 2009. Aquatic toxicity of 3-nitro-1,2,4-triazol-5-one (NTO). ECBC-TR-726. Edgewood Chemical Biological Center ((0 × 0 (2.53 MB)) - 14:35, 12 July 2016File:USEPA-2007-MNA of Inorganic Contaminants in GW, Vol 1 Technical Basis for Assessment.pdf ...ored Natural Attenuation of Inorganic Contaminants in Groundwater, Volume 1 Technical Basis for Assessment, Edited by R.G. Ford, R.T. Wilkin, and R.W.(0 × 0 (2.16 MB)) - 20:17, 4 August 2016
File:McCall-Article 1-Figure 1.PNG Figure 1: A track mounted DP machine set up for collection of soil and groundwater s(407 × 358 (342 KB)) - 20:19, 11 August 2016
File:McCall-Article 1-Figure 2.PNG (395 × 299 (315 KB)) - 20:21, 11 August 2016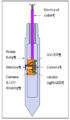
File:McCall-Article 1-Figure 3.PNG (252 × 433 (32 KB)) - 20:26, 11 August 2016
File:McCall-Article 1-Figure 4.PNG (219 × 272 (13 KB)) - 20:30, 11 August 2016
File:McCall-Article 1-Figure 5.PNG (177 × 379 (24 KB)) - 20:32, 11 August 2016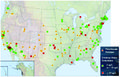
File:Krug-Article 1. Fig1 perchlorate.jpg Figure 1: Perchlorate Releases and Drinking Water Detections(1,592 × 1,021 (1.88 MB)) - 20:00, 30 August 2016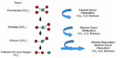
File:Krug-article 1. Fig2 Biodegradation Pathways.PNG (993 × 478 (232 KB)) - 20:03, 30 August 2016
File:Krug-Article 1. Table1 perchlorate.PNG Table 1. Perchlorate Physical and Chemical Properties(1,150 × 278 (31 KB)) - 20:04, 30 August 2016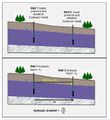
File:Newell-Article 1-Fig1.JPG Figure 1. Hydraulic gradient (typically described in units of m/m or ft/ft) is the d(650 × 708 (139 KB)) - 01:07, 9 May 2018
File:Newell-Article 1-Fig2.jpg (1,765 × 1,748 (469 KB)) - 18:37, 2 September 2016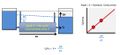
File:Newell-Article 1-Fig3..JPG (1,086 × 494 (51 KB)) - 18:39, 2 September 2016
File:Newell-Article 1-Fig4.JPG (908 × 622 (89 KB)) - 18:41, 2 September 2016
File:Newell-Article 1-Table1r.jpg Table 1. Representative Values of Total Porosity (n), Effective Porosity (ne), and(1,041 × 511 (138 KB)) - 20:38, 6 September 2016
File:Newell-Article 1-Table2r.jpg (699 × 552 (103 KB)) - 20:43, 6 September 2016
File:Newell-Article 1-Equation 1.jpg (973 × 272 (58 KB)) - 18:50, 2 September 2016
File:Newell-Article 1-Equation 2.jpg (943 × 216 (36 KB)) - 18:52, 2 September 2016
File:Newell-Article 1-Equation 1r.jpg Chuck Newell - Article 1 - Equation 1(551 × 56 (12 KB)) - 14:09, 7 September 2016
File:Newell-Article 1-Equation 2r.jpg (475 × 60 (11 KB)) - 14:13, 7 September 2016
File:Newell-Article 1-Equation 1rr.jpg Newell-Article 1-Equation 1(543 × 49 (11 KB)) - 14:42, 7 September 2016
File:Richardson-Article 1-Table 1.JPG Table 1. Chemical structures and selected properties of the 16 USEPA priority pollu(588 × 814 (105 KB)) - 19:57, 12 September 2016File:Deeb-Article 1-Table 2 L1-Drinking water health advisories.pdf Deeb-Article 1.Drinking water health advisories(0 × 0 (511 KB)) - 21:01, 21 September 2016File:Deeb-Article 1-Table 2-L2-Drinking water screening values.pdf Deeb-Article 1-Table 2-L2-Drinking water screening values(0 × 0 (841 KB)) - 13:11, 22 September 2016File:Deeb-Article 1-Table 2-L6-Dev of MCL recommendations for PFOA and PFOS.pdf Deeb-Article 1-Table 2-L6-Dev of MCL recommendations for PFOA and PFOS(0 × 0 (404 KB)) - 13:16, 22 September 2016File:Deeb-Article 1-Table 2-L7-Health-Based Maximum Contaminant Level MCL.pdf Deeb-Article 1-Table 2-L7-Health-Based Maximum Contaminant Level_MCL(0 × 0 (2.3 MB)) - 13:17, 22 September 2016File:Deeb-Article 1-Table 2-L10-Provisional Groundwater Remediaton Objectives Class I Groundwater.pdf Deeb-Article 1-Table 2-L10-Provisional Groundwater Remediaton Objectives_Class I Groundwat(0 × 0 (6.03 MB)) - 13:21, 22 September 2016File:Deeb-Article 1-Table 2-L11-Provisional Groundwater Remediaton Objectives Class II Groundwater .pdf Deeb-Article 1-Table 2-L11-Provisional Groundwater Remediaton Objectives_Class II Groundwa(0 × 0 (6.03 MB)) - 13:26, 22 September 2016File:Deeb-Article 1-Table 2-L13-Interim specific groundwatr quality criterion fact sheet.pdf Deeb-Article 1-Table 2-L13-Interim specific groundwatr quality criterion_fact_sheet(0 × 0 (573 KB)) - 13:30, 22 September 2016File:Deeb-Article 1-Table 2-L15-Groundwater residential generic cleanup criteria and screening levels .pdf Deeb-Article 1-Table 2-L15-Groundwater residential generic cleanup criteria and screening(0 × 0 (3.03 MB)) - 13:36, 22 September 2016File:Deeb-Article 1-Table 2-L16-Groundwater nonresidential generic cleanup criteria and screening levels.pdf Deeb-Article 1-Table 2-L16-Groundwater nonresidential generic cleanup criteria and screeni(0 × 0 (3.03 MB)) - 13:44, 22 September 2016File:Deeb-Article 1-Table 2-L18-Residential soil screening levels.pdf Deeb-Article 1-Table 2-L18-Residential soil screening levels(0 × 0 (517 KB)) - 14:37, 22 September 2016
File:Deeb-Article 1-Table 2-L19-Industrial soil reference value.xlsx (438 KB) - 14:50, 22 September 2016File:Deeb-Article 1-Table 2-L20-Residential soil reference value.xlsx (438 KB) - 15:21, 22 September 2016File:Deeb-Article 1-Table 2-L21-Recreational soil reference value.xlsx (438 KB) - 15:22, 22 September 2016File:Deeb-Article 1-Table 2-L22-ME-Remedial Action guidelines.pdf Deeb-Article 1-Table 2-L22-ME-Remedial Action guidelines(0 × 0 (599 KB)) - 15:54, 22 September 2016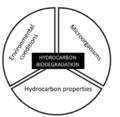
File:Edwards Article 1-figure 1.PNG Figure 1. Components of hydrocarbon biodegradation. Understanding and facilitating b(464 × 453 (58 KB)) - 16:12, 25 January 2017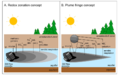
File:Edwards Article 1-figure 2.PNG (910 × 573 (241 KB)) - 16:15, 25 January 2017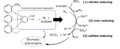
File:Edwards Article 1-figure 3.PNG ...ion of benzene and alkylbenzenes. Acetate and H2 are consumed in reactions 1, 2, and 3, keeping the fermentation reaction energetically favorable. When(925 × 380 (74 KB)) - 16:17, 25 January 2017
File:Lollar-Article 1-Equation 2R.PNG (299 × 49 (2 KB)) - 16:05, 13 January 2017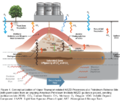
File:Palaia-Article 1-Figure 1.PNG Figure 1. Conceptualization of Vapor Transport-related NSZD Processes at a Petroleum(796 × 683 (250 KB)) - 18:28, 25 October 2016
File:Palaia-Article 1-Figure 2.PNG (817 × 555 (117 KB)) - 18:29, 25 October 2016
File:Palaia-Article 1-Figure 3.PNG (809 × 439 (753 KB)) - 18:32, 25 October 2016
File:Palaia-Article 1-Figure 4.PNG (808 × 466 (732 KB)) - 18:33, 25 October 2016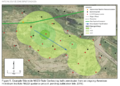
File:Palaia-Article 1-Figure 5.PNG (844 × 606 (863 KB)) - 18:37, 25 October 2016
File:Palaia-Article 1-Table 1.PNG Table 1. Terminal Electron Accepting Processes Associated with the Aqueous Expressi(830 × 189 (95 KB)) - 18:39, 25 October 2016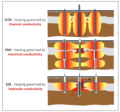
File:Heron-Article 1. Figure 2.PNG (594 × 554 (108 KB)) - 18:03, 26 October 2016
File:Heron-Article 1. Figure 3.PNG (724 × 494 (66 KB)) - 18:04, 26 October 2016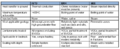
File:Heron-Article 1. Table 1.PNG Table 1. Characteristics of the three main thermal technologies.(719 × 292 (29 KB)) - 18:09, 26 October 2016
File:Deeb-Article 1-Figure 1.JPG Figure 1. a) Structure of a perfluoroalkyl substance, PFOS, compared with b) the str(757 × 418 (29 KB)) - 15:17, 5 October 2016
File:Deeb-Article 1-Table 1.JPG Table 1. Physical and chemical properties of PFOS and PFOA(1,068 × 589 (142 KB)) - 15:20, 5 October 2016
File:Krug-Article 1. Table1 perchlorate rev.PNG Table 1. Perchlorate Physical and Chemical Properties(772 × 150 (15 KB)) - 14:35, 13 October 2016
File:Taylor-Article 1-T1.PNG (970 × 570 (69 KB)) - 19:37, 21 October 2016
File:Palaia-Article 1-Fraction 1.1.PNG (45 × 33 (696 bytes)) - 20:02, 26 October 2016
File:Palaia-Article 1-Fraction 1.2.PNG (28 × 43 (567 bytes)) - 20:03, 26 October 2016
File:Palaia-Article 1-Equation 1.PNG (808 × 41 (2 KB)) - 19:43, 25 October 2016
File:Palaia-Article 1-Equation 2.PNG (600 × 34 (2 KB)) - 19:44, 25 October 2016
File:Heron-Article 1. Figure 1.PNG Figure 1. Candidate Site for ISTR Application with Significant NAPL Source Material(614 × 357 (65 KB)) - 18:02, 26 October 2016
File:Denham-Article 1-Figure 1. PNG.PNG Figure 1: Uranium’s complicated aqueous speciation (diagram produced with The Geoc(814 × 684 (82 KB)) - 19:16, 1 November 2016File:Dortch-2009-Methods for Tier 1 modeling training range ERCDC-EL-TR0911.pdf Dortch, M.S., J.A. Gerald, and B.E. Johnson. 2009. Methods for Tier 1 modeling with the Training Range Environmental Evaluation and Characterizat(0 × 0 (1.71 MB)) - 20:21, 4 November 2016File:Dortch-2012-Extension of cap for the Tier 1 and 2 approaches Training range ERDC-EL-TR-12-11.pdf ...E. Johnson, and J.A. Gerald. 2012. Extension of capabilities for the Tier 1 and Tier 2 Approaches within the Training Range Environmental Evaluation an(0 × 0 (510 KB)) - 20:45, 4 November 2016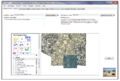
File:BJohnson-Article 1-Figure 1.PNG Figure 1. TREECS main screen as it appears for an application involving GIS data.(955 × 641 (434 KB)) - 19:57, 7 November 2016
File:BJohnson-Article 1-Figure 2.PNG (762 × 329 (98 KB)) - 19:58, 7 November 2016
File:BJohnson-Article 1-Figure 3.PNG (770 × 576 (95 KB)) - 19:59, 7 November 2016
File:BJohnson-Article 1-Figure 4.PNG (803 × 543 (89 KB)) - 20:00, 7 November 2016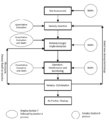
File:Favara-Article 1-Figure 2.PNG (593 × 652 (33 KB)) - 14:34, 9 November 2016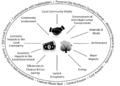
File:Favara-Article 1-Figure 3.PNG (1,284 × 921 (220 KB)) - 14:39, 9 November 2016
File:Favara-Article 1-Figure 1-Exhibit-2.jpg Figure 1. Comparison of linear versus holistic approach to integrating sustainabilit(2,819 × 1,183 (997 KB)) - 14:29, 9 November 2016
File:No Author-Article 1-Table 1.PNG Table 1. Median lethal concentration of NTO to Ceriodaphnia (mg/L)(528 × 150 (7 KB)) - 13:38, 11 November 2016File:INTERIM GUIDANCE FOR INVESTIGATING POTENTIAL 1,2,3-TRICHLOROPROPANE SOURCES.pdf Interim Guidance for Investigating Potential 1,2,3-Trichloropropane Sources in San Gabriel Valley Area 3(0 × 0 (1.29 MB)) - 19:32, 16 December 2016File:Maximum contaminant level recommendations for 1,2,3-trichloroporpane in drinking water.pdf Maximum contaminant level recommendations for 1,2,3-trichloroporpane in drinking water(0 × 0 (115 KB)) - 19:42, 16 December 2016File:1,2,3-Trichloropropane state of science.pdf 1,2,3-Trichloropropane State of the Science. Water Research Foundation.(0 × 0 (269 KB)) - 19:44, 16 December 2016File:1 2 3 TCP fact sheet.pdf Technical Fact Sheet—1,2,3-Trichloropropane (TCP)(0 × 0 (96 KB)) - 19:56, 16 December 2016File:Complete reductive dechlorinate of 1 2 dichloropropane by anaerobic bacteria.pdf Complete Reductive Dechlorination of 1,2-Dichloropropane(0 × 0 (129 KB)) - 14:11, 19 December 2016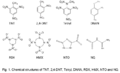
File:KFinneran-Article 1-Figure 1.PNG Fig. 1. Chemical structures of TNT, 2,4-DNT, Tetryl, DNAN, RDX, HMX, NTO and NQ.(730 × 445 (50 KB)) - 20:10, 4 January 2017
File:KFinneran-Article 1-Table 1.PNG Table 1. Common US military explosives, propellants and IM formulations(599 × 569 (40 KB)) - 20:14, 4 January 2017
File:Dontsova-Article 1-Figure 1.PNG Figure 1. Common energetic materials, modified from Taylor et al. (Taylor et al., 20(809 × 530 (29 KB)) - 19:15, 11 January 2017
File:Dontsova-Article 1-Figure 2.PNG (901 × 542 (63 KB)) - 19:18, 11 January 2017
File:Dontsova-Article 1-Figure 3.PNG (620 × 360 (45 KB)) - 19:21, 11 January 2017
File:Dontsova-Article 1-Figure 4.PNG (571 × 300 (27 KB)) - 19:22, 11 January 2017
File:Lollar-Article 1-Equation 2.PNG (432 × 76 (3 KB)) - 15:16, 13 January 2017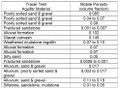
File:Newell-Article 1-Table2r2.jpg (988 × 736 (153 KB)) - 15:23, 13 February 2017
File:Freedman Article 1 Figure 1.PNG Figure 1. Generic hydrogenolysis; R = organic compound, X = halide.(938 × 116 (8 KB)) - 15:07, 19 January 2017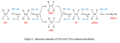
File:Freedman Article 1 Figure 2.PNG (1,219 × 437 (27 KB)) - 15:10, 19 January 2017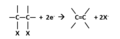
File:Freedman A 1 Fig 3.PNG (357 × 116 (5 KB)) - 16:36, 19 January 2017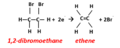
File:Freedman A 1 Fig 4.PNG (418 × 166 (5 KB)) - 17:16, 19 January 2017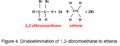
File:Freedman Article 1 Figure 4.PNG Figure 4. Dihaloelimination of 1,2-dibromoethane to ethene.(636 × 242 (10 KB)) - 15:39, 19 January 2017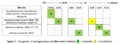
File:Freedman Article 1 Figure 5.PNG (1,020 × 378 (60 KB)) - 15:42, 19 January 2017
File:Freedman Article 1 Figure 6.PNG (738 × 324 (21 KB)) - 15:45, 19 January 2017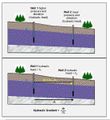
File:550px-Newell-Article 1-Fig1.JPG (550 × 599 (103 KB)) - 00:37, 9 May 2018
File:Newell-Article 1-Fig1r.JPG Figure 1. Hydraulic gradient (typically described in units of m/m or ft/ft) is the d(650 × 708 (139 KB)) - 01:12, 9 May 2018File:2012-Li yixuan-MASc thesis Adaptation of KB-1 to Acidic Environments.pdf Li, J.J., 2012. Adaptation of a Dechlorinating Culture, KB-1, to Acidic Environments. M.S. Thesis, University of Toronto, Toronto, ON,(0 × 0 (1.31 MB)) - 14:43, 18 July 2018File:2011-ACOE-pwtb 200 1 95.pdf ...Learned, U.S. Army Corps of Engineers, Public Works Technical Bulletin 200-1-95.(0 × 0 (1.06 MB)) - 15:05, 1 February 2019File:1994-Parales-Degradation of 1,4-Dioxane by an Actinomycete in Pure Culture.pdf Parales, R.E., J.E. Adamus, N. White, and H.D. May, 1994. Dedegradation of 1,4-dioxane by an Actinomycete in pure culture. Applied and Environmental Mic(0 × 0 (829 KB)) - 20:11, 25 April 2019File:2016-Knappe-Occurrence of 1,4-dioxane in the Cape Fear River.pdf ...Cape Fear River watershed and effectiveness of water treatment options for 1,4-dioxane control. Water Resources Research Institute of The University of(0 × 0 (3.43 MB)) - 21:11, 25 April 2019File:2012-ASTDR. Toxicological profile for 1,4-dioxane.pdf ATSDR, 2012. Toxicological profile for 1,4-dioxane. Agency for Toxic Substances and Disease Registry(0 × 0 (6.82 MB)) - 19:17, 26 April 2019File:2001-Black-Occurrence of 1,4-dioxane in cosmetic raw materials....pdf Black, R.E., F.J. Hurley, and D.C. Havery, 2001. Occurrence of 1,4-dioxane in cosmetic raw materials and finished cosmetic products. Journal(0 × 0 (48 KB)) - 20:48, 26 April 2019File:1998-Ellis-Destroying 1,4-dioxane in byproduct streams formed during polyester.pdf Ellis, R.A. and J.S. Thomas, 1998. Destroying 1,4-dioxane in byproduct streams formed during polyester synthesis. United St(0 × 0 (606 KB)) - 21:08, 26 April 2019File:2012-Shangraw-Full-scale Treatment of 1,4-dioxane.pdf Shangraw, T. and W. Plaehn, 2012. Full-scale treatment of 1,4-dioxane using a bioreactor. Federal Remediation Technologies Roundtable M(0 × 0 (3.47 MB)) - 20:58, 1 May 2019File:ER-201505CollectingSewerSample FINAL (1).mp4 (43.59 MB) - 20:09, 13 May 2019File:2017-USGCRP-Climate Science Special Report Fourth National Climate Assessment, Vol 1..pdf (0 × 0 (27.81 MB)) - 15:48, 19 December 2019File:ITRC PFAS-1 092020.pdf (0 × 0 (12.37 MB)) - 18:26, 26 March 2021


Page text matches
File:Crimi 1 Fig1a.png Fig 1. Change in Maximum Parent Compound Concentration by Technology Variant for(525 × 392 (63 KB)) - 13:51, 14 April 2016File:Crimi 1 Fig1b.png Fig 1. Change in Maximum Parent Compound Concentration by Technology Variant for(524 × 392 (63 KB)) - 13:54, 14 April 2016File:ITRC-2007-Vapor Intrusion Pathway, A Practical Guide.pdf ITRC, 2007. Vapor Intrusion Pathway: A Practical Guide. VI-1. Washington, D.C.: Interstate Regulatory Council, Vapor Intrusion Team(0 × 0 (3.42 MB)) - 19:25, 19 April 2018File:ITRC-2014-PVI Fundamentals of Screening and Investigation and Mgmt.pdf ...r Intrusion: Fundamentals of Screening, Investigation, and Management. PVI-1. Washington, D.C.: Interstate Technology & Regulatory Council, Petroleum Va(0 × 0 (24.24 MB)) - 19:12, 19 April 2018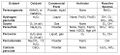
File:Crimi 2 Table1.JPG Table 1(985 × 452 (97 KB)) - 14:36, 15 April 2016File:atsdr toxprofile stp57.pdf ...c Substances and Disease Registry (ATSDR), 1992. Toxicological Profile for 1,2,3-Trichloropropane(0 × 0 (1.52 MB)) - 19:20, 16 December 2016File:ITRC-2010-A Decision Framework.pdf ...tate Technology and Regulatory Council, Technical/Regulatory Guidance AMPR-1.(0 × 0 (4.21 MB)) - 19:25, 29 January 2016File:ITRC-2013-Groundwater Stat Mon.pdf ...Monitoring Compliance, Statistical Tools for the Project Life Cycle. GSMC-1. Washington, D.C.: Interstate Technology & Regulatory Council, Groundwater(0 × 0 (4.47 MB)) - 20:57, 4 February 2016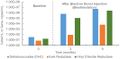
File:Fig1 qPCR Olges.JPG Fig 1: Results for qPCR monitoring of Dehalococcoides and vinyl chloride reductas(1,061 × 524 (61 KB)) - 16:57, 19 February 2016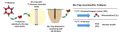
File:Fig1 SIP Olges.jpg Fig 1: SIP in Use: Loading, deployment and recovery of Bio-Trap passive sampler w(1,383 × 393 (98 KB)) - 18:48, 23 February 2016
File:Table1 SIP Ogles.JPG Table 1. Examples of Appropriate Contaminants for SIP Studies(1,034 × 258 (61 KB)) - 19:03, 23 February 2016File:Falta-2005-The potential for Ground Water Contamination.pdf ...Water Contamination by the Gasoline Lead Scavengers Ethylene Dibromide and 1, 2‐Dichloroethane. Environmental Science and Technology Magazine Online.(0 × 0 (238 KB)) - 20:18, 3 March 2016
File:Denham pH buffering Fig1.jpg Fig 1. Graphic showing the dissolved carbonate system.(2,938 × 2,083 (2.03 MB)) - 19:10, 27 April 2016File:2006 EPA 542-R-06-009.pdf Treatment Technologies for 1,4-Dioxane(0 × 0 (1.25 MB)) - 16:29, 5 May 2016File:2008 AFCEE A Primer for AF RPMs AFD-081010-028.pdf Primer for Air Force Remedial Program Managers and assessors for 1,4-Dioxane(0 × 0 (379 KB)) - 16:48, 5 May 2016File:Results of Analyses for 1,4-Dioxane in Groundwater Samples.pdf Results of Analyses for 1,4-dioxane in groundwater samples(0 × 0 (4.74 MB)) - 17:01, 5 May 2016File:2013 EPA Technical Fact Sheet 1,4-Dioxane.pdf Technical Fact Sheet for 1,4-Dioxane(0 × 0 (88 KB)) - 17:40, 5 May 2016File:Kamath-2010-Passive Soil Vapor Extraction-SRNL-STI-2009-00571.pdf ....B. Looney. 2010. Passive Soil Vapor Extraction. SRNL-STI-2009-00571, Rev. 1, Savannah River National Laboratory, Aiken, South Carolina(0 × 0 (3.57 MB)) - 13:59, 11 May 2016File:USACE-2002-Soil Vapor Extraction and Bioventing-EM 1110-1-4001.pdf ...002. Engineering and Design: Soil Vapor Extraction and Bioventing. EM 1110-1-4001, U.S. Army Corps of Engineers, Washington, D.C(0 × 0 (3.6 MB)) - 17:50, 11 May 2016File:Wilson-2008-Natural attenuation of the lead scavengers.pdf ...n of the lead scavengers 1, 2-dibromoethane (EDB) and 1, 2-dichloroethane (1, 2-DCA) at motor fuel release sites and implications for risk management. U(0 × 0 (2.2 MB)) - 20:58, 12 May 2016File:Wilson 2 Figure 1. BTEX.PNG Figure 1. Distribution of BTEX plume lengths from 604 hydrocarbon sites (Newell and(870 × 501 (343 KB)) - 18:47, 13 May 2016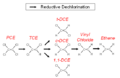
File:Wilson 3 Fig1.png Figure 1. Degradation of chlorinated alkenes(566 × 368 (12 KB)) - 14:48, 16 May 2016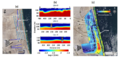
File:Slater-Article 2-Figure 1.PNG Figure 1. Resistivity imaging at the 300 Area of the Hanford Facility, Richland, WA.(890 × 427 (630 KB)) - 19:15, 31 January 2017
File:Fig1 LTM1 Overview.jpg Figure 1. Example of long term monitoring data from 52 source zone monitoring wells(3,179 × 921 (2.09 MB)) - 12:53, 17 June 2016
File:Adamson-Article 2-Table 1.PNG Table 1. Monitoring Data Required to Determine Long-Term Attenuation Rate(887 × 286 (24 KB)) - 14:57, 20 June 2016File:Walsh-Article 1-Figure 1.PNG Figure 1. Range ordnance disposal operation. Blow-in-place (BIP) operations often re(940 × 623 (1.13 MB)) - 20:04, 11 November 2016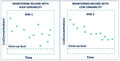
File:Fig1 LTM DataVariability.jpg Figure 1. Effect of Short-term Variability on Evaluation of Long-Term Contaminant At(2,809 × 1,419 (1.53 MB)) - 17:43, 24 June 2016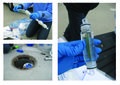
File:Fig1 PassiveSampling.jpg Figure 1. The Snap Sampler<sup>TM</sup> is an example of a passive grab sampler. Th(1,625 × 1,148 (1.53 MB)) - 19:55, 24 June 2016File:Truex 1 Fig1.png Figure 1. Xanthan gum concentration influence on fluid viscosity and rheology for se(910 × 631 (32 KB)) - 20:42, 30 June 2016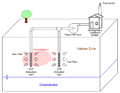
File:Truex 3 Fig1.png Figure 1. Conceptual Diagram of Basic SVE System for Vadose Zone Remediation(800 × 619 (73 KB)) - 17:35, 1 July 2016File:Haley-2009-Aquatic toxicity of 3-Nitro-1,2,4-triazol-5-one..pdf ...M.V., R.G. Kuperman, and R.T. Checkai. 2009. Aquatic toxicity of 3-nitro-1,2,4-triazol-5-one (NTO). ECBC-TR-726. Edgewood Chemical Biological Center ((0 × 0 (2.53 MB)) - 14:35, 12 July 2016File:Reiffsteck-2010-A New Hydraulic Profiling Tool including CPT Measurements.pdf ...Cone Penetration Testing. Volume 2: Equipment and Procedures, Paper No. 1-11, 8 pages(0 × 0 (280 KB)) - 14:54, 27 July 2016File:USEPA-2007-MNA of Inorganic Contaminants in GW, Vol 1 Technical Basis for Assessment.pdf ...ored Natural Attenuation of Inorganic Contaminants in Groundwater, Volume 1 Technical Basis for Assessment, Edited by R.G. Ford, R.T. Wilkin, and R.W.(0 × 0 (2.16 MB)) - 20:17, 4 August 2016File:USEPA-1999-Understanding variation in partition coefficient, Kd values-Vol 1.pdf ...1999. Understanding variation in partition coefficient, Kd, values, Volume 1 – The Kd model, methods of measurement, and application of chemical react(0 × 0 (3.61 MB)) - 20:45, 4 August 2016File:McCall-Article 1-Figure 1.PNG Figure 1: A track mounted DP machine set up for collection of soil and groundwater s(407 × 358 (342 KB)) - 20:19, 11 August 2016
File:McCall Article 2. Figure 1.PNG Figure 1: Sampling sequence with an open-barrel, single-tube soil sampling system. T(402 × 378 (39 KB)) - 19:34, 19 August 2016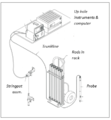
File:McCall Article 3 Figure 1.PNG Figure 1: General components of a DP logging system.(415 × 448 (58 KB)) - 21:10, 26 August 2016File:Krug-Article 1. Fig1 perchlorate.jpg Figure 1: Perchlorate Releases and Drinking Water Detections(1,592 × 1,021 (1.88 MB)) - 20:00, 30 August 2016File:Krug-Article 1. Table1 perchlorate.PNG Table 1. Perchlorate Physical and Chemical Properties(1,150 × 278 (31 KB)) - 20:04, 30 August 2016File:Newell-Article 1-Fig1.JPG Figure 1. Hydraulic gradient (typically described in units of m/m or ft/ft) is the d(650 × 708 (139 KB)) - 01:07, 9 May 2018File:Newell-Article 1-Table1r.jpg Table 1. Representative Values of Total Porosity (n), Effective Porosity (ne), and(1,041 × 511 (138 KB)) - 20:38, 6 September 2016File:Newell-Article 1-Equation 1r.jpg Chuck Newell - Article 1 - Equation 1(551 × 56 (12 KB)) - 14:09, 7 September 2016File:Newell-Article 1-Equation 1rr.jpg Newell-Article 1-Equation 1(543 × 49 (11 KB)) - 14:42, 7 September 2016File:Richardson-Article 1-Table 1.JPG Table 1. Chemical structures and selected properties of the 16 USEPA priority pollu(588 × 814 (105 KB)) - 19:57, 12 September 2016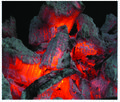
File:Gerhard Fig1.jpg Figure 1. Smoldering charcoal example of a flameless, self-sustaining combustion rea(2,042 × 1,733 (5.26 MB)) - 18:56, 15 September 2016
File:Fig1 dispanddiff.JPG ...of diffusion of dissolved chemicals recently place in a container at Time 1 (left panel) and then distributed throughout the container (right panel) at(732 × 494 (45 KB)) - 20:37, 16 September 2016File:Deeb-Article 1-Table 2-L2-Drinking water screening values.pdf Deeb-Article 1-Table 2-L2-Drinking water screening values(0 × 0 (841 KB)) - 13:11, 22 September 2016File:Deeb-Article 1-Table 2-L6-Dev of MCL recommendations for PFOA and PFOS.pdf Deeb-Article 1-Table 2-L6-Dev of MCL recommendations for PFOA and PFOS(0 × 0 (404 KB)) - 13:16, 22 September 2016File:Deeb-Article 1-Table 2-L7-Health-Based Maximum Contaminant Level MCL.pdf Deeb-Article 1-Table 2-L7-Health-Based Maximum Contaminant Level_MCL(0 × 0 (2.3 MB)) - 13:17, 22 September 2016File:Deeb-Article 1-Table 2-L10-Provisional Groundwater Remediaton Objectives Class I Groundwater.pdf Deeb-Article 1-Table 2-L10-Provisional Groundwater Remediaton Objectives_Class I Groundwat(0 × 0 (6.03 MB)) - 13:21, 22 September 2016File:Deeb-Article 1-Table 2-L11-Provisional Groundwater Remediaton Objectives Class II Groundwater .pdf Deeb-Article 1-Table 2-L11-Provisional Groundwater Remediaton Objectives_Class II Groundwa(0 × 0 (6.03 MB)) - 13:26, 22 September 2016File:Deeb-Article 1-Table 2-L13-Interim specific groundwatr quality criterion fact sheet.pdf Deeb-Article 1-Table 2-L13-Interim specific groundwatr quality criterion_fact_sheet(0 × 0 (573 KB)) - 13:30, 22 September 2016File:Deeb-Article 1-Table 2-L15-Groundwater residential generic cleanup criteria and screening levels .pdf Deeb-Article 1-Table 2-L15-Groundwater residential generic cleanup criteria and screening(0 × 0 (3.03 MB)) - 13:36, 22 September 2016File:Deeb-Article 1-Table 2-L16-Groundwater nonresidential generic cleanup criteria and screening levels.pdf Deeb-Article 1-Table 2-L16-Groundwater nonresidential generic cleanup criteria and screeni(0 × 0 (3.03 MB)) - 13:44, 22 September 2016File:Deeb-Article 1-Table 2-L18-Residential soil screening levels.pdf Deeb-Article 1-Table 2-L18-Residential soil screening levels(0 × 0 (517 KB)) - 14:37, 22 September 2016File:Deeb-Article 1-Table 2-L22-ME-Remedial Action guidelines.pdf Deeb-Article 1-Table 2-L22-ME-Remedial Action guidelines(0 × 0 (599 KB)) - 15:54, 22 September 2016File:IARC-2016-Monographs on the eval of carcinogenic risks to humans List of Classifications.pdf ...luation of Carcinogenic Risks to Humans. Lists of Classifications, Volumes 1 to 116.(0 × 0 (199 KB)) - 20:12, 28 September 2016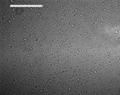
File:Borden3w2 Fig1.PNG Figure 1. Photo-micrograph of EVO (0.7 µm median diameter). White scale bar 25 µm(578 × 457 (210 KB)) - 20:01, 13 November 2018
File:McGuire1w2Equation1.PNG McGuire 1w2 Equation 1(552 × 83 (4 KB)) - 15:37, 22 August 2018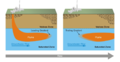
File:Denham-Article 3-Figure 1.PNG Figure 1. Typical contaminant plume evolution in an aquifer showing leading and trai(1,082 × 558 (230 KB)) - 17:18, 23 January 2017
File:Denham-Article 3-Table 1.PNG Table 1. Tiered four-phase approach to demonstrating MNA for inorganic compounds(676 × 604 (55 KB)) - 17:20, 23 January 2017File:Edwards Article 1-figure 1.PNG Figure 1. Components of hydrocarbon biodegradation. Understanding and facilitating b(464 × 453 (58 KB)) - 16:12, 25 January 2017File:Edwards Article 1-figure 3.PNG ...ion of benzene and alkylbenzenes. Acetate and H2 are consumed in reactions 1, 2, and 3, keeping the fermentation reaction energetically favorable. When(925 × 380 (74 KB)) - 16:17, 25 January 2017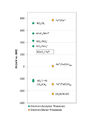
File:MacKinnon AnBiorem Fig1.jpg Figure 1. Redox ladder for common electron donors and electron acceptors.(2,550 × 3,300 (519 KB)) - 18:41, 9 January 2017
File:Mackinnon-Article 2- figure 1.PNG Figure 1. Amendment addition for biobarrier.(455 × 668 (829 KB)) - 16:03, 6 January 2017File:Palaia-Article 1-Figure 1.PNG Figure 1. Conceptualization of Vapor Transport-related NSZD Processes at a Petroleum(796 × 683 (250 KB)) - 18:28, 25 October 2016File:Palaia-Article 1-Table 1.PNG Table 1. Terminal Electron Accepting Processes Associated with the Aqueous Expressi(830 × 189 (95 KB)) - 18:39, 25 October 2016File:Heron-Article 1. Table 1.PNG Table 1. Characteristics of the three main thermal technologies.(719 × 292 (29 KB)) - 18:09, 26 October 2016File:Deeb-Article 1-Figure 1.JPG Figure 1. a) Structure of a perfluoroalkyl substance, PFOS, compared with b) the str(757 × 418 (29 KB)) - 15:17, 5 October 2016File:Deeb-Article 1-Table 1.JPG Table 1. Physical and chemical properties of PFOS and PFOA(1,068 × 589 (142 KB)) - 15:20, 5 October 2016File:Krug-Article 1. Table1 perchlorate rev.PNG Table 1. Perchlorate Physical and Chemical Properties(772 × 150 (15 KB)) - 14:35, 13 October 2016File:Maymo-Gatell-1999-Reductive dechlorination.pdf ...sh, T.; Zinder, S. H., Reductive dechlorination of chlorinated ethenes and 1,2-dichloroethane by "Dehalococcoides ethenogenes" 195. Appl. Environ. Micro(0 × 0 (105 KB)) - 19:41, 14 October 2016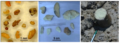
File:Taylor-A1-Figure 1.PNG Figure 1. Comp B pieces from a single partial detonation of a 155-mm round (Taylor e(1,029 × 365 (910 KB)) - 18:59, 17 October 2016File:EPA MNA of Inorganics Vol. 1.pdf Monitored Natural Attenuation of Inorganic Contaminants in Ground Water Vol. 1(0 × 0 (2.5 MB)) - 15:23, 18 October 2016File:Heron-Article 1. Figure 1.PNG Figure 1. Candidate Site for ISTR Application with Significant NAPL Source Material(614 × 357 (65 KB)) - 18:02, 26 October 2016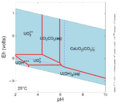
File:Denham-Article 2-Figure 1.PNG Figure 1: Aqueous speciation of uranium (diagram produced with The Geochemist’s Wo(790 × 671 (82 KB)) - 14:02, 4 November 2016File:Denham-Article 1-Figure 1. PNG.PNG Figure 1: Uranium’s complicated aqueous speciation (diagram produced with The Geoc(814 × 684 (82 KB)) - 19:16, 1 November 2016File:Dortch-2009-Methods for Tier 1 modeling training range ERCDC-EL-TR0911.pdf Dortch, M.S., J.A. Gerald, and B.E. Johnson. 2009. Methods for Tier 1 modeling with the Training Range Environmental Evaluation and Characterizat(0 × 0 (1.71 MB)) - 20:21, 4 November 2016File:Dortch-2012-Extension of cap for the Tier 1 and 2 approaches Training range ERDC-EL-TR-12-11.pdf ...E. Johnson, and J.A. Gerald. 2012. Extension of capabilities for the Tier 1 and Tier 2 Approaches within the Training Range Environmental Evaluation an(0 × 0 (510 KB)) - 20:45, 4 November 2016File:BJohnson-Article 1-Figure 1.PNG Figure 1. TREECS main screen as it appears for an application involving GIS data.(955 × 641 (434 KB)) - 19:57, 7 November 2016File:Favara-Article 1-Figure 1-Exhibit-2.jpg Figure 1. Comparison of linear versus holistic approach to integrating sustainabilit(2,819 × 1,183 (997 KB)) - 14:29, 9 November 2016File:No Author-Article 1-Table 1.PNG Table 1. Median lethal concentration of NTO to Ceriodaphnia (mg/L)(528 × 150 (7 KB)) - 13:38, 11 November 2016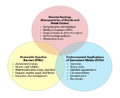
File:SalterBlanc Figure1 ZVI.png Figure 1. Overlap between areas of environmental technology related to ZVMs such as(826 × 675 (48 KB)) - 15:08, 18 November 2016
File:Salter-Blanc-Chemistry-Equation 1.PNG Saler-Blanc-chemistry-Equation 1(176 × 37 (911 bytes)) - 15:11, 18 November 2016File:Tratnyek-2010-Prospects for Remediation-ER1457.pdf ...G. O’Brien Johnson, T. DeVoe, P. Lee, 2010. Prospects for Remediation of 1,2,3-Trichloropropane by Natural and Engineered Abiotic Degradation Reaction(0 × 0 (2.22 MB)) - 21:58, 9 December 2016File:waterboards.ca.govgamadocscoc tcp123.pdf ...State Water Resources Control Board, 2016. Groundwater Information Sheet: 1,2,3-Trichloropropane (TCP)(0 × 0 (825 KB)) - 19:28, 16 December 2016File:INTERIM GUIDANCE FOR INVESTIGATING POTENTIAL 1,2,3-TRICHLOROPROPANE SOURCES.pdf Interim Guidance for Investigating Potential 1,2,3-Trichloropropane Sources in San Gabriel Valley Area 3(0 × 0 (1.29 MB)) - 19:32, 16 December 2016File:Maximum contaminant level recommendations for 1,2,3-trichloroporpane in drinking water.pdf Maximum contaminant level recommendations for 1,2,3-trichloroporpane in drinking water(0 × 0 (115 KB)) - 19:42, 16 December 2016File:1,2,3-Trichloropropane state of science.pdf 1,2,3-Trichloropropane State of the Science. Water Research Foundation.(0 × 0 (269 KB)) - 19:44, 16 December 2016File:123-TRICHLOROPROPANE ERD.PDF Integrated Risk Information System (IRIS), 2009. 1,2,3-Trichloropropane(0 × 0 (1.85 MB)) - 20:02, 16 December 2016File:Complete reductive dechlorinate of 1 2 dichloropropane by anaerobic bacteria.pdf Complete Reductive Dechlorination of 1,2-Dichloropropane(0 × 0 (129 KB)) - 14:11, 19 December 2016File:KFinneran-Article 1-Figure 1.PNG Fig. 1. Chemical structures of TNT, 2,4-DNT, Tetryl, DNAN, RDX, HMX, NTO and NQ.(730 × 445 (50 KB)) - 20:10, 4 January 2017File:KFinneran-Article 1-Table 1.PNG Table 1. Common US military explosives, propellants and IM formulations(599 × 569 (40 KB)) - 20:14, 4 January 2017File:OARS-2014-NTO OARS WEEL.pdf OARS, 2014. Workplace environmental exposure level (WEEL) 3-Nitro-1,2,4-Triazol-5-One (NTO). OARS, Cincinnati, OH.(0 × 0 (213 KB)) - 14:19, 5 January 2017File:Dontsova-Article 1-Figure 1.PNG Figure 1. Common energetic materials, modified from Taylor et al. (Taylor et al., 20(809 × 530 (29 KB)) - 19:15, 11 January 2017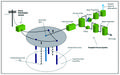
File:Heron EHR Fig1.jpg Figure 1. Electrical Resistance Heating Schematic (courtesy of TerraTherm).(1,917 × 1,205 (1.19 MB)) - 20:07, 16 January 2017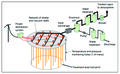
File:Heron ISTD Fig1.jpg Figure 1. In Situ Thermal Desorption (ISTD) schematic.(1,875 × 1,150 (1.47 MB)) - 18:36, 17 January 2017File:Freedman Article 1 Figure 1.PNG Figure 1. Generic hydrogenolysis; R = organic compound, X = halide.(938 × 116 (8 KB)) - 15:07, 19 January 2017File:Freedman Article 1 Figure 4.PNG Figure 4. Dihaloelimination of 1,2-dibromoethane to ethene.(636 × 242 (10 KB)) - 15:39, 19 January 2017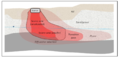
File:Heron Combined therm Fig1.PNG Figure 1. Sketch of a complex site with multiple zones with different levels of cont(972 × 470 (375 KB)) - 20:14, 17 January 2017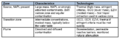
File:Heron Combined therm Table 1.PNG Table 1. Technologies applied in the different zones of a complex contaminated sit(902 × 292 (33 KB)) - 20:15, 17 January 2017File:ATSDR-1999-Tox profile for TPH.pdf ...ological profile for total petroleum hydrocarbons (TPH). Accessed December 1, 2016 from(0 × 0 (8.31 MB)) - 17:14, 24 January 2017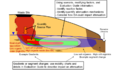
File:Denham-Article 4-Figure 1.PNG Figure 1. Example of an Attenuation Conceptual Model for metals contamination(1,007 × 611 (249 KB)) - 14:14, 30 January 2017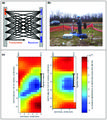
File:Slater Intro Fig3.jpg ...oil emulsion (VOE) amendment which produces a negative change in slowness (1/velocity) relative to background conditions (after Lane et al., 2006.(2,213 × 2,487 (3.25 MB)) - 15:23, 31 January 2017
File:Slater Intro Table1.jpg Table 1. Details of borehole geophysical logging methods commonly used at remediati(2,929 × 4,579 (2.24 MB)) - 15:29, 31 January 2017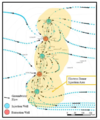
File:Krug-Article 2-Figure 1.PNG Figure 1. Example electron donor distribution during active amendment injection.(633 × 759 (577 KB)) - 19:47, 30 January 2017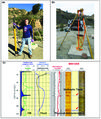
File:Slater Intro Fig1.jpg Figure 1. Example borehole logging equipment and log panel from the U. Connecticut L(1,871 × 2,213 (3.39 MB)) - 14:50, 31 January 2017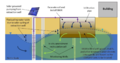
File:Gamlin SBGR Figure 1.PNG Figure 1. Typical subgrade biogeochemical reactor (SBGR) layout.(1,029 × 537 (561 KB)) - 21:53, 1 February 2017
File:Gamlin SBGR Table 1.PNG Table 1. SBGR Construction and Cost Details(925 × 120 (14 KB)) - 21:54, 1 February 2017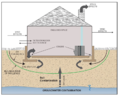
File:Lutes-Article1w2.Fig 1.PNG Figure 1. Key elements of vapor intrusion pathways(802 × 634 (553 KB)) - 20:31, 19 April 2018File:Newell-Article 1-Fig1r.JPG Figure 1. Hydraulic gradient (typically described in units of m/m or ft/ft) is the d(650 × 708 (139 KB)) - 01:12, 9 May 2018File:ITRC-2017. Remediation of Complex Sites..pdf ...latory Council (ITRC), 2017. Remediation Management of Complex Sites. RMCS-1. Washington, D.C. Interstate Technology & Regulatory Council Remediation Ma(0 × 0 (92 KB)) - 19:46, 10 May 2018File:2012-Li yixuan-MASc thesis Adaptation of KB-1 to Acidic Environments.pdf Li, J.J., 2012. Adaptation of a Dechlorinating Culture, KB-1, to Acidic Environments. M.S. Thesis, University of Toronto, Toronto, ON,(0 × 0 (1.31 MB)) - 14:43, 18 July 2018File:2008-ITRC-EACO Framework General.pdf ...gulatory Council), 2008. Enhanced Attenuation: Chlorinated Organics, EACO-1. Washington, D.C.: Interstate Technology & Regulatory Council, Enhanced Att(0 × 0 (90 KB)) - 13:09, 20 July 2018File:2008-ITRC-EACO 1.pdf ...gulatory Council), 2008. Enhanced Attenuation: Chlorinated Organics, EACO-1. Washington, D.C.: Interstate Technology & Regulatory Council, Enhanced Att(0 × 0 (1.89 MB)) - 14:24, 20 July 2018
File:Kamath1w2 Fig1.png Figure 1: Soils undergoing treatment at a Landfarming Facility(477 × 313 (318 KB)) - 18:36, 9 November 2018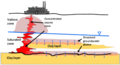
File:Falta1w2 Fig1.png Figure 1: Spread of CVOCs in the subsurface(894 × 486 (163 KB)) - 16:41, 5 November 2019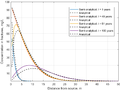
File:Falta1w2 Fig3.png Figure 3: Concentration profiles in fractures at 1, 49, 51 and 100 years.(875 × 656 (68 KB)) - 16:44, 5 November 2019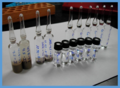
File:Allen-King1w2 Fig1a.png Figure 1. Batch reactor experiments (a, top) to generate points on a sorption isothe(391 × 287 (202 KB)) - 21:44, 18 February 2019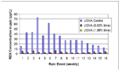
File:Johnson1w2 Fig1.png Figure 1: RDX concentrations in leachate by rain event for meso-scale lysimeters con(803 × 474 (26 KB)) - 22:00, 30 January 2019File:2011-ACOE-pwtb 200 1 95.pdf ...Learned, U.S. Army Corps of Engineers, Public Works Technical Bulletin 200-1-95.(0 × 0 (1.06 MB)) - 15:05, 1 February 2019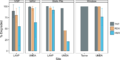
File:Craig1w2 Fig1.png ...ing soils from contaminated ammunition production sites. Error bars are ± 1 standard deviation. IVSP = in-vessel static pile; MAIV = mechanically agita(1,141 × 566 (38 KB)) - 16:28, 5 February 2019
File:Hatzinger1w2 Fig1.png Figure 1. NDMA chemical structure(642 × 420 (19 KB)) - 17:23, 11 February 2019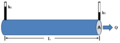
File:Liu1w2 Fig1.png Figure 1. Schematic of Darcy’s Law flow experiment.(929 × 330 (12 KB)) - 18:09, 5 March 2019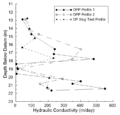
File:Liu1w2 Fig8.png ...les at GEMS. The slug test profile is located 2 m northwest of DPP profile 1, and 2 m southeast of DPP profile 2. (Butler, 2005)(774 × 741 (39 KB)) - 18:34, 5 March 2019File:2017-USEPA- Technical Fact Sheet.pdf US EPA, 2017. Technical Fact Sheet – 1,4-Dioxane. Publication number: EPA 505-F-17-001(0 × 0 (126 KB)) - 15:51, 25 April 2019File:1994-Parales-Degradation of 1,4-Dioxane by an Actinomycete in Pure Culture.pdf Parales, R.E., J.E. Adamus, N. White, and H.D. May, 1994. Dedegradation of 1,4-dioxane by an Actinomycete in pure culture. Applied and Environmental Mic(0 × 0 (829 KB)) - 20:11, 25 April 2019File:2016-Knappe-Occurrence of 1,4-dioxane in the Cape Fear River.pdf ...Cape Fear River watershed and effectiveness of water treatment options for 1,4-dioxane control. Water Resources Research Institute of The University of(0 × 0 (3.43 MB)) - 21:11, 25 April 2019File:2012-ASTDR. Toxicological profile for 1,4-dioxane.pdf ATSDR, 2012. Toxicological profile for 1,4-dioxane. Agency for Toxic Substances and Disease Registry(0 × 0 (6.82 MB)) - 19:17, 26 April 2019File:2001-Black-Occurrence of 1,4-dioxane in cosmetic raw materials....pdf Black, R.E., F.J. Hurley, and D.C. Havery, 2001. Occurrence of 1,4-dioxane in cosmetic raw materials and finished cosmetic products. Journal(0 × 0 (48 KB)) - 20:48, 26 April 2019File:1998-Ellis-Destroying 1,4-dioxane in byproduct streams formed during polyester.pdf Ellis, R.A. and J.S. Thomas, 1998. Destroying 1,4-dioxane in byproduct streams formed during polyester synthesis. United St(0 × 0 (606 KB)) - 21:08, 26 April 2019File:2012-Shangraw-Full-scale Treatment of 1,4-dioxane.pdf Shangraw, T. and W. Plaehn, 2012. Full-scale treatment of 1,4-dioxane using a bioreactor. Federal Remediation Technologies Roundtable M(0 × 0 (3.47 MB)) - 20:58, 1 May 2019File:2018-Evans-ER-201324 Cost & Performance Report.pdf .... Crimi, and N. Ruiz, 2018. Sustained in situ chemical oxidation (ISCO) of 1,4-dioxane and chlorinated VOCs using slow-release chemical oxidant cylinder(0 × 0 (2.02 MB)) - 16:39, 2 May 2019File:2017-Hinchee-1.4 Dioxane remediation by extreme soil XSVE ER-201326 Final Report.pdf Hinchee, R.E., P.C. Johnson, P.R. Dahlen, and D.R. Durris, 2017. 1,4-Dioxane remediation by extreme soil vapor extraction (XSVE). Final Report(0 × 0 (11.28 MB)) - 18:07, 2 May 2019
File:Weaver1w2fig1.png Figure 1 Typical conceptual models for vapor intrusion from a release of petroleum h(1,456 × 563 (598 KB)) - 13:31, 5 April 2019
File:Bekins1w2 Fig4.PNG ...>1,000 µg/L, Fe<0.5 mg/L; and (5) Sub-oxic – DO 100-1,000 µg/L, Fe 0.5-1.0 mg/L.(1,213 × 335 (100 KB)) - 17:54, 13 June 2019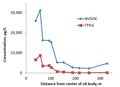
File:Bekins1w2 Fig5.jpg ...August 2016. Well locations and oil spill source location shown in Figure 1 of this article. Figure reprinted from McGuire, et al., 2018.(716 × 518 (39 KB)) - 17:56, 13 June 2019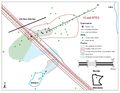
File:Bekins1w2 Fig1.jpg Figure 1. Map of the site located near Bemidji, MN, showing oil pipelines, location(947 × 731 (124 KB)) - 17:44, 13 June 2019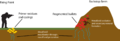
File:Barker1w2 Fig1.png Figure 1. Simplified schematic of shooting ranges with berm-style backstops that typ(1,366 × 462 (57 KB)) - 13:11, 17 July 2019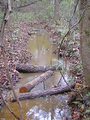
File:Griffiths1w2 Fig1.png Figure 1. CWD additions shortly after installation in a stream.(480 × 640 (818 KB)) - 14:01, 16 August 2019
File:Hall1w2Fig1.png Figure 1. Phytoplankton come in many shapes and sizes(798 × 563 (901 KB)) - 16:59, 13 November 2019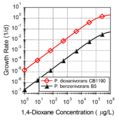
File:Mahendra1w2 Fig1.png Figure 1. Growth rates of two 14D metabolizers versus 14D concentration(823 × 844 (140 KB)) - 21:06, 15 October 2019
File:Hall1w2Fig2.png Figure 1. Phytoplankton come in many shapes and sizes(279 × 374 (109 KB)) - 17:00, 13 November 2019
File:Ghosh1w2Fig1.png Figure 1. Key exposure pathways for human health risk at contaminated sediment sites(815 × 600 (349 KB)) - 20:46, 12 December 2019File:ER-1422-FR (002).pdf ER-1422: Biodegradation of 1,4-Dioxane(0 × 0 (2.87 MB)) - 20:51, 17 October 2019File:2012-Parris-Global sea level rise scenarios for the US National Climate Assessment.pdf ...e scenarios for the US National Climate Assessment. NOAA Tech Memo OAR CPO-1. 37 pp.(0 × 0 (5.61 MB)) - 14:53, 19 December 2019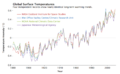
File:Kotamarthi1w2Fig1.png Figure 1: Global surface temperature anomalies for the past 100+ years compared to t(930 × 576 (133 KB)) - 20:55, 19 December 2019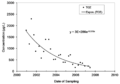
File:Wilson1w2Fig1.png Figure 1. Attenuation of Trichloroethene (TCE) over time in a monitoring well at a(1,020 × 713 (55 KB)) - 21:00, 9 January 2020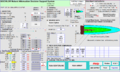
File:Wilson1w2Fig3.png Figure 3. The data input screen for BIOCHLOR before remediation with cis-1,2-Dichloroethene (DCE) and vinyl chloride (VC) source concentrations of 500(1,124 × 677 (458 KB)) - 21:14, 9 January 2020File:2017-Vlassopoulos-Evaluation Design and Construction.pdf ..., Syracuse, New York, USA. Journal of Marine Environmental Engineering, 10(1), pp. 13-27.(0 × 0 (6.56 MB)) - 21:40, 26 February 2020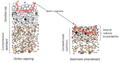
File:Ghosh2w2Fig1.png Figure 1. Use of activated carbon in an active cap (left) and incorporation into su(1,103 × 579 (92 KB)) - 14:21, 2 March 2020File:API2007 LDRM.pdf API, 2007. LNAPL Distribution and Recovery Model (LDRM), Volume 1: Distribution and Recovery of Petroleum Hydrocarbon Liquids in Porous Media(0 × 0 (1.08 MB)) - 21:06, 22 January 2020
File:Kirkman1w2Fig1.png Figure 1. LNAPL Distribution in a research sand tank(652 × 385 (487 KB)) - 20:03, 4 February 2020File:Lenhard2004 air-NAPL-water flow.pdf ...trongly water-wet porous media. Journal of Contaminant Hydrology, Vol. 73(1-4), pp 283-304(0 × 0 (367 KB)) - 21:44, 22 January 2020File:Lenhard2017 Estimating Subsurface LNAPL.pdf ...ed and Residual LNAPL. Journal of Contaminant Hydrology, Volume 205, Pages 1-11. DOI:(0 × 0 (1.24 MB)) - 21:45, 22 January 2020File:Weaver1995 HSSMv1.pdf ...d Provost, J.B., 1995. The Hydrocarbon Spill Screening Model (HSSM) Volume 1: User’s Guide. US EPA, publication EPA/600/R-94/039a, 229pp.(0 × 0 (2.01 MB)) - 21:52, 22 January 2020
File:Lotufo1w2Fig1.png Figure 1. Underwater munitions are derived from UXO and histrocial disposal practice(1,133 × 325 (659 KB)) - 19:57, 23 March 2020File:ITRC-2005 Overview of GW Remed for MTBE and TBA.pdf ...5. Overview of Groundwater Remediation Technologies for MTBE and TBA. MTBE-1. Interstate Technology & Regulatory Council, MTBE and Other Fuel Oxygenates(0 × 0 (2.37 MB)) - 13:14, 8 April 2020File:ITRC-2009b Evaluating NSDZ at Sites with LNAPL.pdf ...09b. Evaluating Natural Source Zone Depletion at Sites with LNAPL. LNAPL-1. Interstate Technology and Regulatory Council, LNAPLs Team, Washington, DC.(0 × 0 (1.32 MB)) - 13:21, 8 April 2020File:Jenkins-2008 ERDC TR-08-1.pdf ...opellant Residues on Testing and Training Ranges: Final Report. ERDC TR-08-1. Vicksburg MS, USA.(0 × 0 (25.98 MB)) - 18:43, 24 April 2020File:Walsh-2009 ERDC-CRREL SR-09-1.pdf ...ment Center / Cold Regions Research and Engineering Lab (ERDC/CRREL) SR-09-1, Hanover, NH, USA(0 × 0 (915 KB)) - 19:09, 24 April 2020
File:Beal1w2 Fig1.png Figure 1: Downrange distance of visible propellant plume on snow from the firing of(365 × 442 (23 KB)) - 20:28, 27 April 2020


