Difference between revisions of "File:Liu1w2 Fig6C.png"
Debra Tabron (talk | contribs) (Figure 6C. Six example DPIL (red curve) ''K'' profiles calibrated by collocated Direct Push Permeameter tests (blue bars) at the MacroDispersion Experiment (MADE) site, Columbus, MS. The dashed curves represent the upper ''K'' limit for continuous DPIL...) |
(No difference)
|
Latest revision as of 13:31, 5 March 2019
Summary
Figure 6C. Six example DPIL (red curve) K profiles calibrated by collocated Direct Push Permeameter tests (blue bars) at the MacroDispersion Experiment (MADE) site, Columbus, MS. The dashed curves represent the upper K limit for continuous DPIL under the given tool operating procedure (Liu et al., 2009).
File history
Click on a date/time to view the file as it appeared at that time.
| Date/Time | Thumbnail | Dimensions | User | Comment | |
|---|---|---|---|---|---|
| current | 13:31, 5 March 2019 | 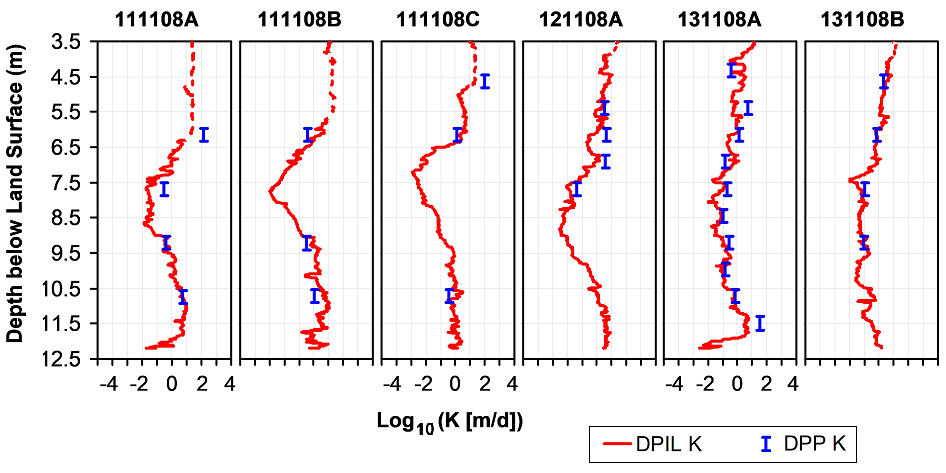 | 946 × 473 (81 KB) | Debra Tabron (talk | contribs) | Figure 6C. Six example DPIL (red curve) ''K'' profiles calibrated by collocated Direct Push Permeameter tests (blue bars) at the MacroDispersion Experiment (MADE) site, Columbus, MS. The dashed curves represent the upper ''K'' limit for continuous DPIL... |
- You cannot overwrite this file.
File usage
The following page links to this file: