Difference between revisions of "File:Truex 1 Fig2.png"
Debra Tabron (talk | contribs) (Figure 2. Comparison of amendment distribution using electrical resistivity tomography (ERT) images.) |
(No difference)
|
Latest revision as of 15:46, 30 June 2016
Figure 2. Comparison of amendment distribution using electrical resistivity tomography (ERT) images.
File history
Click on a date/time to view the file as it appeared at that time.
| Date/Time | Thumbnail | Dimensions | User | Comment | |
|---|---|---|---|---|---|
| current | 15:46, 30 June 2016 | 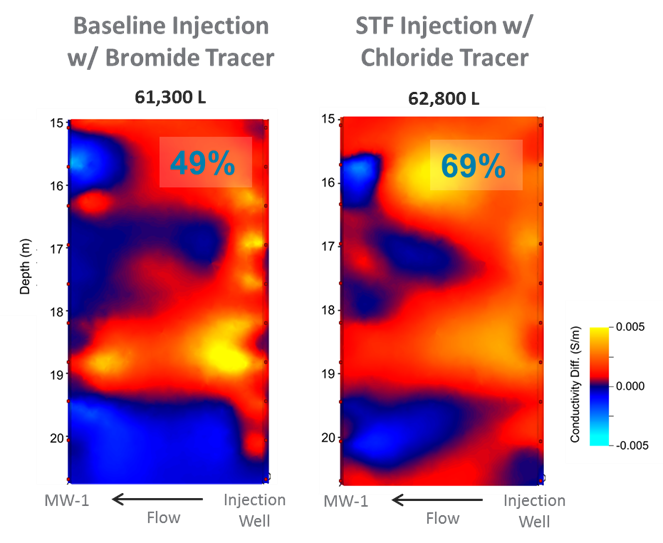 | 663 × 543 (253 KB) | Debra Tabron (talk | contribs) | Figure 2. Comparison of amendment distribution using electrical resistivity tomography (ERT) images. |
- You cannot overwrite this file.
File usage
The following page links to this file: