Difference between revisions of "File:Slater CaseStudies Fig3.jpg"
Debra Tabron (talk | contribs) (Figure 3. Example 3D time-lapse ERT images showing bioamendment emplacement and movement, seen as increased bulk electrical conductivity (first column), followed by later increase in bulk conductivity arising from FeS precipitation resulting from micro...) |
(No difference)
|
Latest revision as of 14:17, 31 January 2017
Figure 3. Example 3D time-lapse ERT images showing bioamendment emplacement and movement, seen as increased bulk electrical conductivity (first column), followed by later increase in bulk conductivity arising from FeS precipitation resulting from microbial activity (second column) (after Johnson et al., 2015b) (from ESTCP project ER-200717).
File history
Click on a date/time to view the file as it appeared at that time.
| Date/Time | Thumbnail | Dimensions | User | Comment | |
|---|---|---|---|---|---|
| current | 14:17, 31 January 2017 | 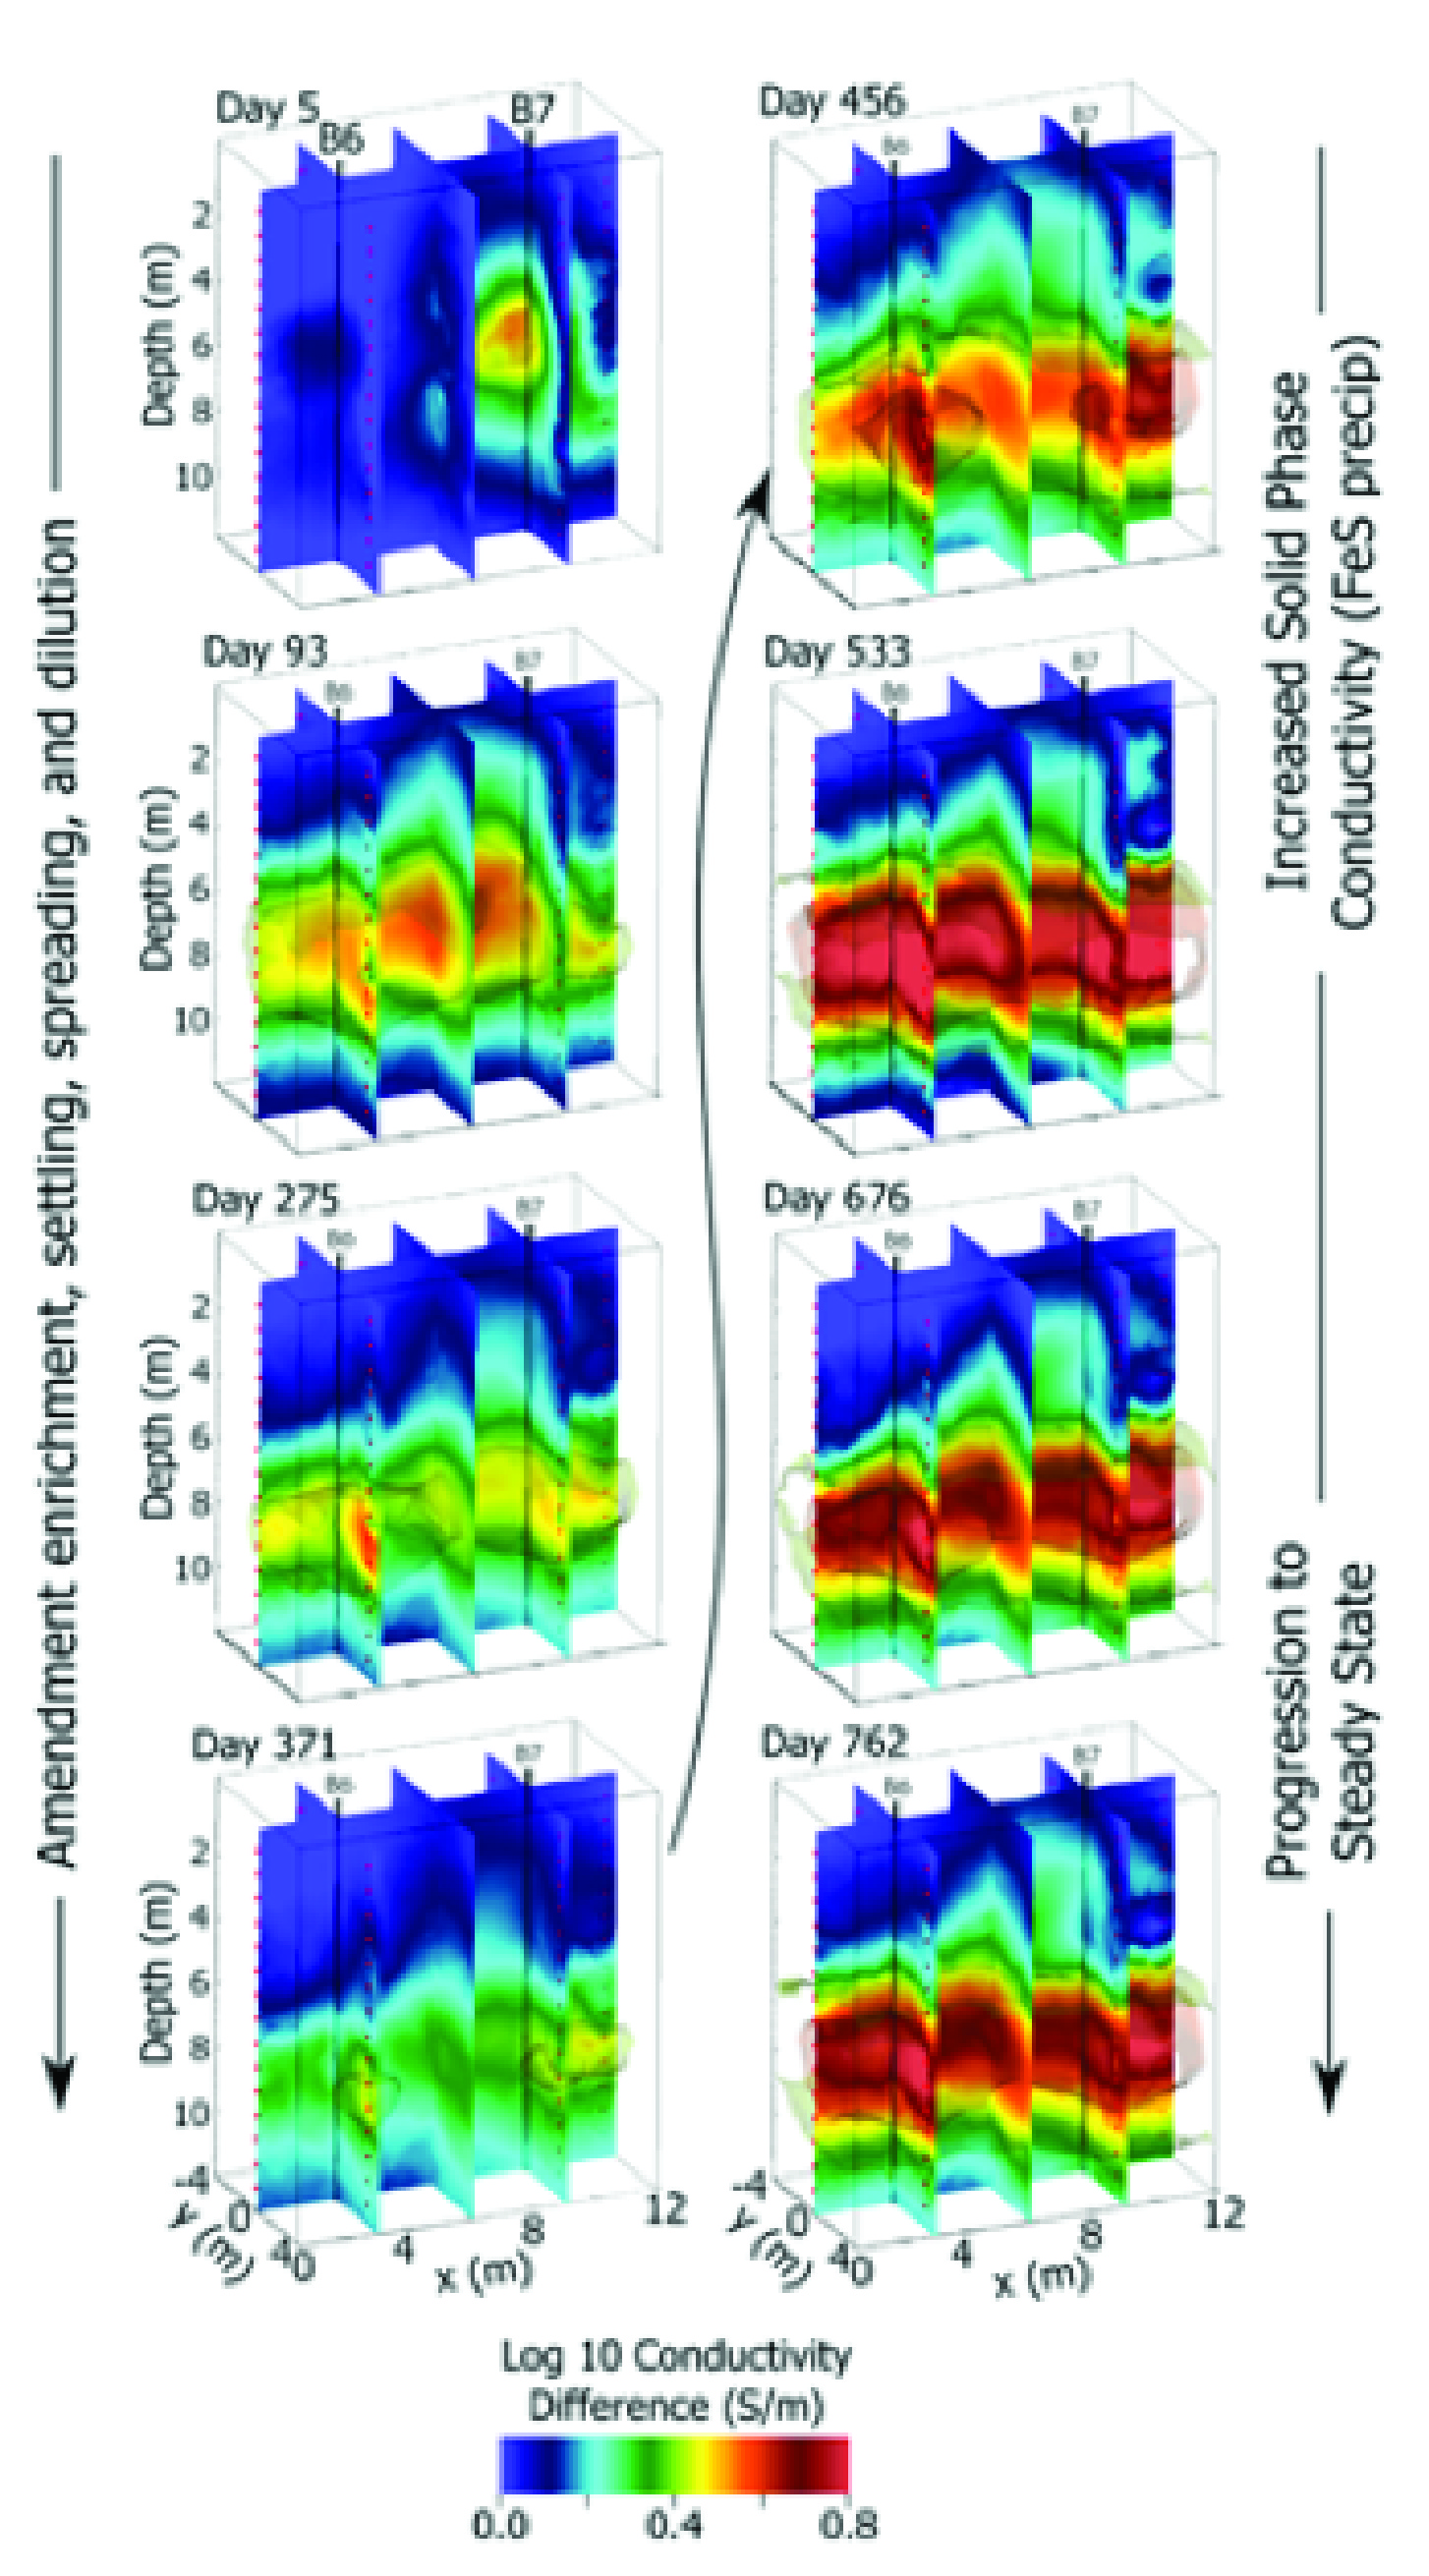 | 1,454 × 2,621 (2.5 MB) | Debra Tabron (talk | contribs) | Figure 3. Example 3D time-lapse ERT images showing bioamendment emplacement and movement, seen as increased bulk electrical conductivity (first column), followed by later increase in bulk conductivity arising from FeS precipitation resulting from micro... |
- You cannot overwrite this file.
File usage
The following page links to this file: