Difference between revisions of "Advection and Groundwater Flow"
(→Mobile Porosity) |
|||
| Line 104: | Line 104: | ||
|Poorly sorted sand and gravel||0.085 | |Poorly sorted sand and gravel||0.085 | ||
|- | |- | ||
| − | |Poorly sorted sand and gravel||0.04 | + | |Poorly sorted sand and gravel||0.04-0.07 |
|- | |- | ||
|Poorly sorted sand and gravel||0.09 | |Poorly sorted sand and gravel||0.09 | ||
|- | |- | ||
| − | |Fractured sandstone||0.001 | + | |Fractured sandstone||0.001-0.007 |
|- | |- | ||
|Alluvial formation||0.102 | |Alluvial formation||0.102 | ||
| Line 114: | Line 114: | ||
|Glacial outwash||0.145 | |Glacial outwash||0.145 | ||
|- | |- | ||
| − | |Weathered mudstone regolith||0.07 | + | |Weathered mudstone regolith||0.07-0.10 |
|- | |- | ||
|Alluvial formation||0.07 | |Alluvial formation||0.07 | ||
| Line 122: | Line 122: | ||
|Silty sand||0.05 | |Silty sand||0.05 | ||
|- | |- | ||
| − | |Fractured sandstone||0.0008 | + | |Fractured sandstone||0.0008-0.001 |
|- | |- | ||
|Alluvium, sand and gravel||0.017 | |Alluvium, sand and gravel||0.017 | ||
|- | |- | ||
| − | |Alluvium, poorly sorted sand and gravel||0.003 | + | |Alluvium, poorly sorted sand and gravel||0.003-0.017 |
|- | |- | ||
| − | |Alluvium, sand and gravel||0.11 | + | |Alluvium, sand and gravel||0.11-0.18 |
|- | |- | ||
| − | |Siltstone, sandstone, mudstone||0.01 | + | |Siltstone, sandstone, mudstone||0.01-0.05 |
|} | |} | ||
| Line 136: | Line 136: | ||
A data mining analysis of 43 sites in California by Kulkarni et al. (2020) showed that on average 90% of the groundwater flow occurred in about 30% of cross sectional area perpendicular to groundwater flow. These data provided “moderate (but not confirmatory) support for the mobile porosity concept.”<ref name="Kulkarni2020">Kulkarni, P.R., Godwin, W.R., Long, J.A., Newell, R.C., Newell, C.J., 2020. How much heterogeneity? Flow versus area from a big data perspective. Remediation 30(2), pp. 15-23. [https://doi.org/10.1002/rem.21639 DOI: 10.1002/rem.21639] [//www.enviro.wiki/images/9/9b/Kulkarni2020.pdf Report.pdf]</ref> | A data mining analysis of 43 sites in California by Kulkarni et al. (2020) showed that on average 90% of the groundwater flow occurred in about 30% of cross sectional area perpendicular to groundwater flow. These data provided “moderate (but not confirmatory) support for the mobile porosity concept.”<ref name="Kulkarni2020">Kulkarni, P.R., Godwin, W.R., Long, J.A., Newell, R.C., Newell, C.J., 2020. How much heterogeneity? Flow versus area from a big data perspective. Remediation 30(2), pp. 15-23. [https://doi.org/10.1002/rem.21639 DOI: 10.1002/rem.21639] [//www.enviro.wiki/images/9/9b/Kulkarni2020.pdf Report.pdf]</ref> | ||
| − | <br clear="left" /> | + | <br clear="left" /> |
| − | |||
==References== | ==References== | ||
Revision as of 20:12, 17 December 2020
Groundwater migrates from areas of higher hydraulic head toward lower hydraulic head, transporting dissolved solutes through the combined processes of advection and dispersion. Advection refers to the bulk movement of solutes carried by flowing groundwater. Dispersion refers to the spreading of the contaminant plume from highly concentrated areas to less concentrated areas. In many groundwater transport models, solute transport is described by the advection-dispersion-reaction equation in which dispersion coefficients can be calculated as the sum of molecular diffusion, mechanical dispersion, and macrodispersion.
Related Article(s):
CONTRIBUTOR(S): Dr. Charles Newell and Dr. Robert Borden
Key Resource(s):
- Groundwater[1], Freeze and Cherry, 1979.
- Hydrogeologic Properties of Earth Materials and Principals of Groundwater Flow[2], Woessner and Poeter, 2020.
Groundwater Flow

Groundwater flows from areas of higher hydraulic head (a measure of pressure and gravitational energy) toward areas of lower hydraulic head (Figure 1). The rate of change (slope) of the hydraulic head is known as the hydraulic gradient. If groundwater is flowing and contains dissolved contaminants it can transport the contaminants from areas with high hydraulic head toward lower hydraulic head zones, or “downgradient”.
Darcy's Law
| Aquifer Material | Total Porosity (dimensionless) |
Effective Porosity (dimensionless) |
Hydraulic Conductivity (meters/second) |
|---|---|---|---|
| Unconsolidated | |||
| Gravel | 0.25 — 0.44 | 0.13 — 0.44 | 3×10⁻⁴ — 3×10⁻² |
| Coarse Sand | 0.31 — 0.46 | 0.18 — 0.43 | 9×10⁻⁷ — 6×10⁻³ |
| Medium Sand | — | 0.16 — 0.46 | 9×10⁻⁷ — 5×10⁻⁴ |
| Fine Sand | 0.25 — 0.53 | 0.01 — 0.46 | 2×10⁻⁷ — 2×10⁻⁴ |
| Silt, Loess | 0.35 — 0.50 | 0.01 — 0.39 | 1×10⁻⁹ — 2×10⁻⁵ |
| Clay | 0.40 — 0.70 | 0.01 — 0.18 | 1×10-11 — 4.7×10⁻⁹ |
| Sedimentary and Crystalline Rocks | |||
| Karst and Reef Limestone | 0.05 — 0.50 | — | 1×10⁻⁶ — 2×10⁻² |
| Limestone, Dolomite | 0.00 — 0.20 | 0.01 — 0.24 | 1×10⁻⁹ — 6×10⁻⁶ |
| Sandstone | 0.05 — 0.30 | 0.10 — 0.30 | 3×10⁻¹⁰ — 6×10⁻⁶ |
| Siltstone | — | 0.21 — 0.41 | 1×10-11 — 1.4×10⁻⁸ |
| Basalt | 0.05 — 0.50 | — | 2×10-11 — 2×10⁻² |
| Fractured Crystalline Rock | 0.00 — 0.10 | — | 8×10⁻⁹ — 3×10⁻⁴ |
| Weathered Granite | 0.34 — 0.57 | — | 3.3×10⁻⁶ — 5.2×10⁻⁵ |
| Unfractured Crystalline Rock | 0.00 — 0.05 | — | 3×10-14 — 2×10⁻¹⁰ |
In unconsolidated geologic settings (gravel, sand, silt, and clay) and highly fractured systems, the rate of groundwater movement can be expressed using Darcy’s Law. This law is a fundamental mathematical relationship in the groundwater field and can be expressed this way:
- Where:
- Q = Flow rate (Volume of groundwater flow per time, such as m3/yr)
- A = Cross sectional area perpendicular to groundwater flow (length2, such as m2)
- VD = “Darcy Velocity”; describes groundwater flow as the volume of flow through a unit of cross-sectional area (units of length per time, such as ft/yr)
- K = Hydraulic Conductivity (sometimes called “permeability”) (length per time)
- ΔH = Difference in hydraulic head between two lateral points (length)
- ΔL = Distance between two lateral points (length)
- Where:
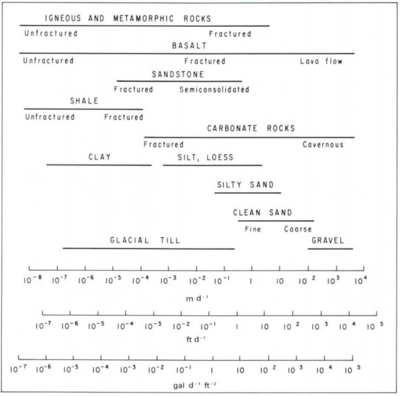
Hydraulic conductivity (Table 1 and Figure 2) is a measure of how easily groundwater flows through a porous medium, or alternatively, how much energy it takes to force water through a porous medium. For example, fine sand has smaller pores with more frictional resistance to flow, and therefore lower hydraulic conductivity compared to coarse sand, which has larger pores with less resistance to flow (Figure 2).

Darcy’s Law was first described by Henry Darcy (1856)[6] in a report regarding a water supply system he designed for the city of Dijon, France. Based on his experiments, he concluded that the amount of water flowing through a closed tube of sand (dark grey box in Figure 3) depends on (a) the change in the hydraulic head between the inlet and outlet of the tube, and (b) the hydraulic conductivity of the sand in the tube. Groundwater flows rapidly in the case of higher pressure (ΔH) or more permeable materials such as gravel or coarse sand, but flows slowly when the pressure difference is lower or the material is less permeable, such as fine sand or silt.
Since Darcy’s time, Darcy’s Law has been extended to develop a useful variation of Darcy's formula that is used to to calculate the actual velocity that the groundwater is moving in units such as meters traveled per year. This quantity is called “interstitial velocity” or “seepage velocity” and is calculated by dividing the Darcy Velocity (flow per unit area) by the actual open pore area where groundwater is flowing, the “effective porosity” (Table 1):
- Where:
- VS = “interstitial velocity” or “seepage velocity” (units of length per time, such as m/sec)
- VD = “Darcy Velocity”; describes groundwater flow as the volume of flow per unit area per time (also units of length per time)
- ne = Effective porosity - fraction of cross section available for groundwater flow (unitless)
- VS = “interstitial velocity” or “seepage velocity” (units of length per time, such as m/sec)
Effective porosity is smaller than total porosity. The difference is that total porosity includes some dead-end pores that do not support groundwater. Typical values for total and effective porosity are shown in Table 1.
Darcy Velocity and Seepage Velocity
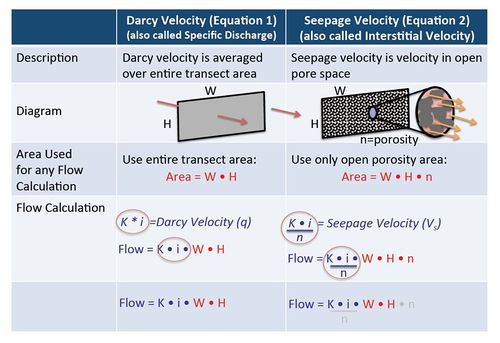
In groundwater calculations, Darcy Velocity and Seepage Velocity are used for different purposes. For any calculation where the actual flow rate in units of volume per time (such as liters per day or gallons per minute) is involved, then the original Darcy Equation should be used (calculate VD, Equation 1) without using effective porosity. When calculating solute travel time however, the seepage velocity calculation (VS, Equation 2) must be used and an estimate of effective porosity is required. Figure 4 illustrates the differences between Darcy Velocity and Seepage Velocity.
Mobile Porosity
| Aquifer Material | Mobile Porosity (volume fraction) |
|---|---|
| Poorly sorted sand and gravel | 0.085 |
| Poorly sorted sand and gravel | 0.04-0.07 |
| Poorly sorted sand and gravel | 0.09 |
| Fractured sandstone | 0.001-0.007 |
| Alluvial formation | 0.102 |
| Glacial outwash | 0.145 |
| Weathered mudstone regolith | 0.07-0.10 |
| Alluvial formation | 0.07 |
| Alluvial formation | 0.07 |
| Silty sand | 0.05 |
| Fractured sandstone | 0.0008-0.001 |
| Alluvium, sand and gravel | 0.017 |
| Alluvium, poorly sorted sand and gravel | 0.003-0.017 |
| Alluvium, sand and gravel | 0.11-0.18 |
| Siltstone, sandstone, mudstone | 0.01-0.05 |
Payne et al. (2008) reported the results from multiple short-term tracer tests conducted to aid the design of amendment injection systems[7]. In these tests, the dissolved solutes were observed to migrate more rapidly through the aquifer than could be explained with typically reported values of ne. They concluded that the heterogeneity of unconsolidated formations results in a relatively small area of an aquifer cross section carrying most of the water, and therefore solutes migrate more rapidly than expected. Based on these results, they recommend that a quantity called “mobile porosity” should be used in place of ne in equation 2 for calculating solute transport velocities. Based on 15 different tracer tests, typical values of mobile porosity range from 0.02 to 0.10 (Table 2).
A data mining analysis of 43 sites in California by Kulkarni et al. (2020) showed that on average 90% of the groundwater flow occurred in about 30% of cross sectional area perpendicular to groundwater flow. These data provided “moderate (but not confirmatory) support for the mobile porosity concept.”[8]
References
- ^ 1.0 1.1 Freeze, A., and Cherry, J., 1979. Groundwater, Prentice-Hall, Englewood Cliffs, New Jersey, 604 pages. Free download from Hydrogeologists Without Borders.
- ^ Woessner, W.W., and Poeter, E.P., 2020. Properties of Earth Materials and Principals of Groundwater Flow, The Groundwater Project, Guelph, Ontario, 207 pages. Free download from The Groundwater Project.
- ^ Domenico, P.A. and Schwartz, F.W., 1997. Physical and Chemical Hydrogeology, 2nd Ed. John Wiley & Sons, 528 pgs. ISBN 978-0-471-59762-9. Available from: Wiley
- ^ McWhorter, D.B. and Sunada, D.K., 1977. Ground-water hydrology and hydraulics. Water Resources Publications, LLC, Highlands Ranch, Colorado, 304 pgs. ISBN-13: 978-1-887201-61-2 Available from: Water Resources Publications
- ^ Heath, R.C., 1983. Basic ground-water hydrology, U.S. Geological Survey Water-Supply Paper 2220, 86 pgs. Report pdf
- ^ Brown, G.O., 2002. Henry Darcy and the making of a law. Water Resources Research, 38(7), p. 1106. DOI: 10.1029/2001WR000727 Report.pdf
- ^ 7.0 7.1 Payne, F.C., Quinnan, J.A. and Potter, S.T., 2008. Remediation Hydraulics. CRC Press. ISBN 9780849372490 Available from: CRC Press
- ^ Kulkarni, P.R., Godwin, W.R., Long, J.A., Newell, R.C., Newell, C.J., 2020. How much heterogeneity? Flow versus area from a big data perspective. Remediation 30(2), pp. 15-23. DOI: 10.1002/rem.21639 Report.pdf


