File list
This special page shows all uploaded files.
| Date | Name | Thumbnail | Size | User | Description | Versions |
|---|---|---|---|---|---|---|
| 10:34, 9 November 2016 | Favara-Article 1-Figure 2.PNG (file) |  |
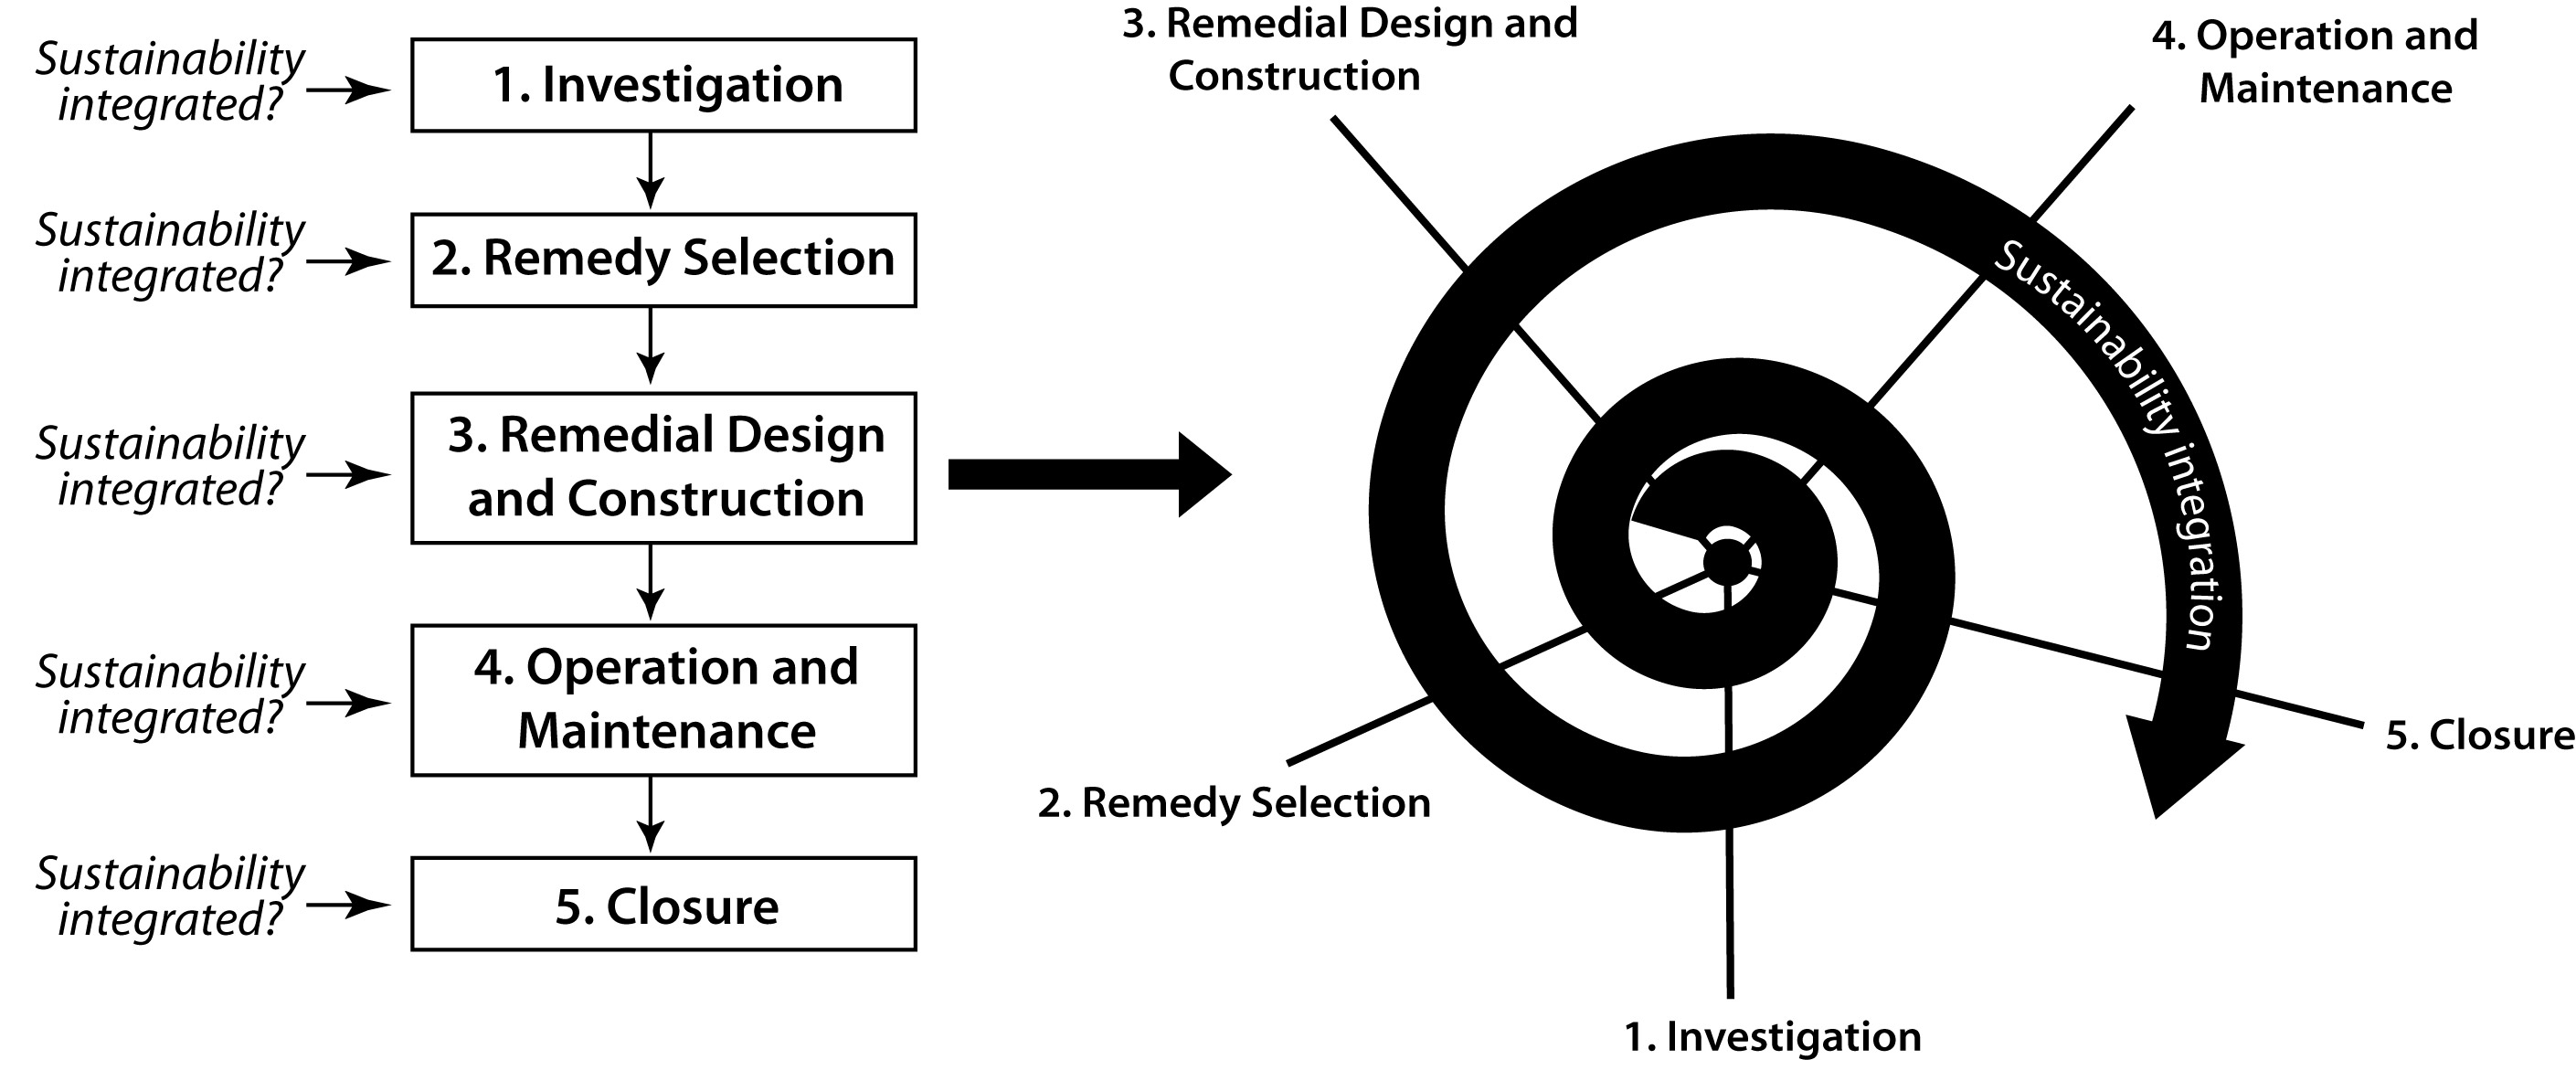
33 KB | Debra Tabron | Figure 2. Life-cycle phases of remediation projects and where footprint assessments and LCAs can be implemented. Reprinted, with permission, from E2893-16, Standard Guide for Greener Cleanups, copyright ASTM International, 100 Barr Harbor Drive, West C... | 1 |
| 10:29, 9 November 2016 | Favara-Article 1-Figure 1-Exhibit-2.jpg (file) |  |
997 KB | Debra Tabron | Figure 1. Comparison of linear versus holistic approach to integrating sustainability into projects (from Holland et al, 2011 | 1 |
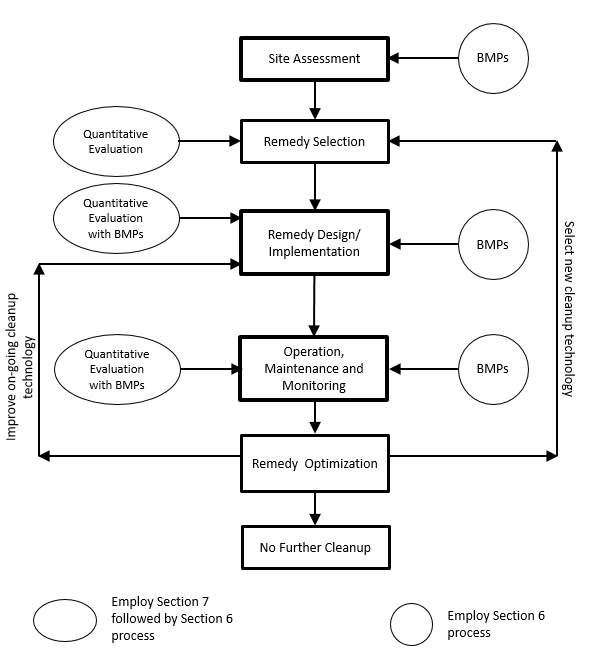
| 17:33, 8 November 2016 | USNAVY-2016-Tech Memo TM-NAVFAC-EXWC-EV-1601.pdf (file) | 809 KB | Debra Tabron | US Navy. 2016. Technical Memorandum TM-NAVFAC-EXWC-EV-1601. Green and Sustainable Remediation Best Management Practices. | 1 | |
| 12:52, 8 November 2016 | USACE-2012-Evaluation of Consideration and inc. of GSR.pdf (file) | 5.4 MB | Debra Tabron | US Army Corp of Engineers (USACE), 2012. Evaluation of Consideration and Incorporation of Green and Sustainable Remediation (GSR) Practices in Army Environmental Remediation. | 1 | |
| 10:49, 8 November 2016 | ESTCP-2013-Quantifying Life Cycle envl Footprints...ER-201127.pdf (file) | 6.8 MB | Debra Tabron | ESTCP, 2013. Quantifying Life Cycle Environmental Footprints of Soil and Groundwater Remedies. ER-201127 | 1 | |
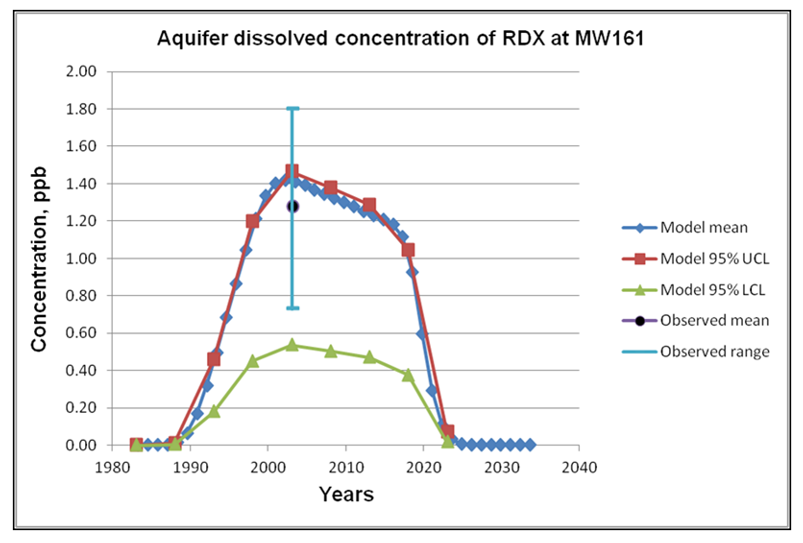
| 16:00, 7 November 2016 | BJohnson-Article 1-Figure 4.PNG (file) |  |
89 KB | Debra Tabron | Figure 4. Computed and measured groundwater concentrations of RDX at MW161 down gradient of Demolition Area 2, MMR, with upper (UCL) and lower (LCL) confidence limits for uncertainty of RDX degradation rate. | 1 |
| 15:59, 7 November 2016 | BJohnson-Article 1-Figure 3.PNG (file) |  |
95 KB | Debra Tabron | Figure 3. CSM as modeled in TREECS™ with Advanced Tier 2 option for Camp Pendleton, CA | 1 |
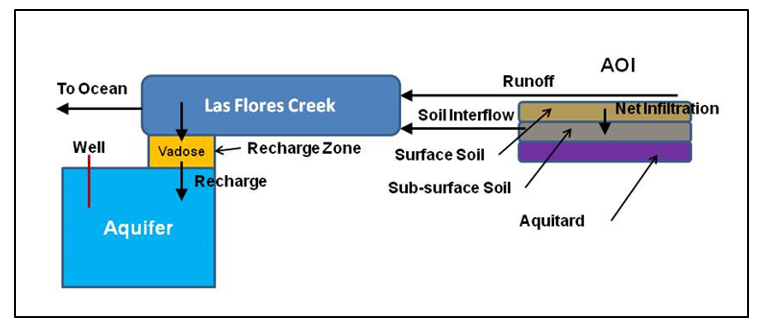
| 15:58, 7 November 2016 | BJohnson-Article 1-Figure 2.PNG (file) |  |
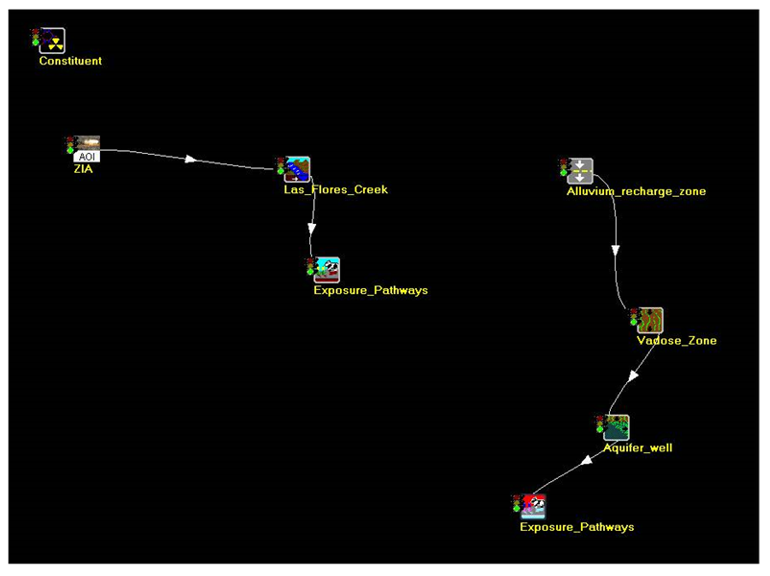
98 KB | Debra Tabron | Figure 2. Conceptual Site Model used with TREECS™ Advanced Tier 2 for the Zulu Impact Area (ZIA) and receiving waters, Camp Pendleton, CA. The area of interest (AOI) is the ZIA. | 1 |
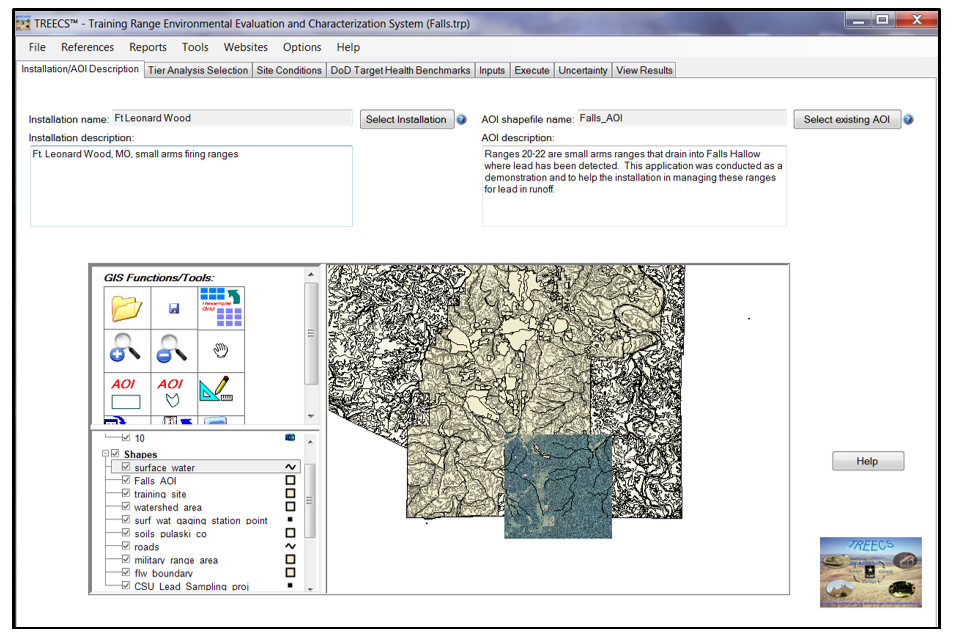
| 15:57, 7 November 2016 | BJohnson-Article 1-Figure 1.PNG (file) |  |
434 KB | Debra Tabron | Figure 1. TREECS main screen as it appears for an application involving GIS data. | 1 |
| 14:18, 7 November 2016 | Johnson-2014a-Hydrology Model Formulation.ERDC.EL TR-14-2.pdf (file) | 562 KB | Debra Tabron | Johnson, B.E., and M.S. Dortch. 2014a. Hydrology model formulation within the Training Range Environmental Evaluation and Characterization System (TREECS™). ERDC/EL TR-14-2, U.S. Army Engineer Research and Development Center, Vicksburg, MS. | 1 | |
| 13:59, 7 November 2016 | Gerald-2012-User guide for applying the training range Evnl Eval.Char sys.pdf (file) | 4.76 MB | Debra Tabron | Gerald, J.A., B.E. Johnson, and M.S. Dortch. 2012. User guide for applying the Training Range Environmental Evaluation and Characterization System (TREECS™). ERDC/EL TR-12-16, U.S. Army Engineer Research and Development Center, Vicksburg, MS | 1 | |
| 11:28, 7 November 2016 | Dortch-2015-Modules for modeling firing range.pdf (file) | 600 KB | Debra Tabron | Dortch, M.S. and Gerald, J.A., 2015. Modules for modeling firing range best management practices within TREECS™ (No. ERDC/EL-TR-15-7). Engineer Research and Development Center Vicksburg MS Environmental Lab. | 1 | |
| 10:53, 7 November 2016 | Dortch-2014-Eval of time-varying hydrology...ERD-EL-CR-14-3.pdf (file) | 2.01 MB | Debra Tabron | Dortch, M.S. 2014. Evaluation of time-varying hydrology within the Training Range Environmental Evaluation and Characterization System (TREECS™). ERDC/EL CR-14-3, U.S. Army Engineer Research and Development Center, Vicksburg, MS. | 1 | |
| 16:59, 4 November 2016 | Dortch-2013b-Modeling firing range...ERDC-EL TR-13-6.pdf (file) | 1.05 MB | Debra Tabron | Dortch, M.S., B.E. Johnson, and J.A. Gerald. 2013b. Modeling firing range best management practices with TREECS™. ERDC/EL TR-13-6, U.S. Army Engineer Research and Development Center, Vicksburg, MS. | 1 | |
| 16:45, 4 November 2016 | Dortch-2012-Extension of cap for the Tier 1 and 2 approaches Training range ERDC-EL-TR-12-11.pdf (file) | 510 KB | Debra Tabron | Dortch, M.S., B.E. Johnson, and J.A. Gerald. 2012. Extension of capabilities for the Tier 1 and Tier 2 Approaches within the Training Range Environmental Evaluation and Characterization System (TREECS™). ERDC/EL TR-12-11, U.S. Army Engineer Research... | 1 | |
| 16:26, 4 November 2016 | Dortch-2011a-Methods for Tier 2 modeling Training Range ERDC-EL-TR112.pdf (file) | 1.94 MB | Debra Tabron | Dortch, M.S., B.E. Johnson, Z. Zhang, and J.A. Gerald. 2011a. Methods for Tier 2 modeling within the Training Range Environmental Evaluation and Characterization System (TREECS™). ERDC/EL TR-11-2, U.S. Army Engineer Research and Development Center, V... | 1 | |
| 16:21, 4 November 2016 | Dortch-2009-Methods for Tier 1 modeling training range ERCDC-EL-TR0911.pdf (file) | 1.71 MB | Debra Tabron | Dortch, M.S., J.A. Gerald, and B.E. Johnson. 2009. Methods for Tier 1 modeling with the Training Range Environmental Evaluation and Characterization System. ERDC/EL TR-09-11, U.S. Army Engineer Research and Development Center, Vicksburg, MS. | 1 | |
| 14:10, 4 November 2016 | Davis-Solubility+Product+Constant-Kathryn Rashe, Lisa Peterson.pdf (file) | 117 KB | Debra Tabron | U.C. Davis/ Solubility Product Constant. Contributors. Kathryn Rashe, Lisa Peterson | 1 | |
| 13:39, 4 November 2016 | Davis-The+Equilibrium+Constant-Heather Voigt.pdf (file) | 140 KB | Debra Tabron | U.C. Davis, ChemWiki. The Equilibrium Constant. Contributor: Heather Voigt. Updated: July 12, 2016. | 1 | |
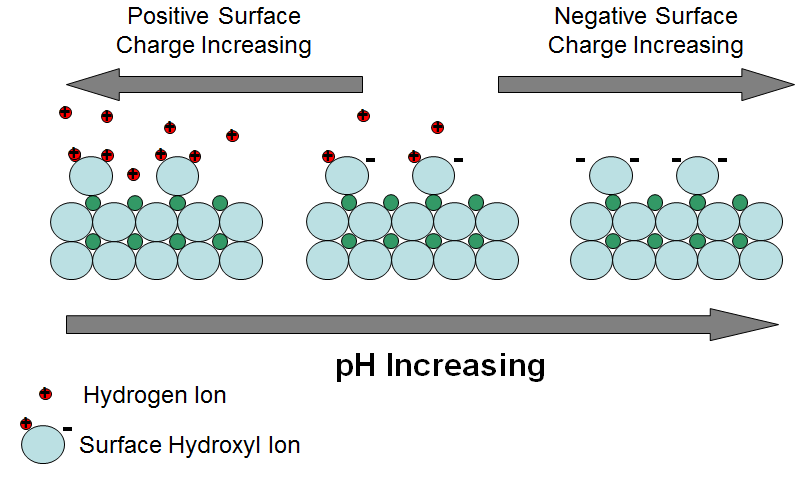
| 10:03, 4 November 2016 | Denham-Article 2-Figure 2.PNG (file) |  |
30 KB | Debra Tabron | Figure 2: Mineral surface exchanging hydrogen ions with varying pH | 1 |
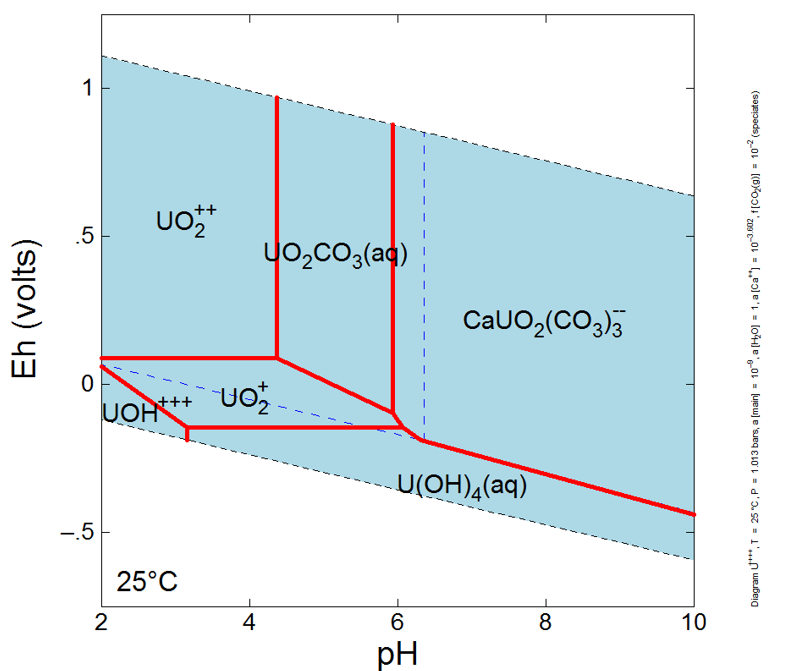
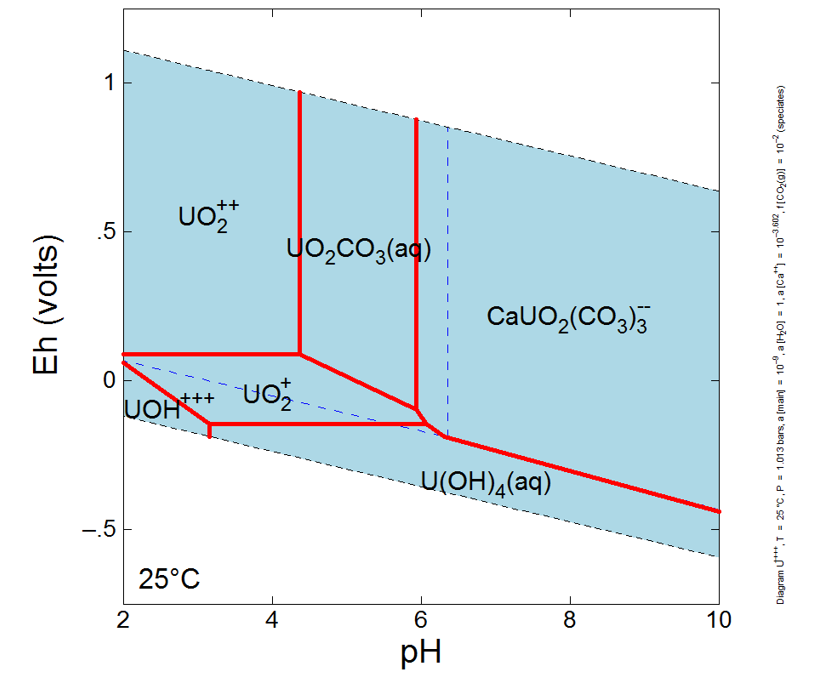
| 10:02, 4 November 2016 | Denham-Article 2-Figure 1.PNG (file) |  |
82 KB | Debra Tabron | Figure 1: Aqueous speciation of uranium (diagram produced with The Geochemist’s Workbench® | 1 |
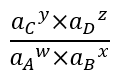
| 10:00, 4 November 2016 | Denham-Article 2-Equation 1.PNG (file) |  |
2 KB | Debra Tabron | 1 | |
| 13:30, 3 November 2016 | NABIR-2003-Bioremediation of Metals and Radionuclides.pdf (file) | 2.75 MB | Debra Tabron | NABIR, 2003. Bioremediation of Metals and Radionuclides – What It Is And How It Works. LBNL-42595, Lawrence Berkeley National Laboratory, for the Natural and Accelerated Bioremediation Research Program, Office of Science, U.S. Department of Energy | 1 | |
| 15:16, 1 November 2016 | Denham-Article 1-Figure 1. PNG.PNG (file) |  |
82 KB | Debra Tabron | Figure 1: Uranium’s complicated aqueous speciation (diagram produced with The Geochemist’s Workbench® PCO2 = 0.01 atm., [Ca] = 10 (mg/L). | 1 |
| 15:47, 27 October 2016 | Walsh-2006-EnergeticResiduesDeposition.PDF (file) | 1.47 MB | Astenger | 1 | ||
| 13:52, 27 October 2016 | Morgan-1988-Ninety-day Subchronic.pdf (file) | 6.11 MB | Astenger | 1 | ||
| 16:03, 26 October 2016 | Palaia-Article 1-Fraction 1.2.PNG (file) |  |
567 bytes | Debra Tabron | 1 | |
| 16:02, 26 October 2016 | Palaia-Article 1-Fraction 1.1.PNG (file) |  |
696 bytes | Debra Tabron | 1 | |
| 15:47, 26 October 2016 | Puls-1991-Facilitated Transport.pdf (file) | 1.02 MB | Astenger | 1 | ||
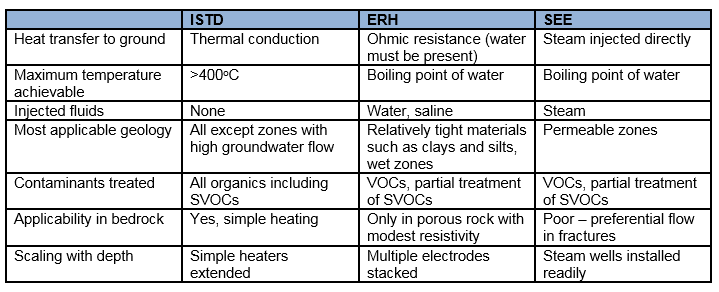
| 14:09, 26 October 2016 | Heron-Article 1. Table 1.PNG (file) |  |
29 KB | Debra Tabron | Table 1. Characteristics of the three main thermal technologies. | 1 |
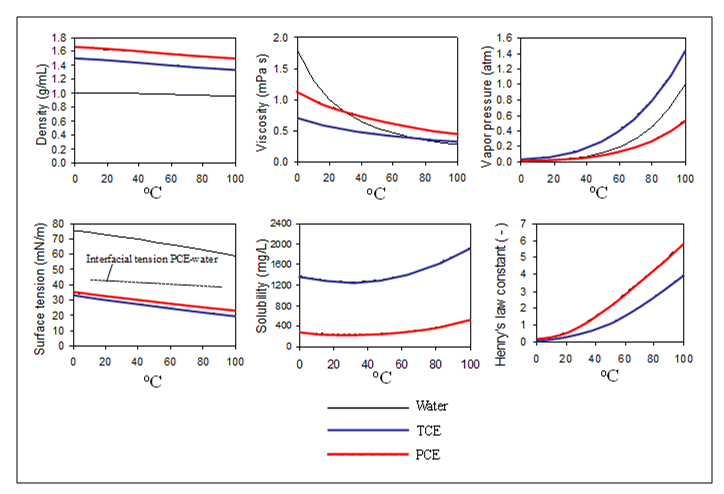
| 14:04, 26 October 2016 | Heron-Article 1. Figure 3.PNG (file) |  |
66 KB | Debra Tabron | Figure 3. Properties of PCE, TCE and water as a function of temperature. Changes in PCE and TCE properties with increased temperature facilitate contaminant recovery as a vapor. | 1 |
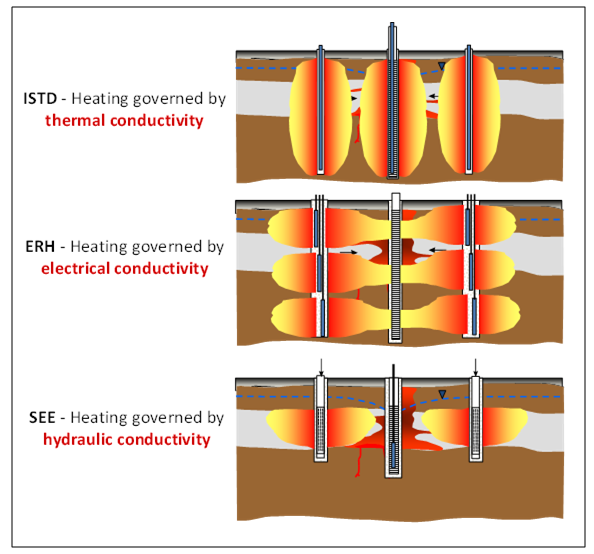
| 14:03, 26 October 2016 | Heron-Article 1. Figure 2.PNG (file) |  |
108 KB | Debra Tabron | Figure 2. The Three Most Commonly Used In Situ Thermal Technologies. (See text for abbreviation definitions) | 1 |
| 14:02, 26 October 2016 | Heron-Article 1. Figure 1.PNG (file) |  |
65 KB | Debra Tabron | Figure 1. Candidate Site for ISTR Application with Significant NAPL Source Material | 1 |
| 15:44, 25 October 2016 | Palaia-Article 1-Equation 2.PNG (file) | 2 KB | Debra Tabron | 1 | ||
| 15:43, 25 October 2016 | Palaia-Article 1-Equation 1.PNG (file) | 2 KB | Debra Tabron | 1 | ||
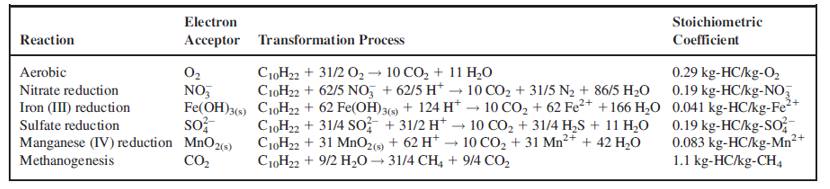
| 14:39, 25 October 2016 | Palaia-Article 1-Table 1.PNG (file) | 95 KB | Debra Tabron | Table 1. Terminal Electron Accepting Processes Associated with the Aqueous Expression of NSZD (for decane, excerpt from Johnson et al., 2006) | 1 | |
| 14:37, 25 October 2016 | Palaia-Article 1-Figure 5.PNG (file) |  |
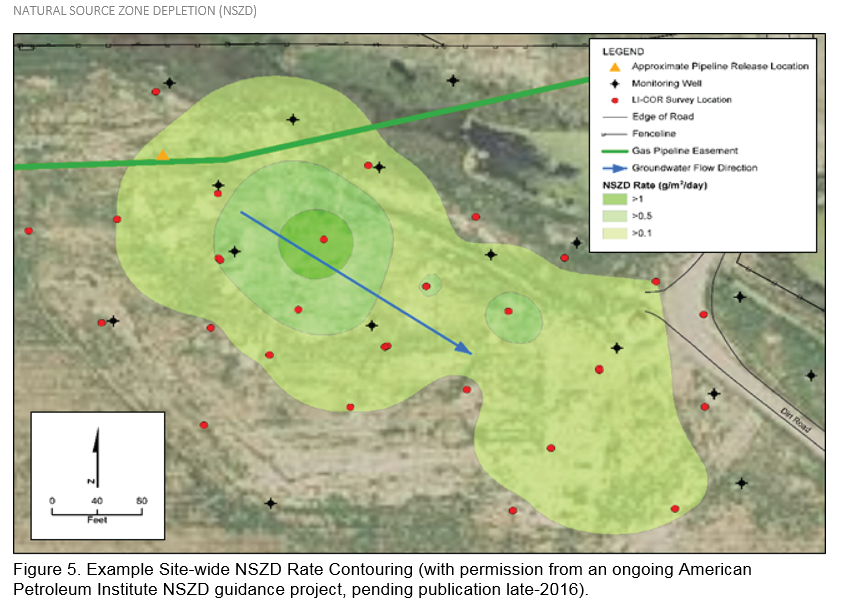
863 KB | Debra Tabron | Figure 5. Example Site-wide NSZD Rate Contouring (with permission from an ongoing American Petroleum Institute NSZD guidance project, pending publication late-2016). | 1 |
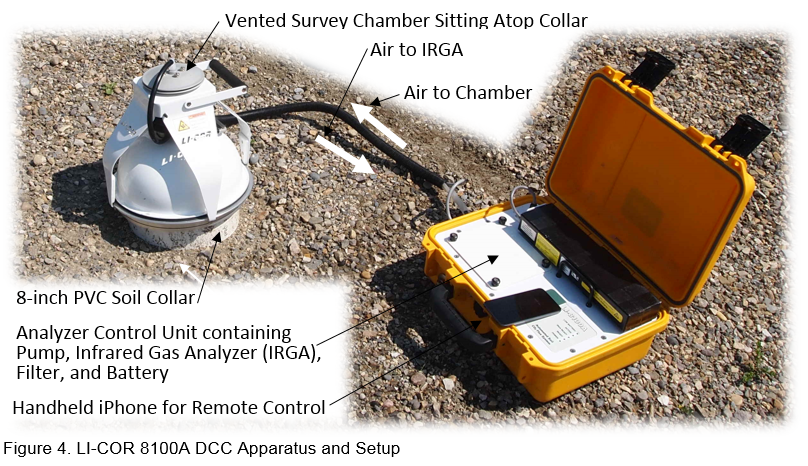
| 14:33, 25 October 2016 | Palaia-Article 1-Figure 4.PNG (file) |  |
732 KB | Debra Tabron | Figure 4. LI-COR 8100A DCC Apparatus and Setup | 1 |
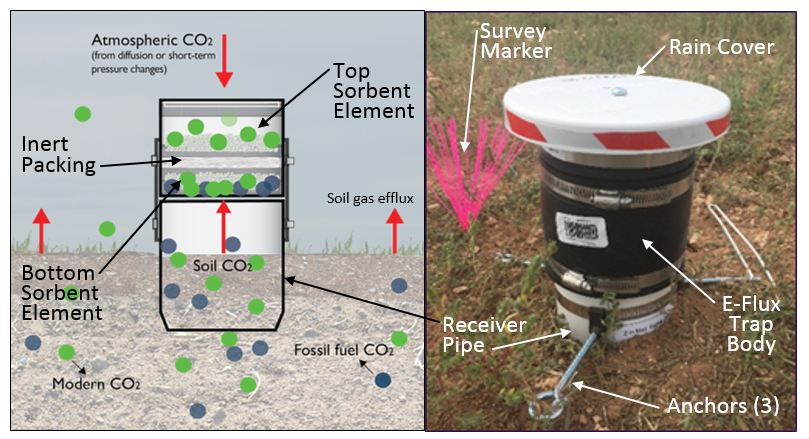
| 14:32, 25 October 2016 | Palaia-Article 1-Figure 3.PNG (file) |  |
753 KB | Debra Tabron | Figure 3. Schematic (left) and Photo (right) of a Passive CO2 Flux Trap (Used with permission from E-Flux, LLC | 1 |
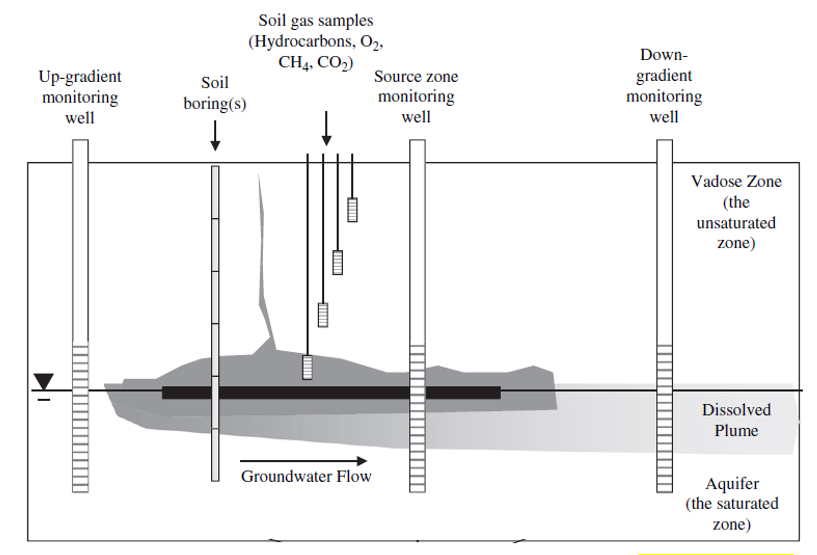
| 14:29, 25 October 2016 | Palaia-Article 1-Figure 2.PNG (file) |  |
117 KB | Debra Tabron | Figure 2. Schematic of a Typical Gradient Method Monitoring Setup (excerpt from Johnson et al., 2006). | 1 |
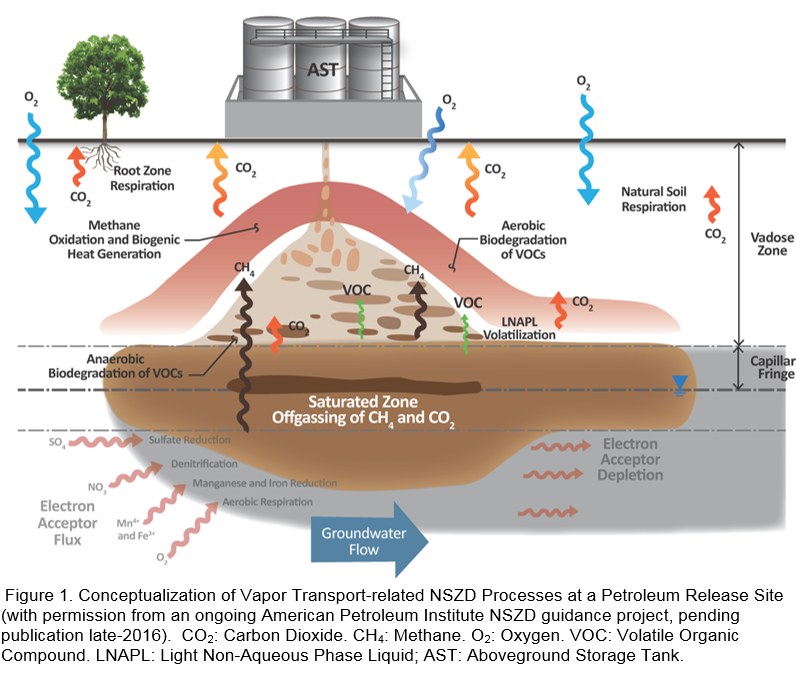
| 14:28, 25 October 2016 | Palaia-Article 1-Figure 1.PNG (file) |  |
250 KB | Debra Tabron | Figure 1. Conceptualization of Vapor Transport-related NSZD Processes at a Petroleum Release Site (with permission from an ongoing American Petroleum Institute NSZD guidance project, pending publication late-2016). CO2: Carbon Dioxide. CH4: Methane. O... | 1 |
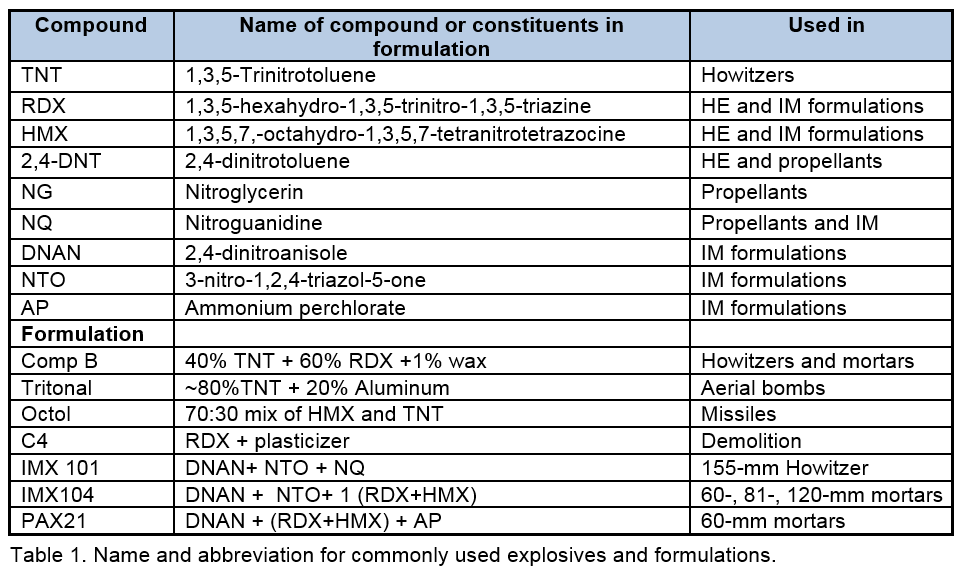
| 15:37, 21 October 2016 | Taylor-Article 1-T1.PNG (file) |  |
69 KB | Debra Tabron | Name and abbreviation for commonly used explosives and formulations | 1 |
| 14:48, 18 October 2016 | Rochette-2005-Soil Respiration.pdf (file) | 832 KB | Astenger | 1 | ||
| 13:26, 18 October 2016 | Modeling MTBE transport in vadose zone.pdf (file) | 191 KB | Dbeall | Simulation of Transport of Methyl Tert-Butyl Ether (MTBE) to Groundwater From Small-Volume Releases of Gasoline in the Vadose Zone | 1 | |
| 13:22, 18 October 2016 | MNA Indicators.pdf (file) | 297 KB | Dbeall | Evaluation of Sampling and Analytical Methods for Measuring Indicators of Intrinsic Bioremediation | 1 | |
| 13:19, 18 October 2016 | Mineral MNA Protocol.pdf (file) | 330 KB | Dbeall | Aqueous and Mineral Intrinsic Bioremediation Assessment | 1 | |
| 12:31, 18 October 2016 | Mineral MNA Protocol Development.pdf (file) | 511 KB | Dbeall | Aqueous and Mineral Intrinsic Bioremediation Assessment (AMIBA): Example and Planned Development | 1 | |
| 12:15, 18 October 2016 | Managing Risk.pdf (file) | 313 KB | Dbeall | Answers to Frequently Asked Questions About Managing Risk at LNAPL Sites | 1 | |
| 12:07, 18 October 2016 | Low K Remediation.pdf (file) | 79 KB | Dbeall | Summary of Processes, Human Exposures and Technologies Applicable to Low Permeability Soils | 1 | |
| 11:56, 18 October 2016 | J and E Vapor Instrusion Model.pdf (file) | 1.03 MB | Dbeall | Identification of Critical Parameters for the Johnson and Ettinger (1991) Vapor Intrusion Model | 1 |