Difference between revisions of "File:BJohnson-Article 1-Figure 4.PNG"
Debra Tabron (talk | contribs) (Figure 4. Computed and measured groundwater concentrations of RDX at MW161 down gradient of Demolition Area 2, MMR, with upper (UCL) and lower (LCL) confidence limits for uncertainty of RDX degradation rate.) |
(No difference)
|
Latest revision as of 20:00, 7 November 2016
Figure 4. Computed and measured groundwater concentrations of RDX at MW161 down gradient of Demolition Area 2, MMR, with upper (UCL) and lower (LCL) confidence limits for uncertainty of RDX degradation rate.
File history
Click on a date/time to view the file as it appeared at that time.
| Date/Time | Thumbnail | Dimensions | User | Comment | |
|---|---|---|---|---|---|
| current | 20:00, 7 November 2016 | 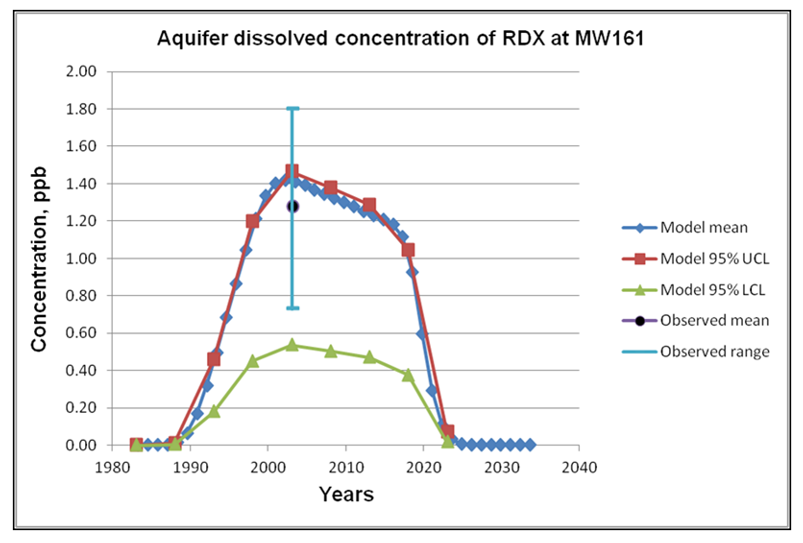 | 803 × 543 (89 KB) | Debra Tabron (talk | contribs) | Figure 4. Computed and measured groundwater concentrations of RDX at MW161 down gradient of Demolition Area 2, MMR, with upper (UCL) and lower (LCL) confidence limits for uncertainty of RDX degradation rate. |
- You cannot overwrite this file.
File usage
The following page links to this file: