Difference between revisions of "File:Fig1 LTM1 Overview.jpg"
Debra Tabron (talk | contribs) (Figure 1. Example of long term monitoring data from 52 source zone monitoring wells at 23 untreated chlorinated solvents sites (McHugh et al., 2013).) |
(No difference)
|
Latest revision as of 12:53, 17 June 2016
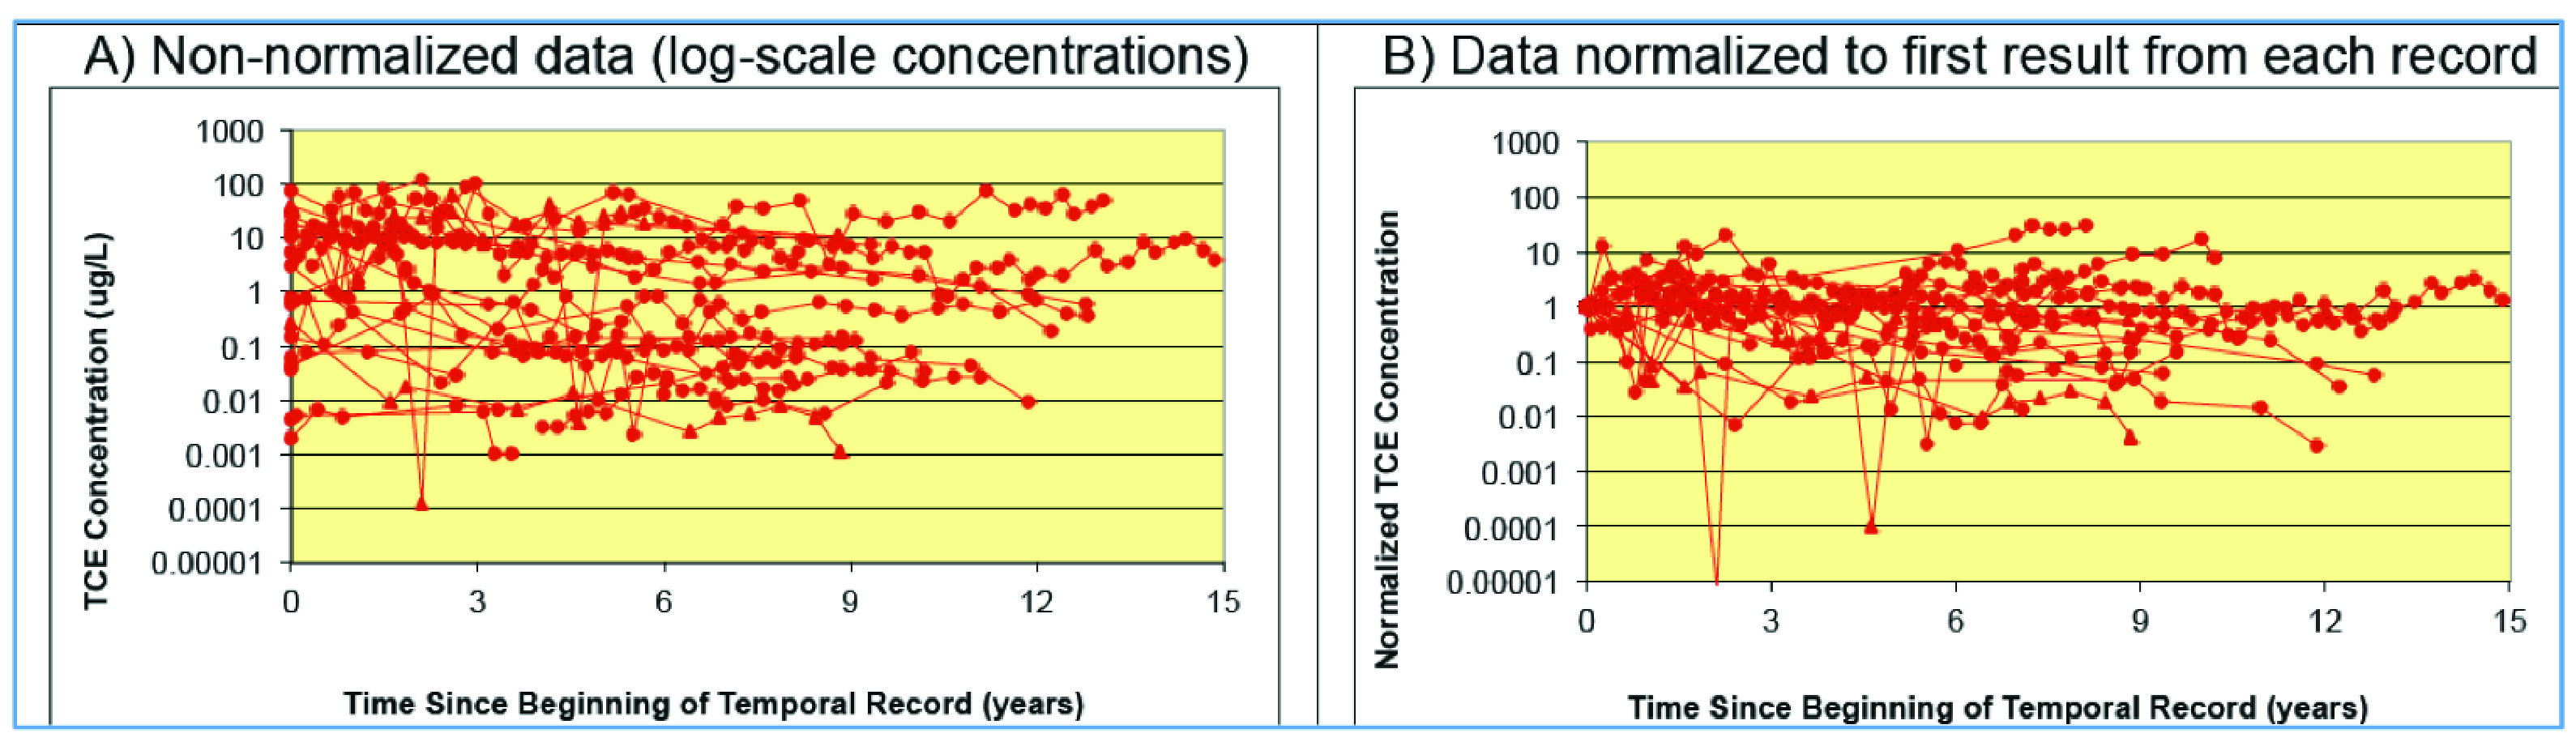
Figure 1. Example of long term monitoring data from 52 source zone monitoring wells at 23 untreated chlorinated solvents sites (McHugh et al., 2013).
File history
Click on a date/time to view the file as it appeared at that time.
| Date/Time | Thumbnail | Dimensions | User | Comment | |
|---|---|---|---|---|---|
| current | 12:53, 17 June 2016 | 3,179 × 921 (2.09 MB) | Debra Tabron (talk | contribs) | Figure 1. Example of long term monitoring data from 52 source zone monitoring wells at 23 untreated chlorinated solvents sites (McHugh et al., 2013). |
- You cannot overwrite this file.
File usage
The following page links to this file: