Difference between revisions of "File:Fig1 LTM DataVariability.jpg"
Debra Tabron (talk | contribs) (Figure 1. Effect of Short-term Variability on Evaluation of Long-Term Contaminant Attenuation. Short-term variability makes it harder to identify the long-term trend by visual inspection and adds uncertainty to the statistical analysis of the long-term...) |
(No difference)
|
Latest revision as of 17:43, 24 June 2016
Figure 1. Effect of Short-term Variability on Evaluation of Long-Term Contaminant Attenuation. Short-term variability makes it harder to identify the long-term trend by visual inspection and adds uncertainty to the statistical analysis of the long-term trend.
File history
Click on a date/time to view the file as it appeared at that time.
| Date/Time | Thumbnail | Dimensions | User | Comment | |
|---|---|---|---|---|---|
| current | 17:43, 24 June 2016 | 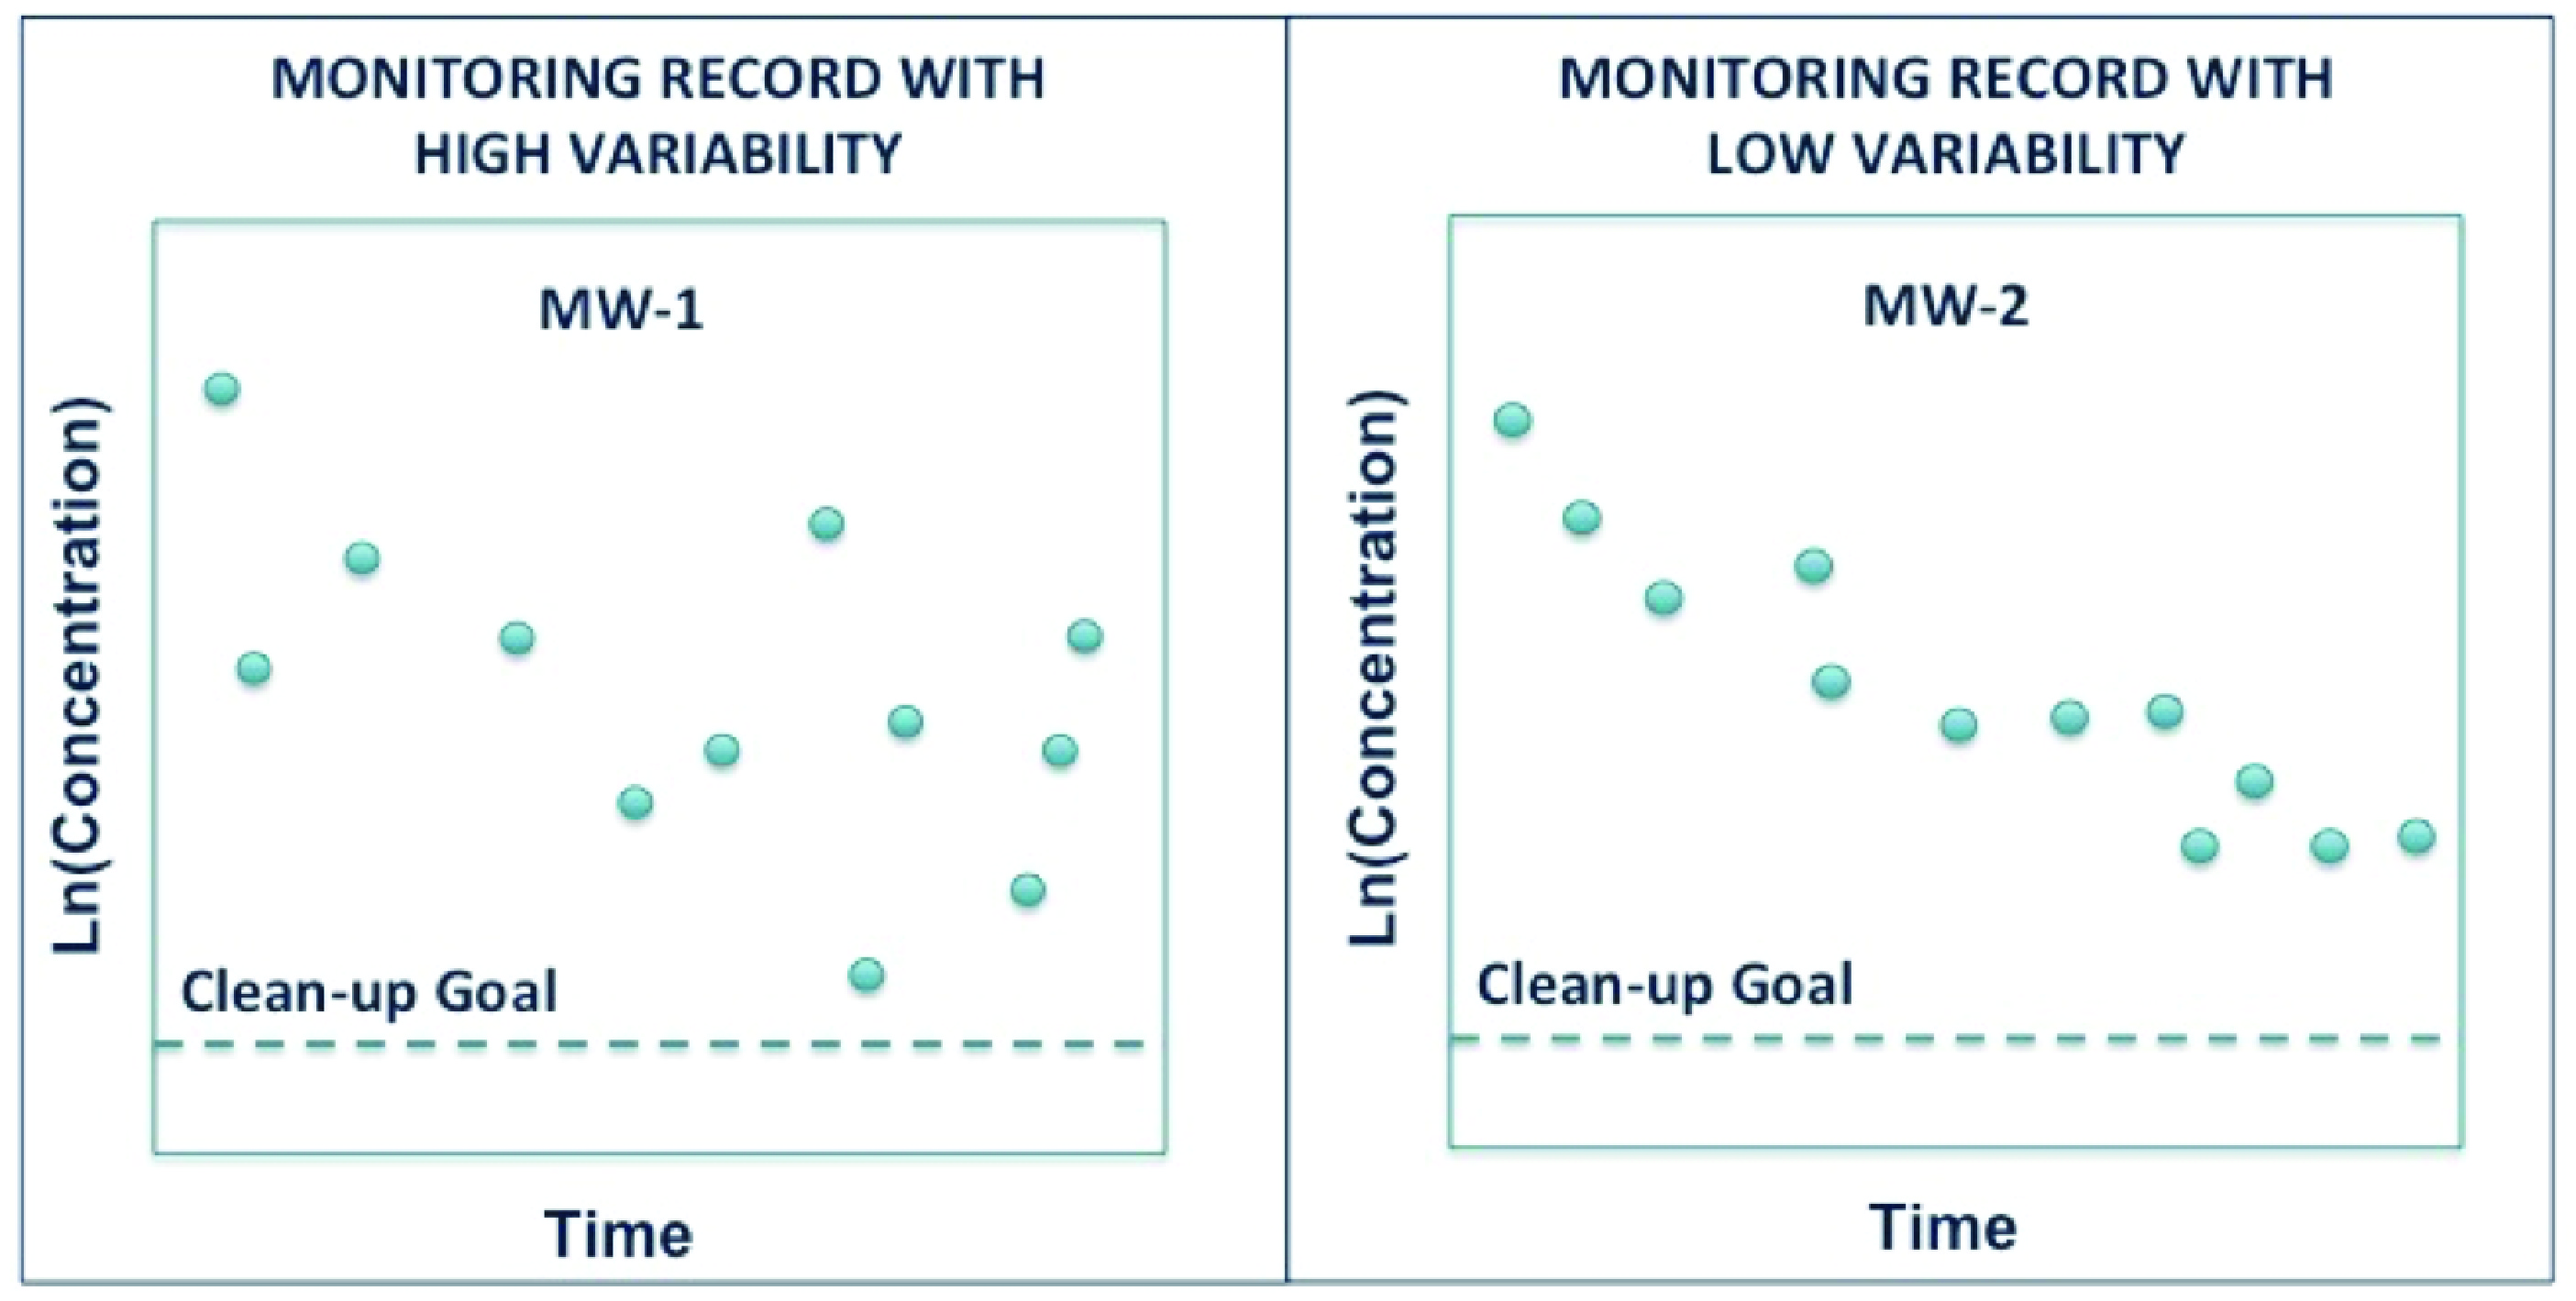 | 2,809 × 1,419 (1.53 MB) | Debra Tabron (talk | contribs) | Figure 1. Effect of Short-term Variability on Evaluation of Long-Term Contaminant Attenuation. Short-term variability makes it harder to identify the long-term trend by visual inspection and adds uncertainty to the statistical analysis of the long-term... |
- You cannot overwrite this file.
File usage
The following page links to this file: