Difference between revisions of "File:Johnson1w2 Fig2.png"
Debra Tabron (talk | contribs) (Figure 2: Mean pore water RDX concentrations by hand grenade bay and lysimeter with maximum and minimum concentration profiles (avg, n ranges from 7 to 10; modified from Larson et al., 2007).) |
(No difference)
|
Latest revision as of 22:01, 30 January 2019
Summary
Figure 2: Mean pore water RDX concentrations by hand grenade bay and lysimeter with maximum and minimum concentration profiles (avg, n ranges from 7 to 10; modified from Larson et al., 2007).
File history
Click on a date/time to view the file as it appeared at that time.
| Date/Time | Thumbnail | Dimensions | User | Comment | |
|---|---|---|---|---|---|
| current | 22:01, 30 January 2019 | 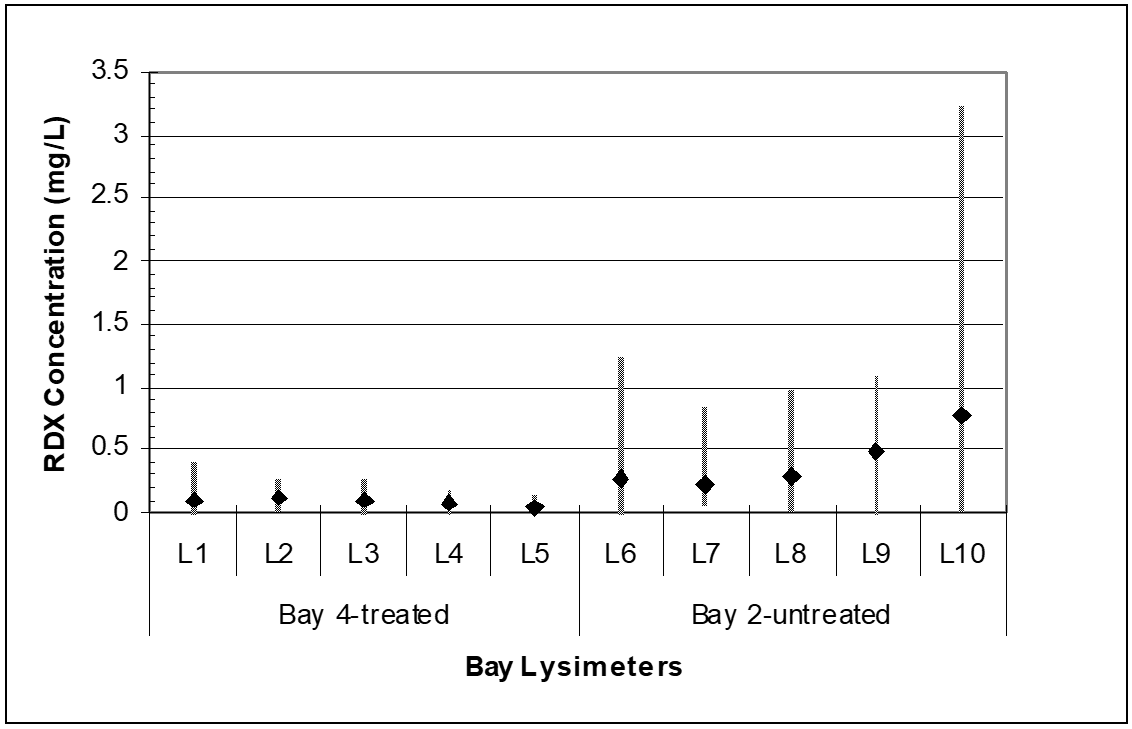 | 1,132 × 729 (32 KB) | Debra Tabron (talk | contribs) | Figure 2: Mean pore water RDX concentrations by hand grenade bay and lysimeter with maximum and minimum concentration profiles (avg, n ranges from 7 to 10; modified from Larson et al., 2007). |
- You cannot overwrite this file.
File usage
The following page links to this file: