Difference between revisions of "File:Krug-Article 2-Figure 2.PNG"
Debra Tabron (talk | contribs) (Figure 2. Electron donor distribution during the active semi-passive amendment injection phase (left panel) and the passive phase (right panel).) |
(No difference)
|
Latest revision as of 19:48, 30 January 2017
Figure 2. Electron donor distribution during the active semi-passive amendment injection phase (left panel) and the passive phase (right panel).
File history
Click on a date/time to view the file as it appeared at that time.
| Date/Time | Thumbnail | Dimensions | User | Comment | |
|---|---|---|---|---|---|
| current | 19:48, 30 January 2017 | 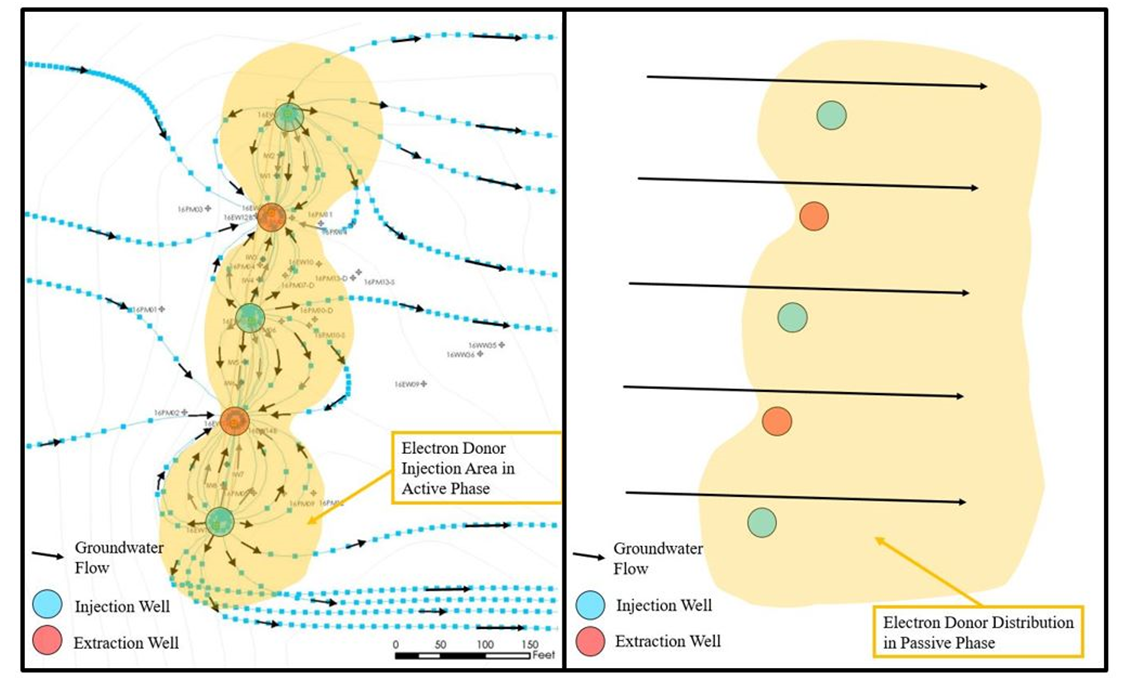 | 1,126 × 689 (673 KB) | Debra Tabron (talk | contribs) | Figure 2. Electron donor distribution during the active semi-passive amendment injection phase (left panel) and the passive phase (right panel). |
- You cannot overwrite this file.
File usage
The following page links to this file: