Difference between revisions of "File:McCall Article 3 Figure 5.PNG"
Debra Tabron (talk | contribs) (Figure 5: A typical EC log with rate of penetration (ROP) plotted on left and bulk formation EC on right. The decrease in EC and ROP at ~29ft indicates transition to coarser grained materials (sands).) |
(No difference)
|
Latest revision as of 21:14, 26 August 2016
Figure 5: A typical EC log with rate of penetration (ROP) plotted on left and bulk formation EC on right. The decrease in EC and ROP at ~29ft indicates transition to coarser grained materials (sands).
File history
Click on a date/time to view the file as it appeared at that time.
| Date/Time | Thumbnail | Dimensions | User | Comment | |
|---|---|---|---|---|---|
| current | 21:14, 26 August 2016 | 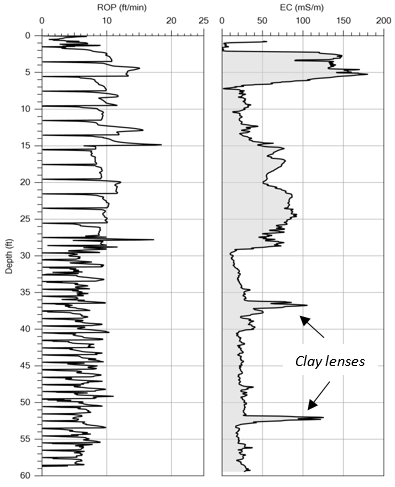 | 395 × 487 (50 KB) | Debra Tabron (talk | contribs) | Figure 5: A typical EC log with rate of penetration (ROP) plotted on left and bulk formation EC on right. The decrease in EC and ROP at ~29ft indicates transition to coarser grained materials (sands). |
- You cannot overwrite this file.
File usage
The following page links to this file: