Difference between revisions of "File:Taylor-A1-Figure 6.PNG"
Debra Tabron (talk | contribs) (Figure 6. Plot of the normalized % NG dissolved from unfired propellants versus time (Taylor et al. 2012).) |
(No difference)
|
Latest revision as of 19:08, 17 October 2016
Figure 6. Plot of the normalized % NG dissolved from unfired propellants versus time (Taylor et al. 2012).
File history
Click on a date/time to view the file as it appeared at that time.
| Date/Time | Thumbnail | Dimensions | User | Comment | |
|---|---|---|---|---|---|
| current | 19:08, 17 October 2016 | 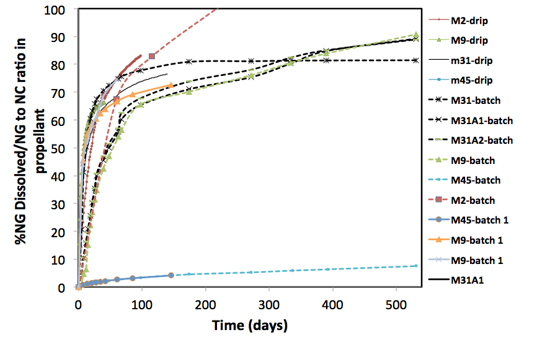 | 533 × 342 (73 KB) | Debra Tabron (talk | contribs) | Figure 6. Plot of the normalized % NG dissolved from unfired propellants versus time (Taylor et al. 2012). |
- You cannot overwrite this file.
File usage
The following page links to this file: