File list
This special page shows all uploaded files.
| Date | Name | Thumbnail | Size | Description | Versions |
|---|---|---|---|---|---|
| 13:37, 10 October 2016 | Walsh-2005-An Examination of protocols for explosives residues.pdf (file) | walsh-2005-An_Examination_of_protocols_for_explosives_residues.pdf | 536 KB | Walsh, MR, ME Walsh, CA Ramsey, and TF Jenkins (2005) An examination of protocols for the collection of munitions-derived explosives residue on snow-covered ice. ERDC/CRREL Technical Report TR-05-8. US Army Cold Regions Research and Engineering Laborat... | 1 |
| 20:47, 26 February 2016 | Zogorski-2006- Volatile organic compounds in the nations ground water and wells.pdf (file) | 9.98 MB | Zogorski, J.S., Carter, J.M., Ivahnenko, T., Lapham, W.W., Moran, M.J., Rowe, B.L., Squillace, P.J. and Toccalino, P.L., 2006. Volatile organic compounds in the nation’s ground water and drinking-water supply wells. US Geological Survey Circular, 129... | 1 | |
| 21:20, 17 February 2016 | Zheng-1999 MT3DMS.pdf (file) | 9.38 MB | Zheng, C. and Wang, P.P., 1999. MT3DMS: a modular three-dimensional multispecies transport model for simulation of advection, dispersion, and chemical reactions of contaminants in groundwater systems; documentation and user's guide. | 1 | |
| 19:25, 8 April 2020 | Zemo-2013 Toxicity of Polar Metabolites.pdf (file) | 705 KB | Zemo, D.A., O'Reilly, K.T., Mohler, R.E., Tiwary, A.K., Magaw, R.I., Synowiec, K.A., 2013. Nature and Estimated Human Toxicity of Polar Metabolite Mixtures in Groundwater Quantified as TPHd/DRO at Biodegrading Fuel Release Sites. Groundwater Monitoring... | 1 | |
| 16:49, 1 April 2020 | Yuncu1w2Fig6.png (file) |  |
202 KB | Figure 6. Limit of Migration of Dissolved Hydrocarbon Plumes (Newell and Connor 1998). | 1 |
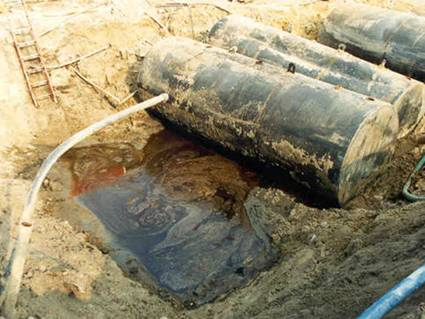
| 16:48, 1 April 2020 | Yuncu1w2Fig5.png (file) |  |
367 KB | Figure 5 - Free Product Collecting in the Basin of an Underground Storage Tank | 1 |
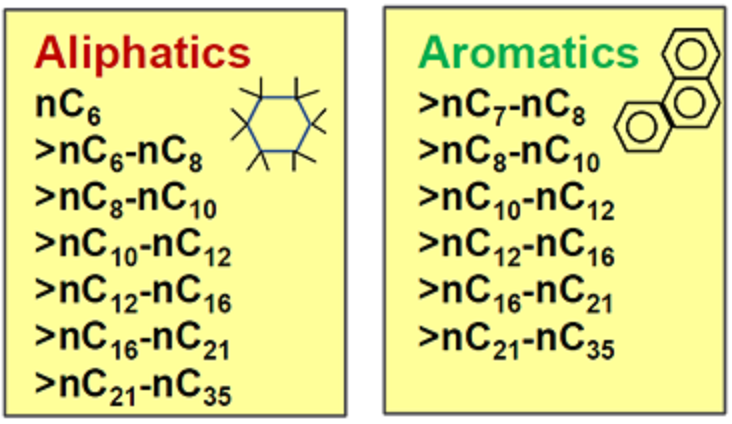
| 16:46, 1 April 2020 | Yuncu1w2Fig4.png (file) |  |
224 KB | Figure 4 - TPH Fractions of TCEQ Method 1006. Adapted from Rhodes (2006) | 1 |
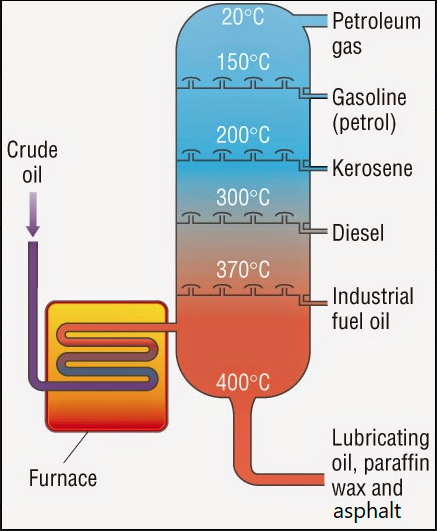
| 16:44, 1 April 2020 | Yuncu1w2Fig3.png (file) |  |
170 KB | Figure 3 - Fractional Distillation of Crude Oil in Fractionating Column | 1 |
| 16:43, 1 April 2020 | Yuncu1w2Fig2.png (file) |  |
510 KB | figure 2 - diesel fuel | 1 |
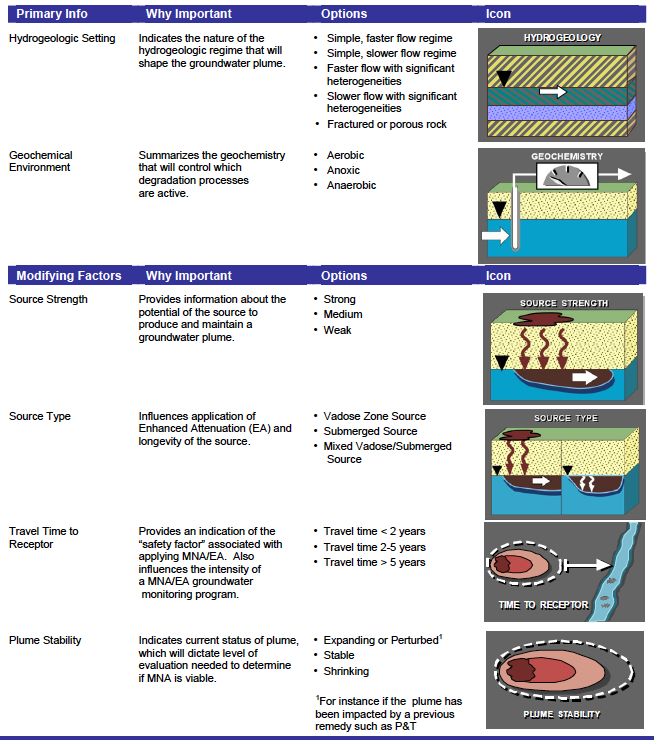
| 13:18, 17 May 2016 | Wilson 3 Table2.png (file) |  |
143 KB | Table 2. Key Elements of the Scenarios Tool for Chlorinated Solvent MNA | 1 |
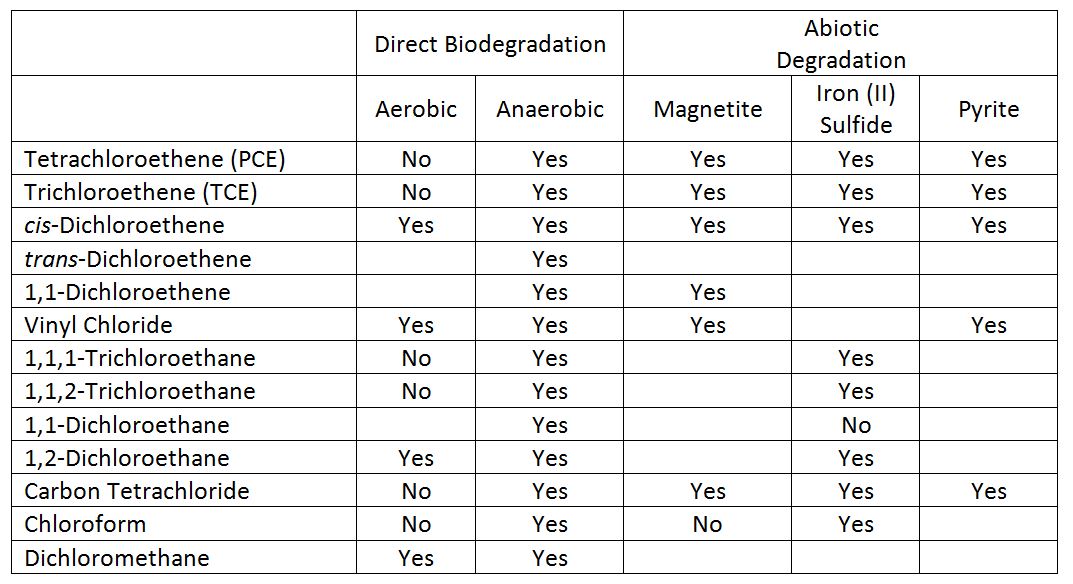
| 13:13, 17 May 2016 | Wilson 3 Table1.JPG (file) |  |
125 KB | Summary of prospects for degradation of selected chlorinated solvents and their transformation products in groundwater | 1 |
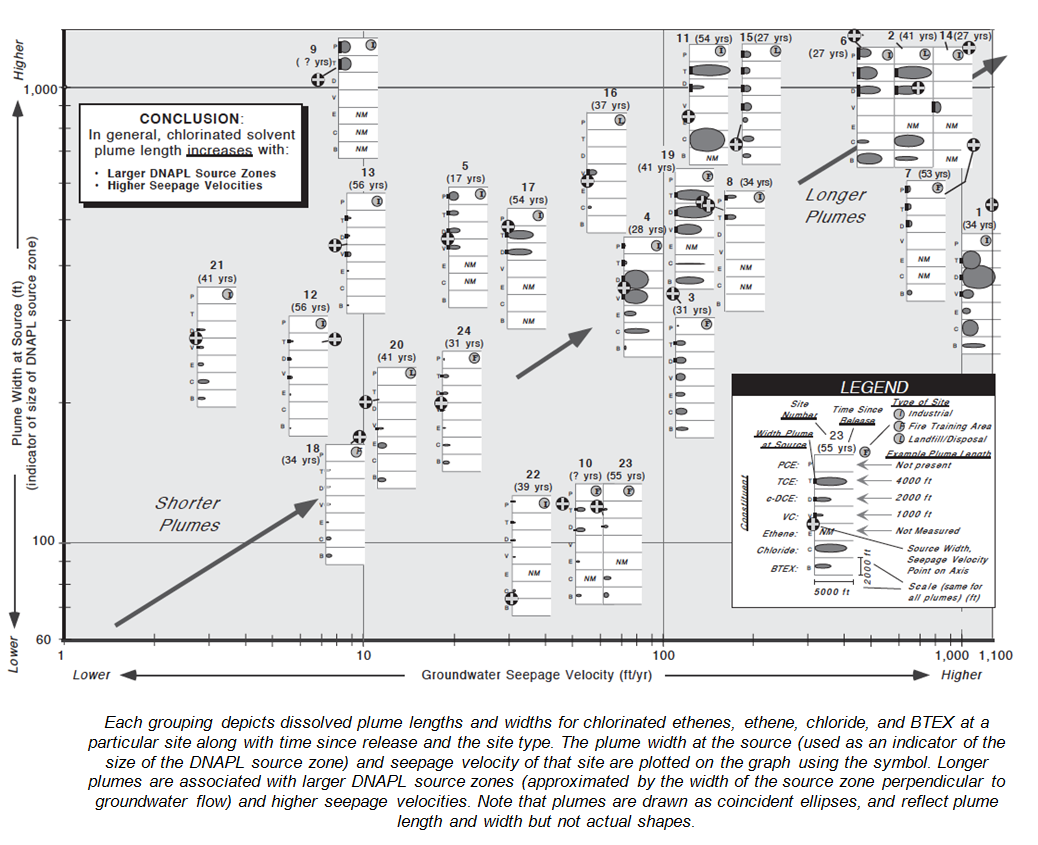
| 14:15, 19 May 2016 | Wilson 3 Fig8.png (file) |  |
313 KB | Figure 8 - Effect of estimated source size and groundwater seepage velocity on plume length. | 1 |
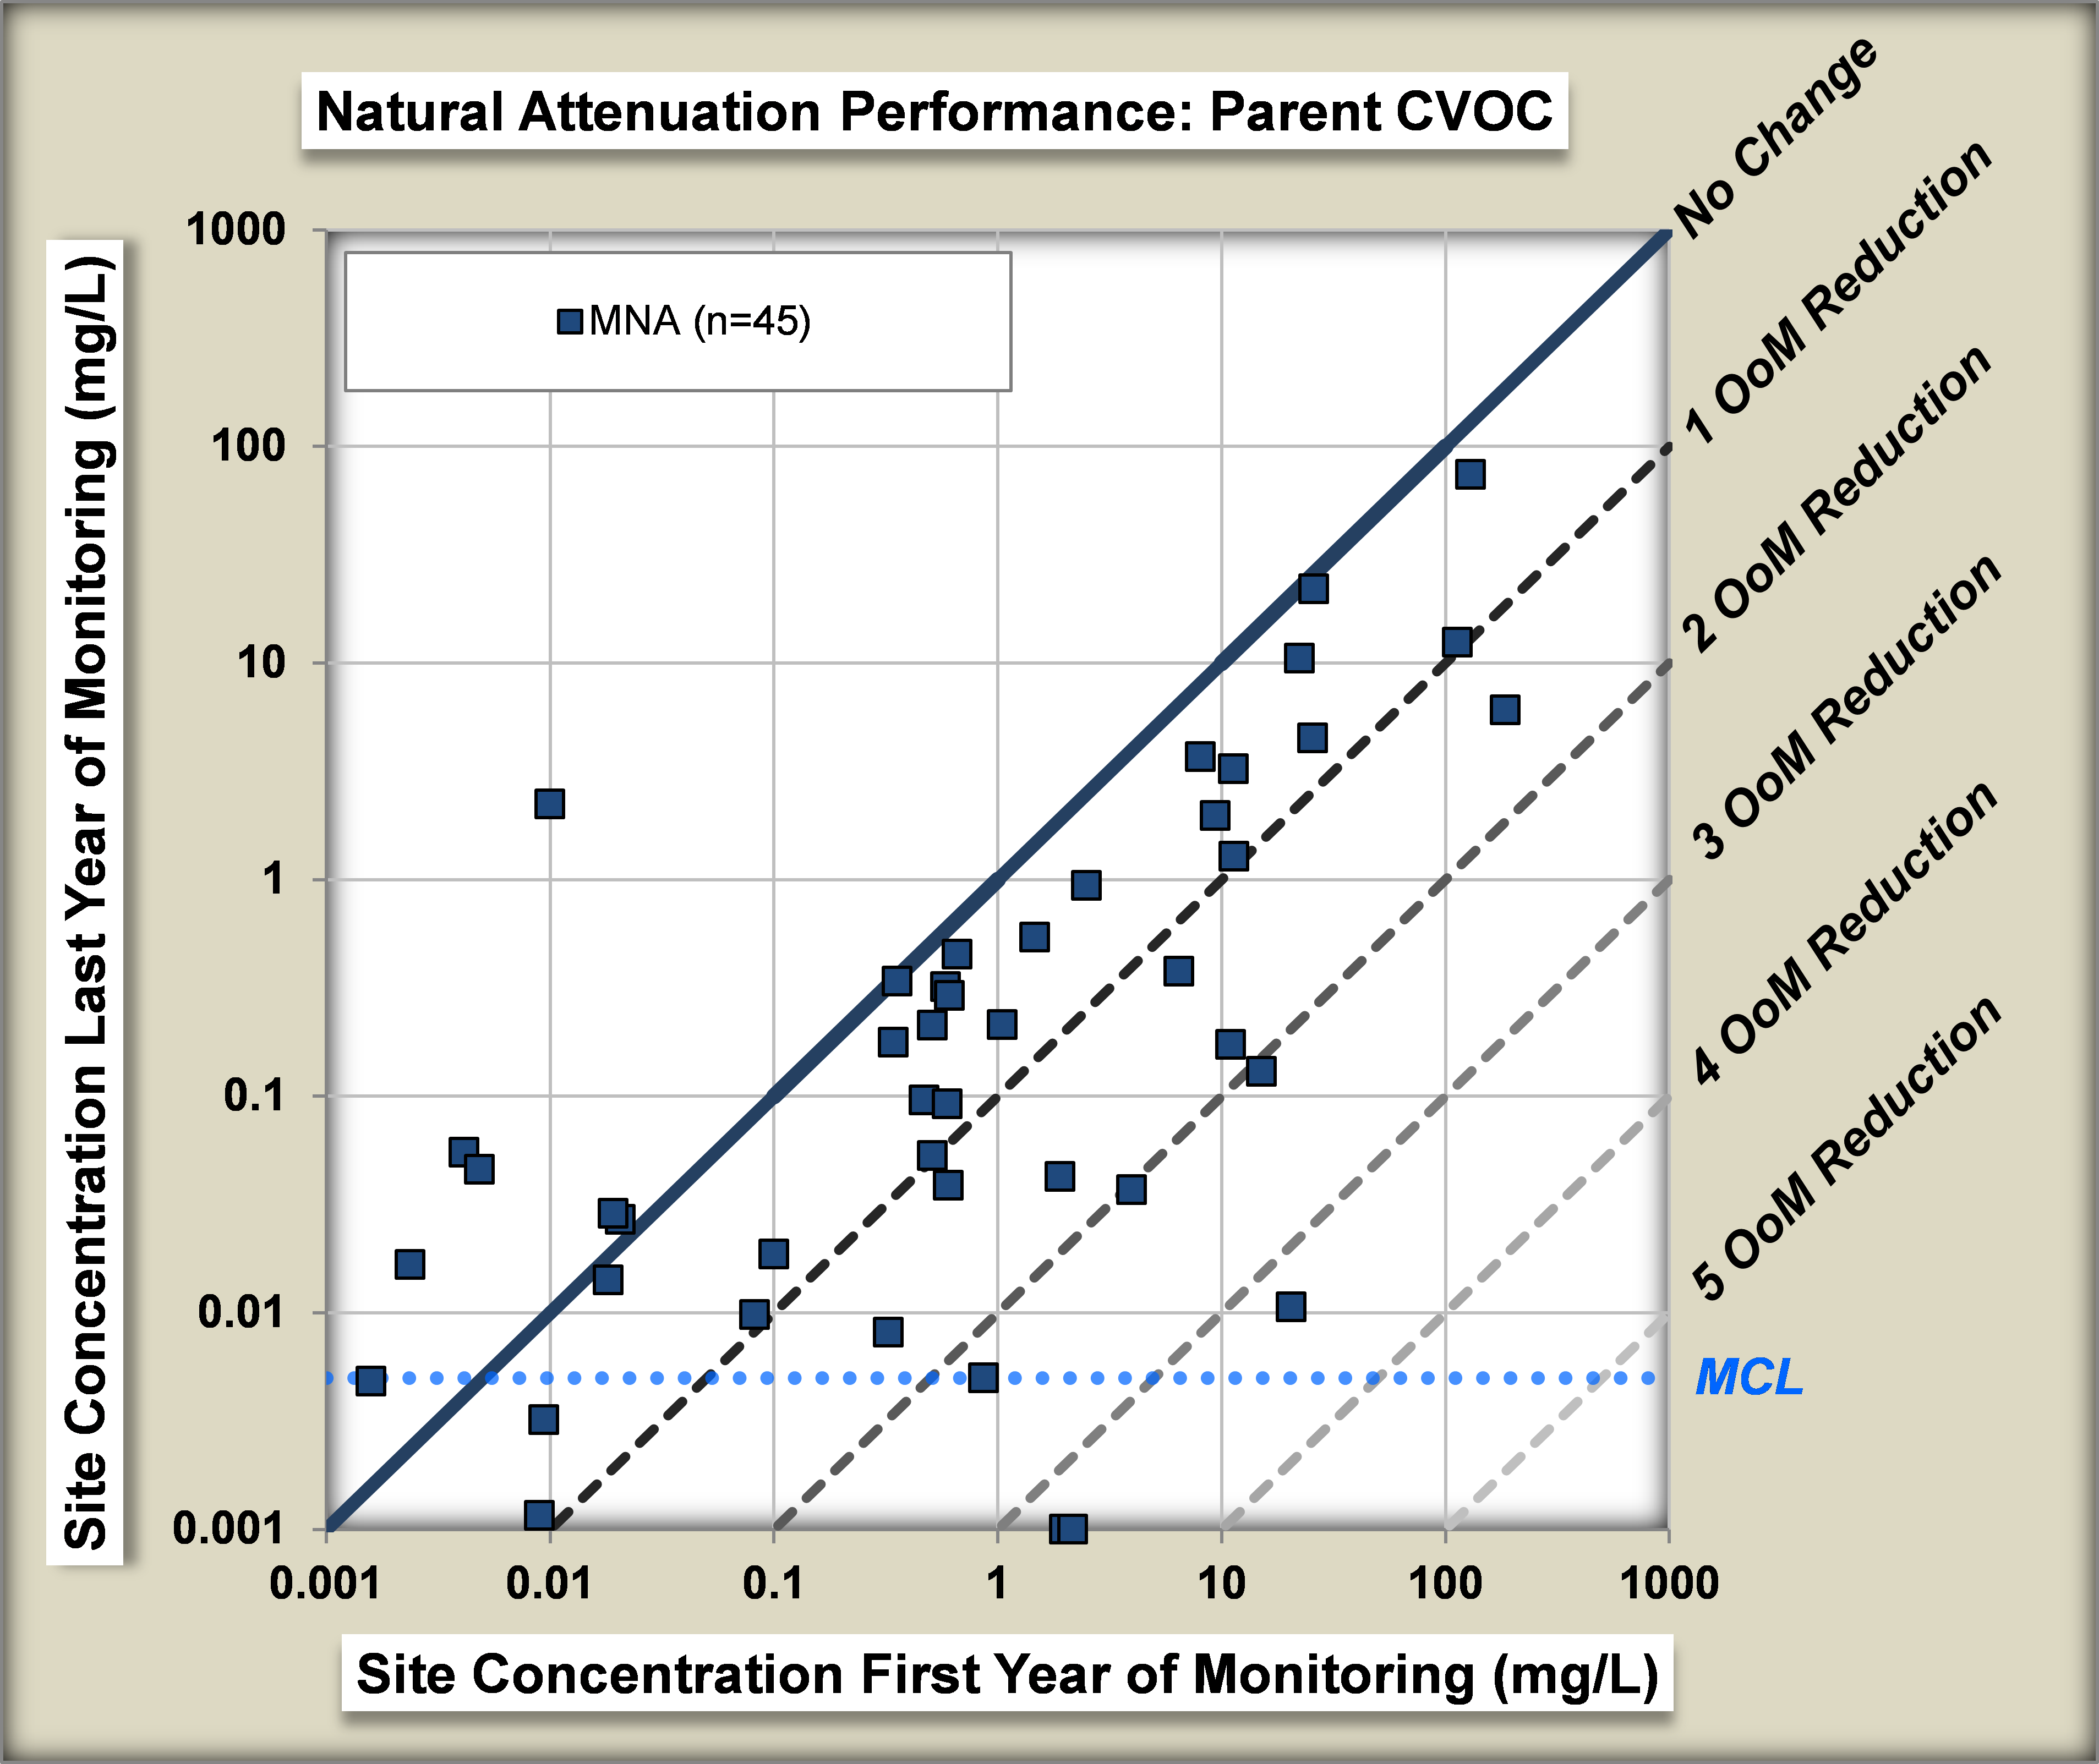
| 13:32, 17 May 2016 | Wilson 3 Fig7.png (file) |  |
580 KB | Figure 7. Natural Attenuation Performance: Parent CVOC | 1 |
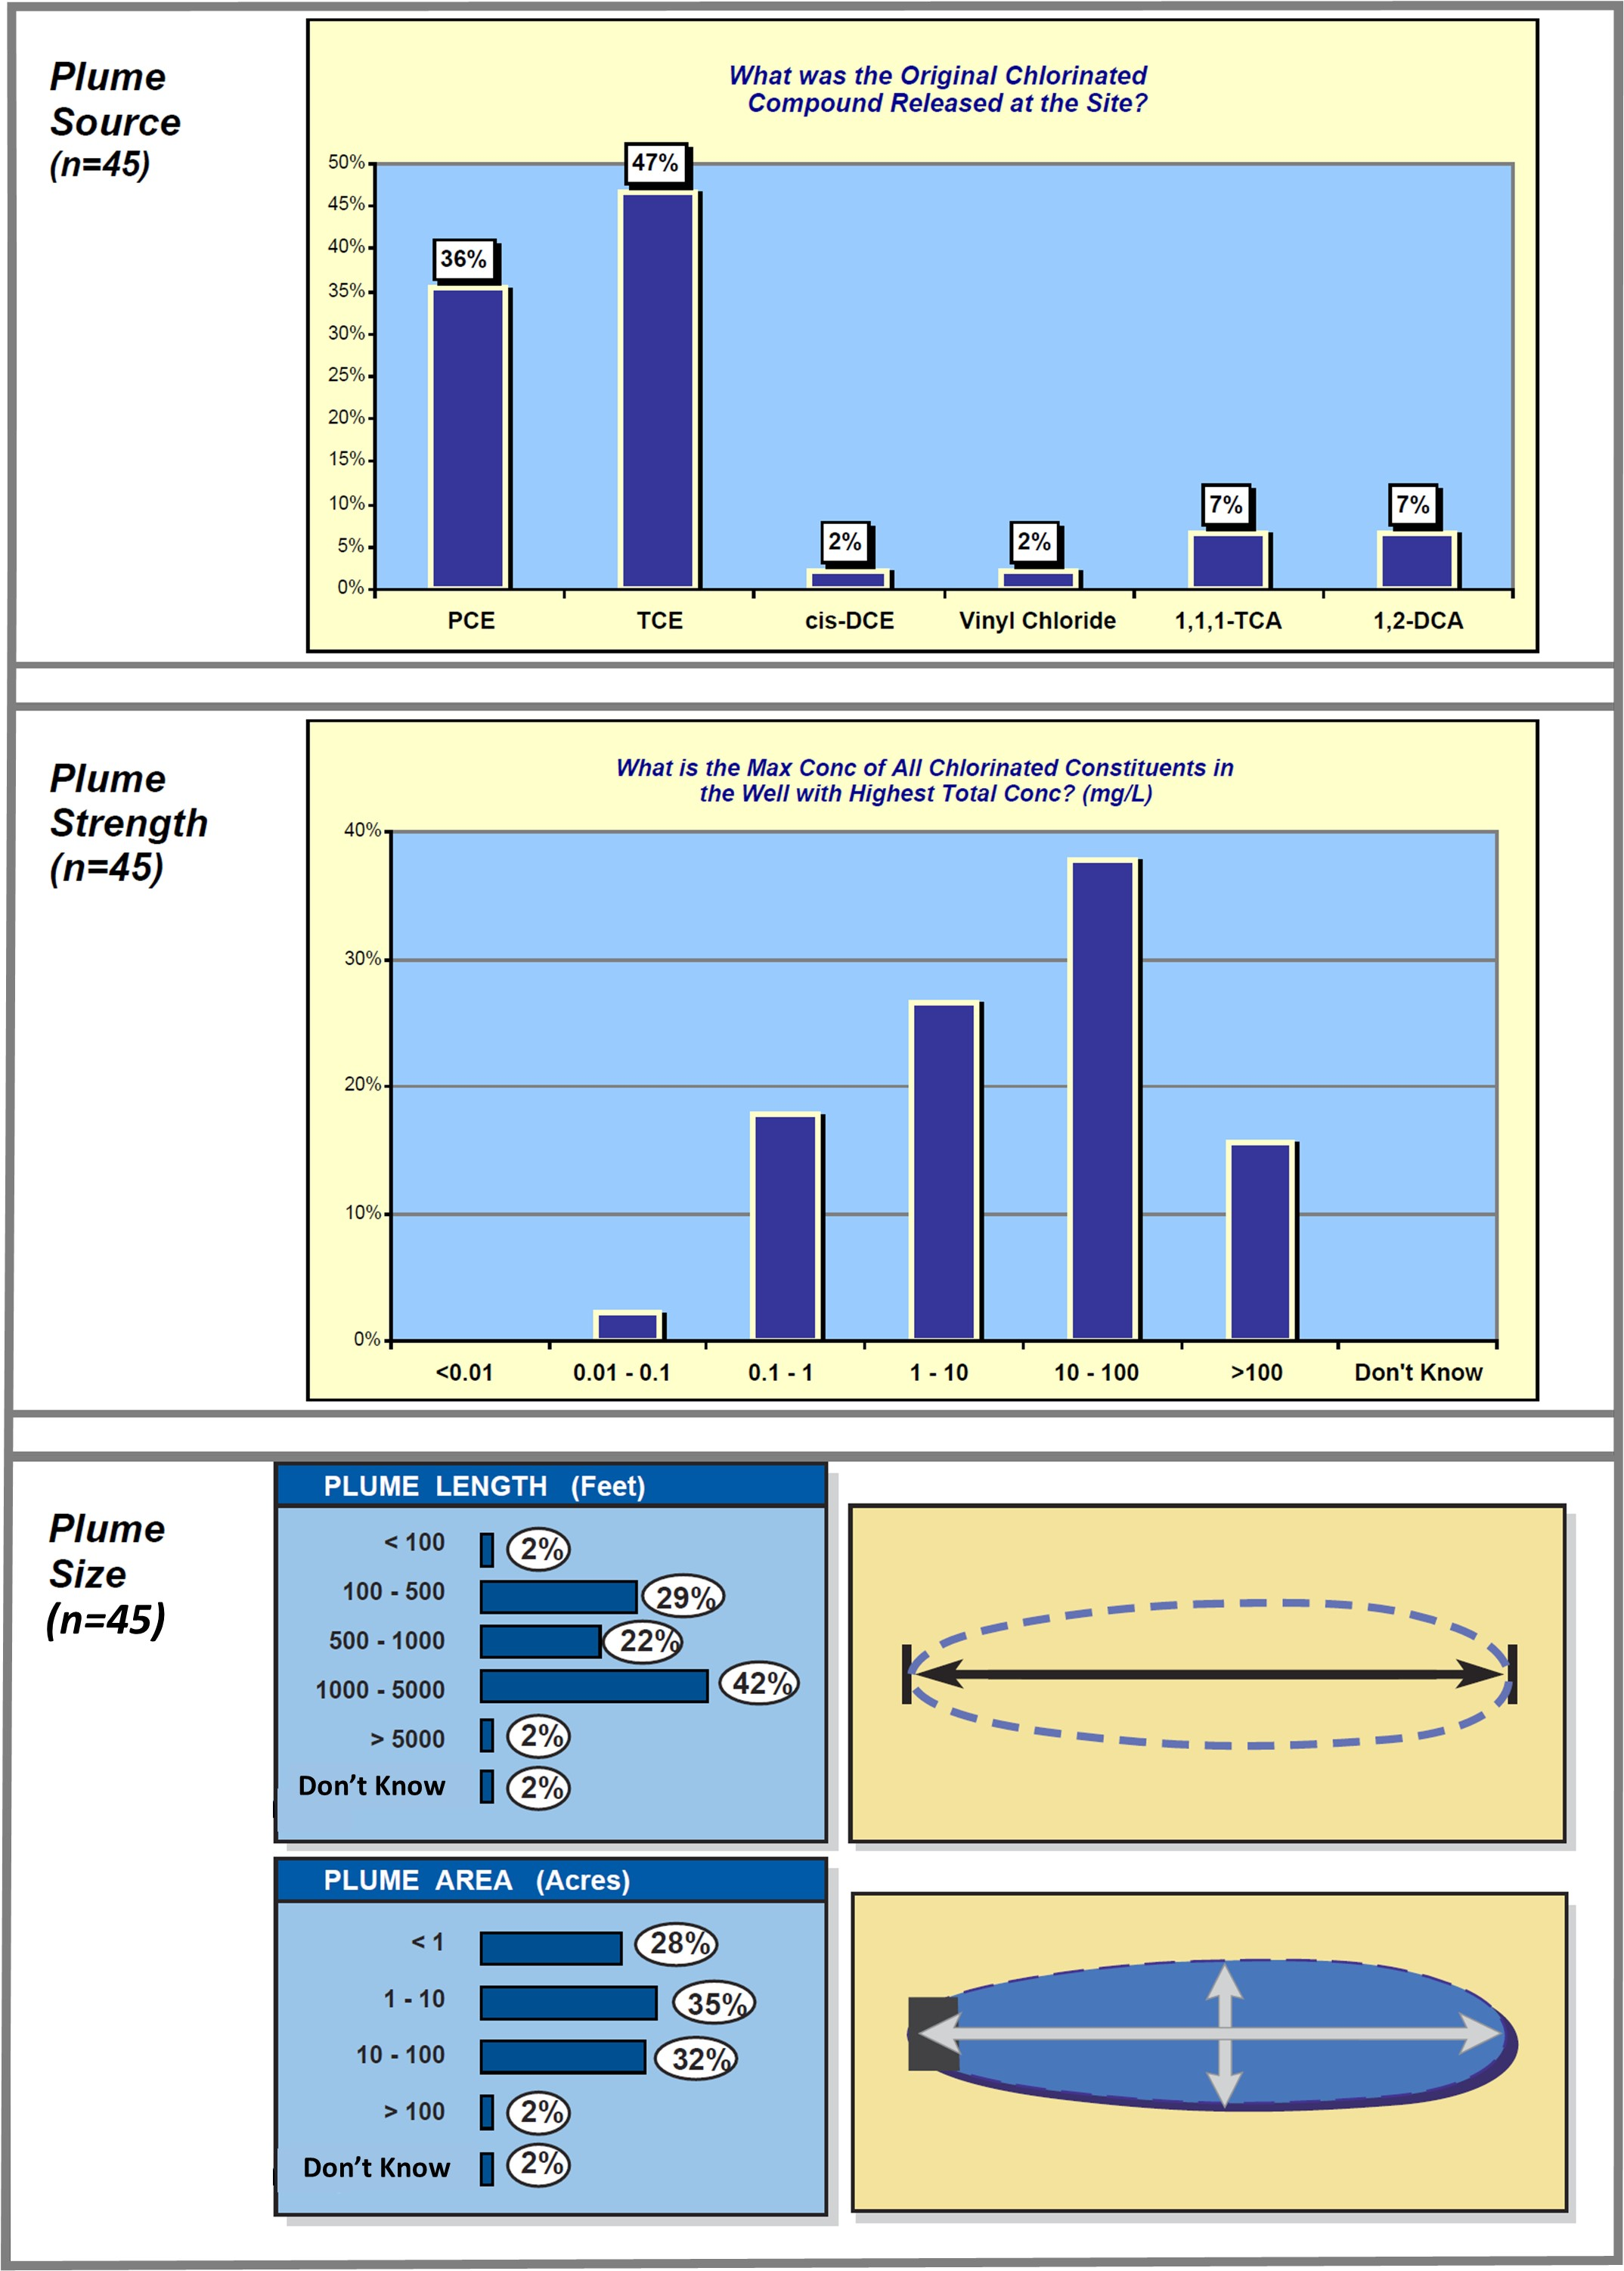
| 13:24, 17 May 2016 | Wilson 3 Fig6.png (file) |  |
1.43 MB | Figure 6. Plume Characteristics evaluation of 45 chlorinated solvent sites | 1 |
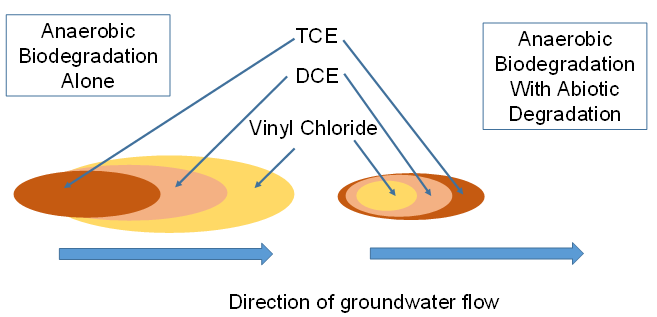
| 14:27, 16 May 2016 | Wilson 3 Fig5.png (file) |  |
20 KB | Figure 5. Biodegradation alone vs. biodegradation with abiotic degradaton | 1 |
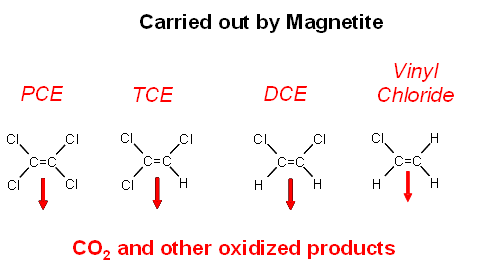
| 14:35, 16 May 2016 | Wilson 3 Fig4.png (file) |  |
9 KB | Figure 4. Degradation of chlorinated alkenes carried out by magnetite | 2 |
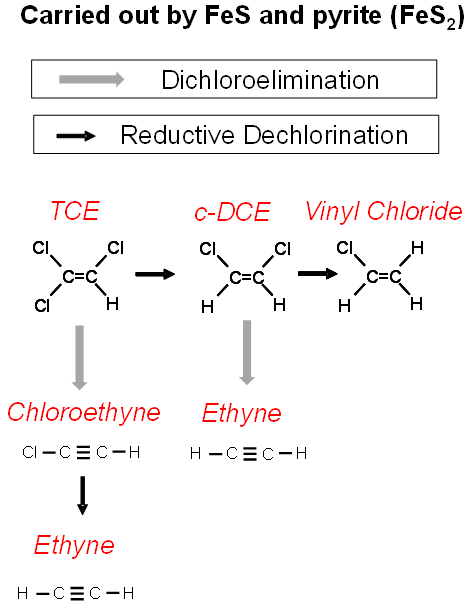
| 14:10, 16 May 2016 | Wilson 3 Fig3.png (file) |  |
18 KB | Carried out by FeS and Pyrite | 1 |
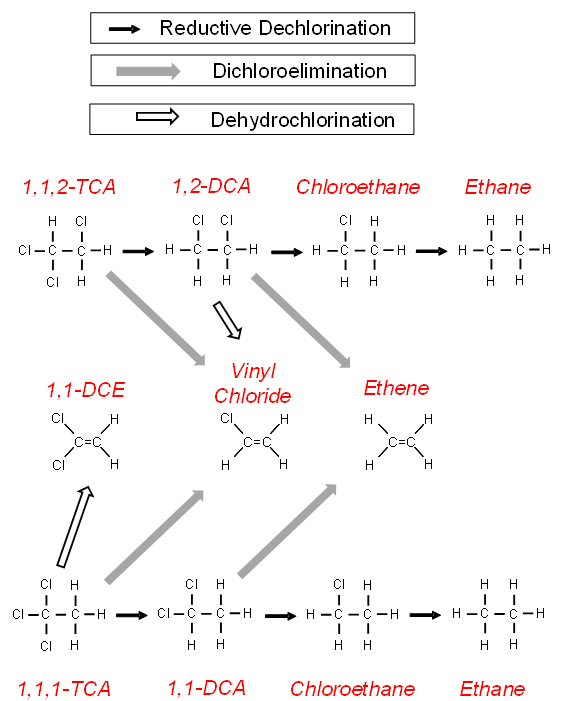
| 14:44, 16 May 2016 | Wilson 3 Fig2.PNG (file) |  |
25 KB | Degradation of chlorinated alkanes to ethane | 1 |
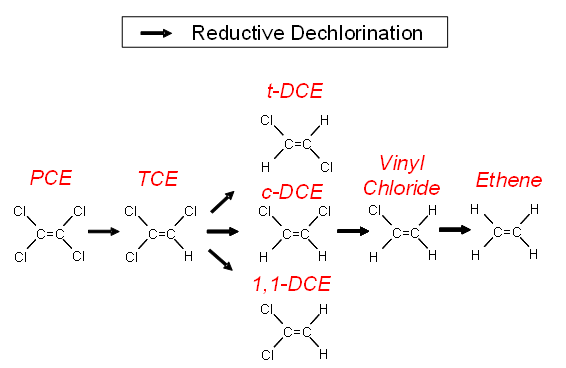
| 14:48, 16 May 2016 | Wilson 3 Fig1.png (file) |  |
12 KB | Figure 1. Degradation of chlorinated alkenes | 1 |
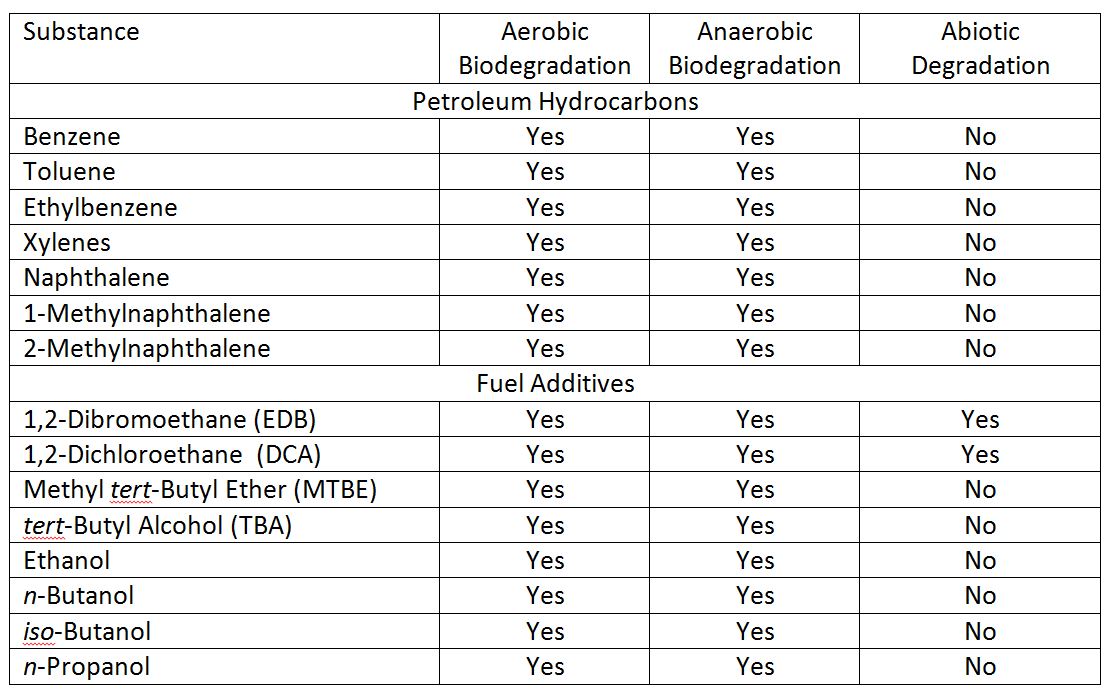
| 18:51, 13 May 2016 | Wilson 2 Table1.JPG (file) |  |
144 KB | Substance Table - Aerobic Biodegradation/Anaerobic Biodegradation/Abiotic Degradation. | 1 |
| 18:53, 13 May 2016 | Wilson 2 MTBE TBA.png (file) |  |
70 KB | MBE and TBA | 1 |
| 18:49, 13 May 2016 | Wilson 2 Figure 2. Petroleum hydrocarbon plumes.PNG (file) |  |
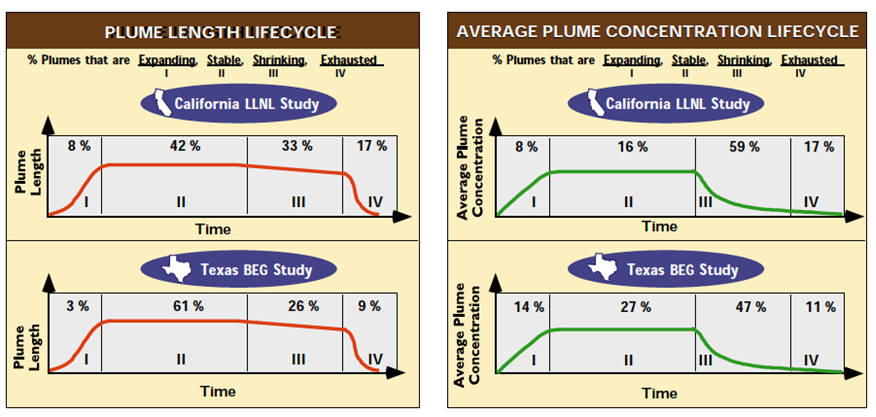
163 KB | Figure 2. Plume status of 500 petroleum hydrocarbon plumes in California and Texas (Newell and Connor, 1998; original figures from Rice et al., 1995) | 1 |
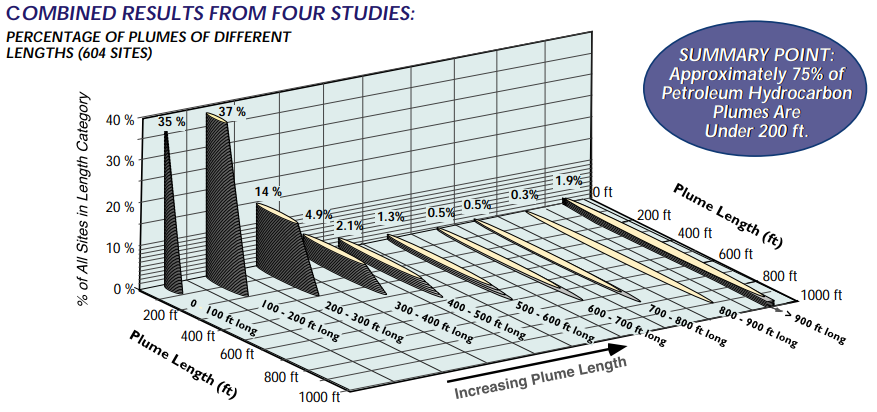
| 18:47, 13 May 2016 | Wilson 2 Figure 1. BTEX.PNG (file) |  |
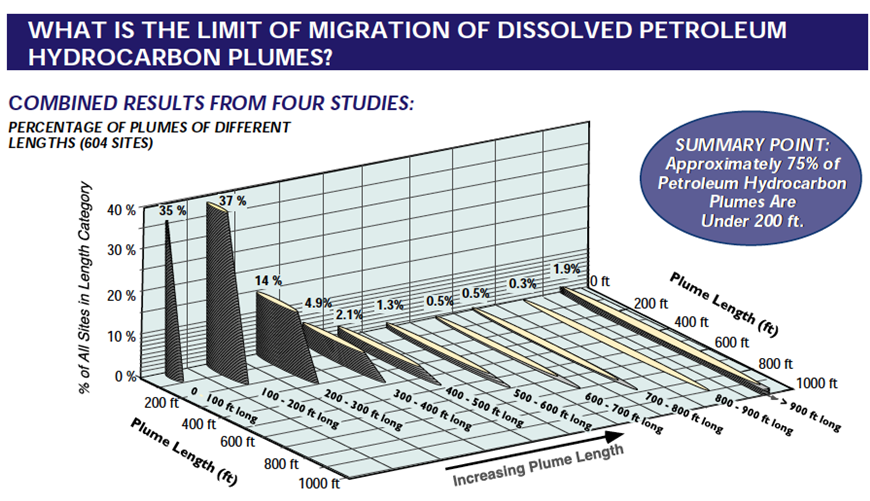
343 KB | Figure 1. Distribution of BTEX plume lengths from 604 hydrocarbon sites (Newell and Connor, 1998) | 1 |
| 21:22, 9 January 2020 | Wilson1w2Fig6.png (file) |  |
236 KB | Figure 6. Example calibration of NAS to predict the reduced concentration at the source that is necessary to meet the remediation goal at a point-of-compliance well (Figure 19 of NAS User’s Manual). | 1 |
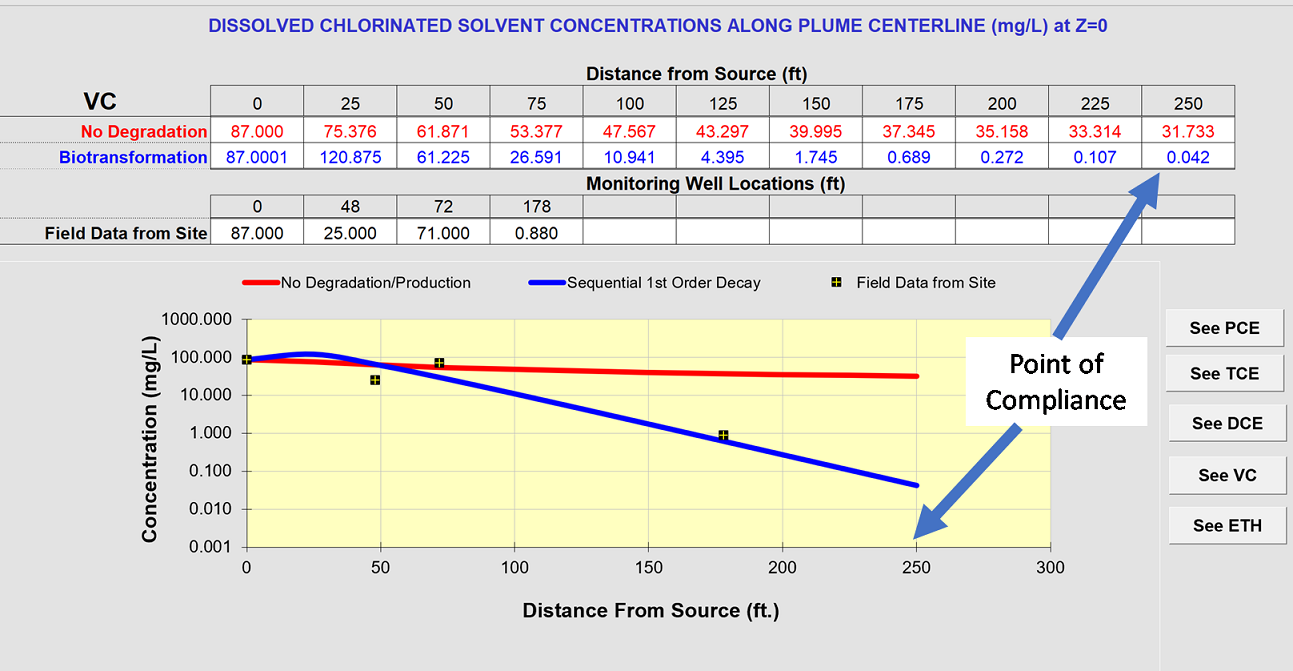
| 21:19, 9 January 2020 | Wilson1w2Fig5.png (file) |  |
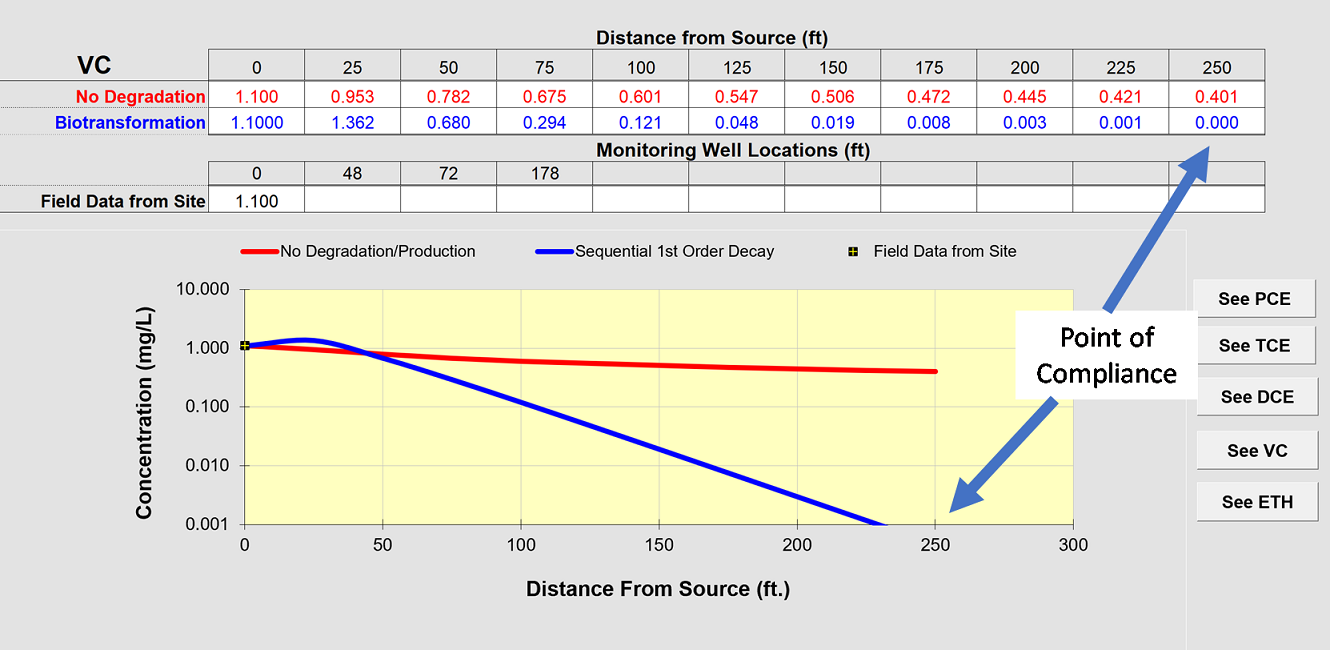
197 KB | Figure 5. Output of the RUN CENTERLINE simulation of conditions after an active remedy was implemented with a source concentration of 1.1 mg/L, projecting the concentration of vinyl chloride at a distance corresponding to a point-of-compliance well. | 1 |
| 21:16, 9 January 2020 | Wilson1w2Fig4.png (file) |  |
240 KB | Figure 4. Output of the RUN CENTERLINE simulation in BIOCHLOR comparing the fit between the simulation and the field data for vinyl chloride before an active remedy was implemented. | 1 |
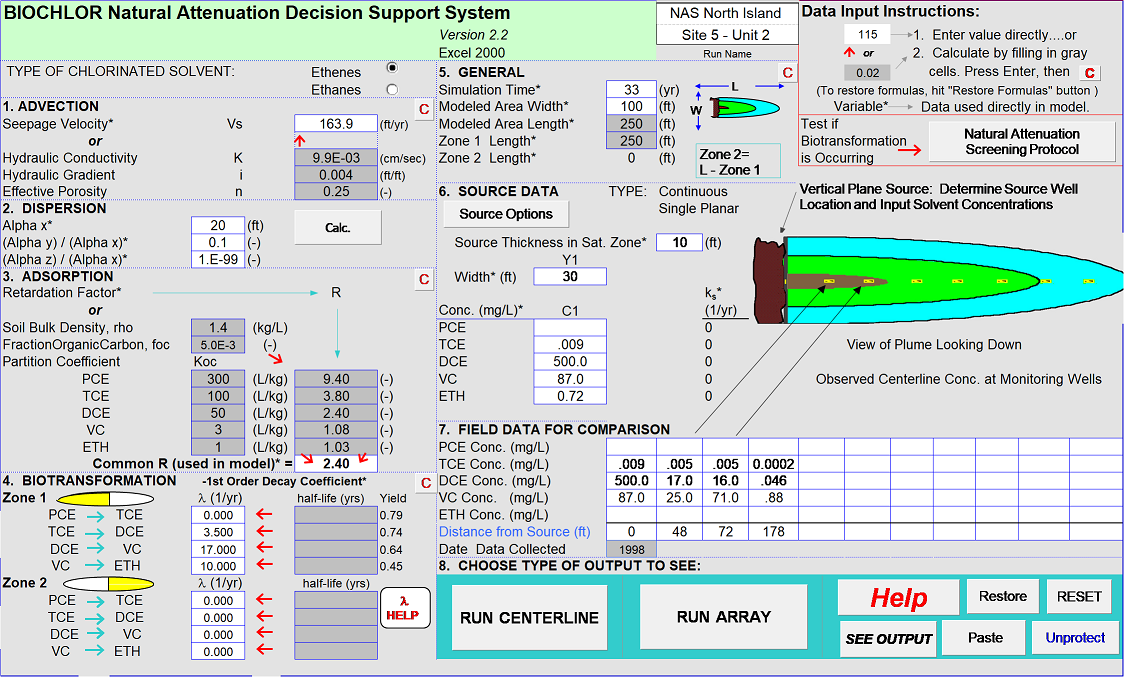
| 21:14, 9 January 2020 | Wilson1w2Fig3.png (file) |  |
458 KB | Figure 3. The data input screen for BIOCHLOR before remediation with cis-1,2-Dichloroethene (DCE) and vinyl chloride (VC) source concentrations of 500 and 87 mg/L respectively at the source when the release first occurred | 1 |
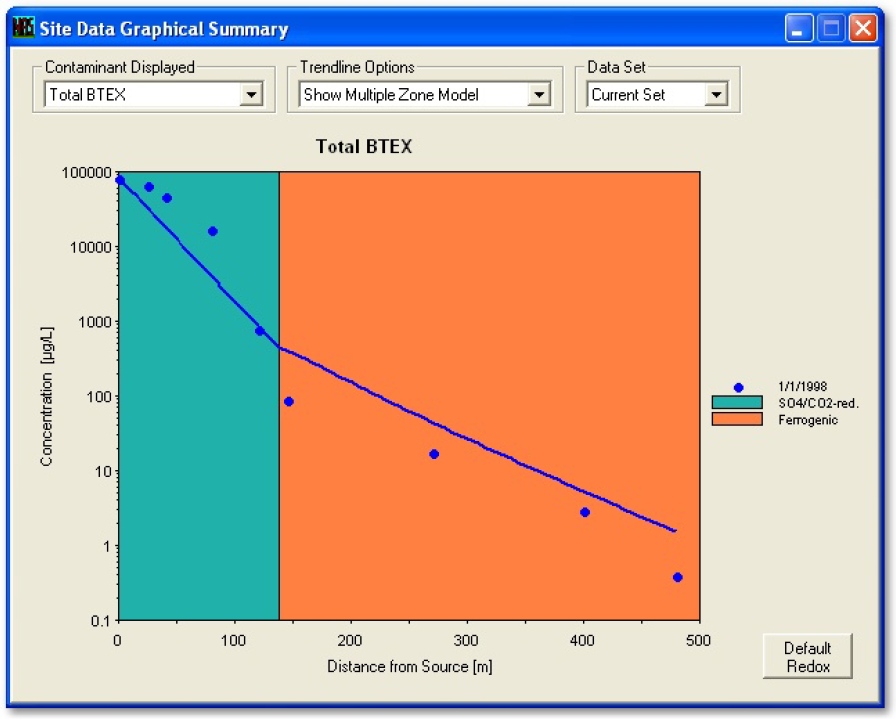
| 21:06, 9 January 2020 | Wilson1w2Fig2.png (file) |  |
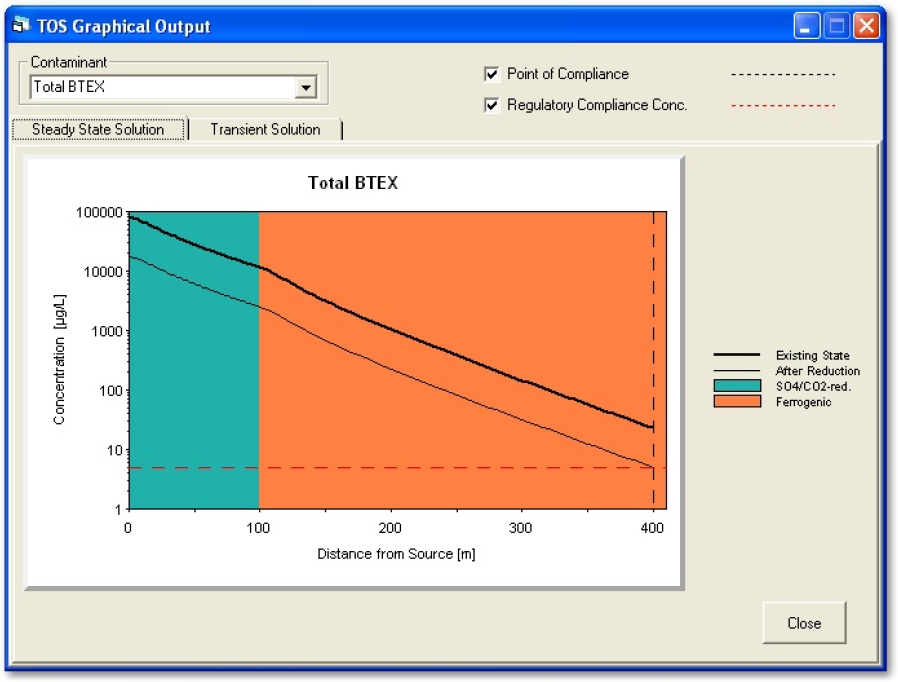
237 KB | Figure 2. Example calibration of NAS to natural attenuation of total BTEX at a site (Figure 17 of NAS User’s Manual). | 1 |
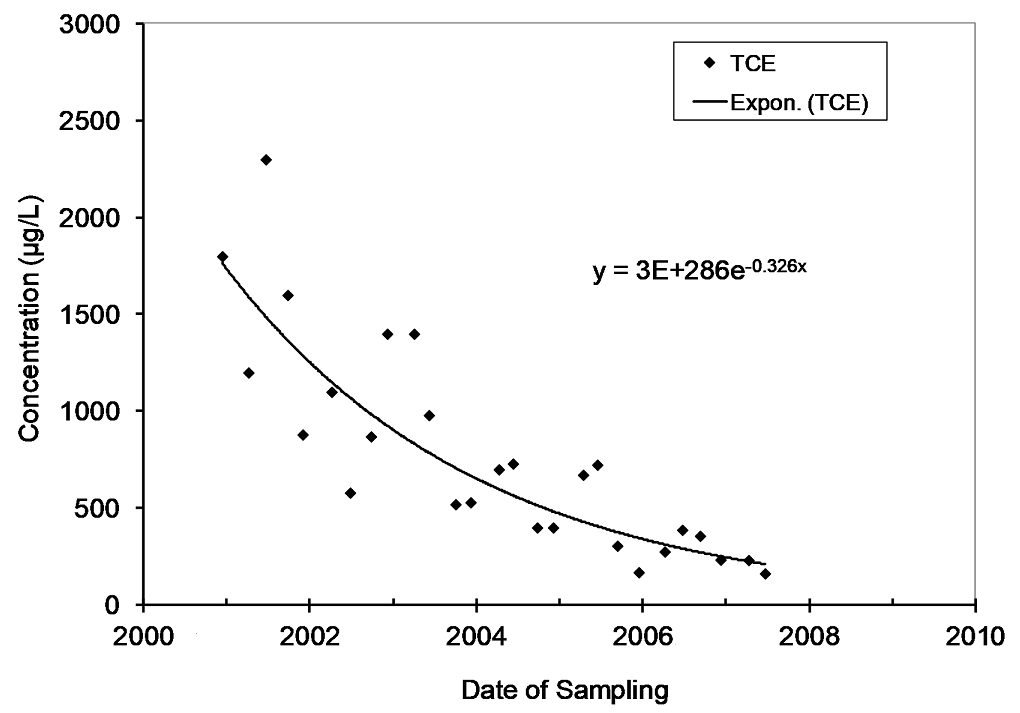
| 21:00, 9 January 2020 | Wilson1w2Fig1.png (file) |  |
55 KB | Figure 1. Attenuation of Trichloroethene (TCE) over time in a monitoring well at a site in Michigan. The concentration vs. time rate constant is 0.326 per year and largely represents the rate of the attenuation of the source of contaminants in the aq... | 1 |
| 22:20, 18 February 2016 | Wilson-2011-An Approach for Evaluating Progress.pdf (file) | 1.12 MB | Wilson, J.T. 2011. An Approach for Evaluating the Progress of Natural Attenuation in Groundwater. EPA 600-R-11-204. | 1 | |
| 20:58, 12 May 2016 | Wilson-2008-Natural attenuation of the lead scavengers.pdf (file) | 2.2 MB | Wilson, J.T., Banks, K., Earle, R.C., He, Y., Kuder, T. and Adair, C., 2008. Natural attenuation of the lead scavengers 1, 2-dibromoethane (EDB) and 1, 2-dichloroethane (1, 2-DCA) at motor fuel release sites and implications for risk management. US Env... | 1 | |
| 19:52, 16 February 2016 | Wilson-2005-MNA of MTBE.pdf (file) | 6.06 MB | Wilson, J.T., Kaiser, P.M., and Adair, C. 2005. Monitored Natural Attenuation of MTBE as a Risk Management Option at Leaking Underground Storage Tank Sites EPA/600/R-04/1790. | 1 | |
| 19:21, 8 April 2020 | Williams-2006 Fate and transport of PHCs.pdf (file) | 2.33 MB | Williams, S.D., Ladd, D.E., and Farmer, J.J., 2006. Fate and transport of petroleum hydrocarbons in soil and ground water at Big South Fork National River and Recreation Area, Tennessee and Kentucky, 2002-2003. U.S. Geological Survey Scientific Investi... | 1 | |
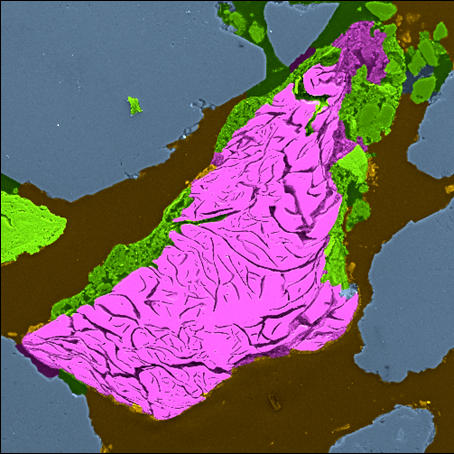
| 19:33, 23 January 2019 | Wilkin1w2 Fig2.png (file) |  |
410 KB | Figure 2. False-color scanning electron micrograph | 1 |
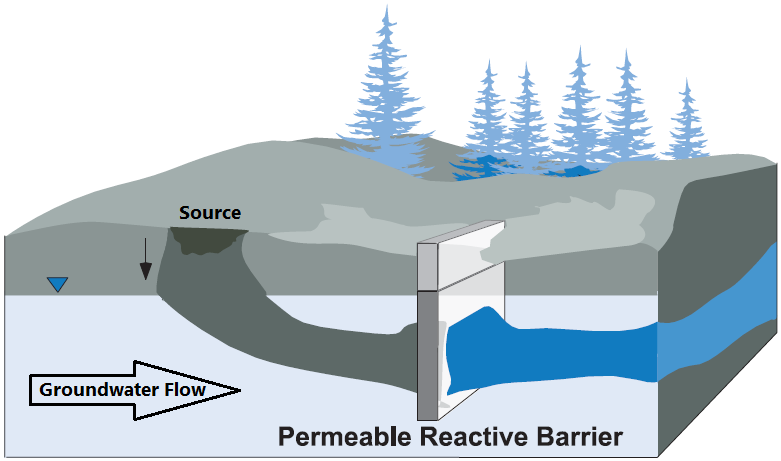
| 19:33, 23 January 2019 | Wilkin1w2 Fig1.png (file) |  |
48 KB | Conceptual Model of PRB. Adapted from Wilkin, et al., 2002 | 1 |
| 16:31, 4 August 2016 | Wilkin-2007-Metal Attenuation Processes at Mining Sites.pdf (file) | 475 KB | Wilkin, R.T., 2007. Metal Attenuation Processes at Mining Sites. Environmental Protection Agency, EPA/600/R-07/092 | 1 | |
| 18:41, 16 February 2016 | Wiedemeier-1999-technical Protocol for implementing Intrinsic remediation.pdf (file) | 9.88 MB | Wiedemeier, T.H., Wilson, J.T., Kampbell, D.H., Miller, R.N. and Hansen, J.E., 1999. Technical Protocol for Implementing Intrinsic Remediation with Long-Term Monitoring for Natural Attenuation of Fuel Contamination Dissolved in Groundwater. Volume I. | 1 | |
| 19:37, 16 February 2016 | Wiedemeier-1998-Technical Protocol for Evaluating Natuaral Attenuation.pdf (file) | 2.46 MB | Wiedemeier, T.H., Swanson, M.A., Moutoux, D.E., Gordon, E.K., Wilson, J.T., Wilson, B.H., Kampbell, D.H., Haas, P.E., Hansen, J.E., Chapelle, F.H. 1998. Technical Protocol for Evaluating Natural Attenuation of Chlorinated Solvents in Ground Water.... | 1 | |
| 15:07, 8 April 2016 | Widdowson2005-NAS Users Guide.pdf (file) | 3.56 MB | Widdowson, M.A., Mendez III, E., Chapelle, F.H. and Casey, C.C., 2005. Natural Attenuation Software (NAS) User’s Manual Version 2. | 1 | |
| 14:17, 25 May 2016 | Wick-2011-Virginia Tech PAH Remediation Lit Review.pdf (file) | 925 KB | Wick, A.F., Haus, N.W., Sukkariyah, B.F., Haering, K.C., Daniels, W.L. Remediation of PAH-Contaminated Soils and Sediments: A Literature Review. Virginia Polytechnic Institute and State University, Department of Crop and Soil Environmental Sciences, Bl... | 1 | |
| 19:17, 8 April 2020 | Weisman-1998 TPH Criteria Working Group Series Vol1 .pdf (file) | 733 KB | Weisman, W., 1998. Analysis of Petroleum Hydrocarbons in Environmental Media, Total Petroleum Hydrocarbon Criteria Working Group Series, v.1. Amherst Scientific Publishers, Amherst, Mass. | 1 | |
| 12:36, 22 June 2016 | Wehrmann-1996-GW Contamination by VOC Site Charac. Spatial and Temporal Var .pdf (file) | 2.96 MB | Wehrmann, H.A., Barcelona, M.J., Varljen, M.D., and Blinkiewicz, G. (1996) Table 9 in Groundwater Contamination by Volatile Organic Compounds: Site Characterization, Spatial and Temporal Variability. Illinois State Water Survey Contract Report 591. | 1 | |
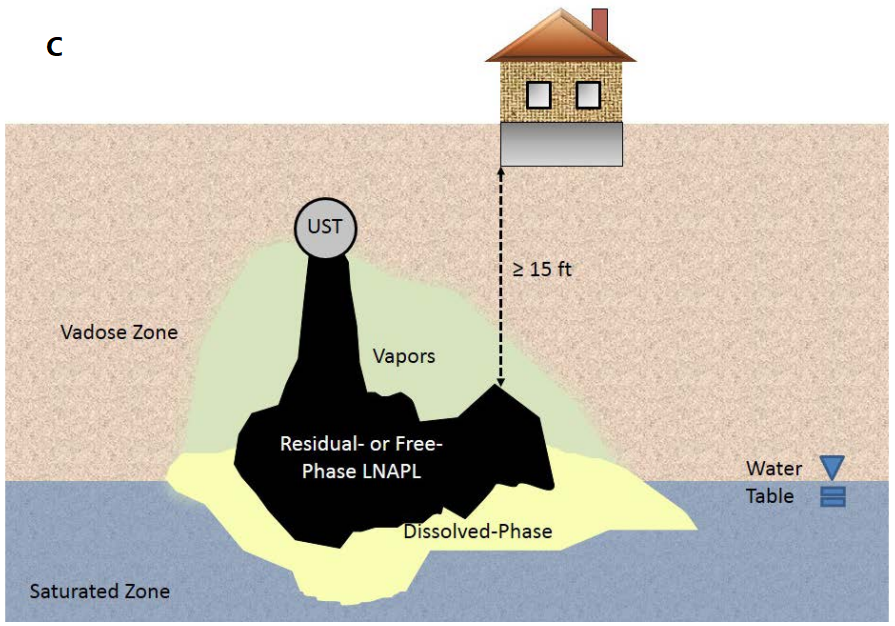
| 13:40, 5 April 2019 | Weaver1w2fig2c.png (file) |  |
584 KB | Figure 2, Panel C: Vertical separation distance from LNAPL petroleum contamination. | 1 |
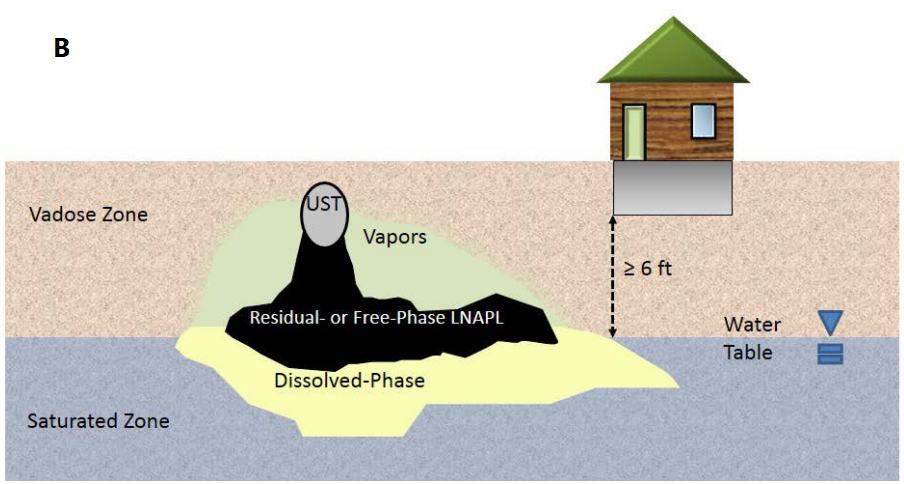
| 13:38, 5 April 2019 | Weaver1w2fig2b.png (file) |  |
426 KB | Figure 2, Panel B: Vertical separation distance from aqueous phase petroleum contamination. | 1 |
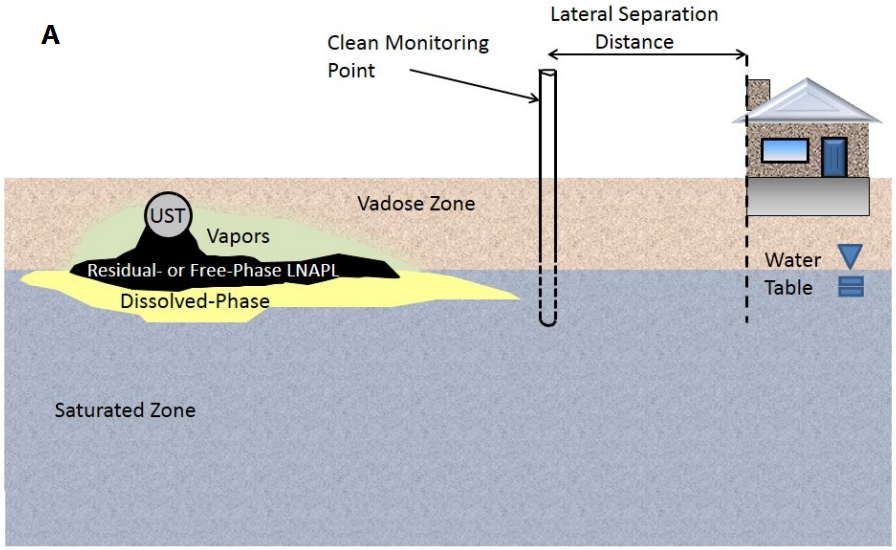
| 13:37, 5 April 2019 | Weaver1w2fig2a.png (file) |  |
479 KB | Figure 2, Panel A: Lateral separation distance from petroleum contamination. | 1 |
| 13:31, 5 April 2019 | Weaver1w2fig1.png (file) |  |
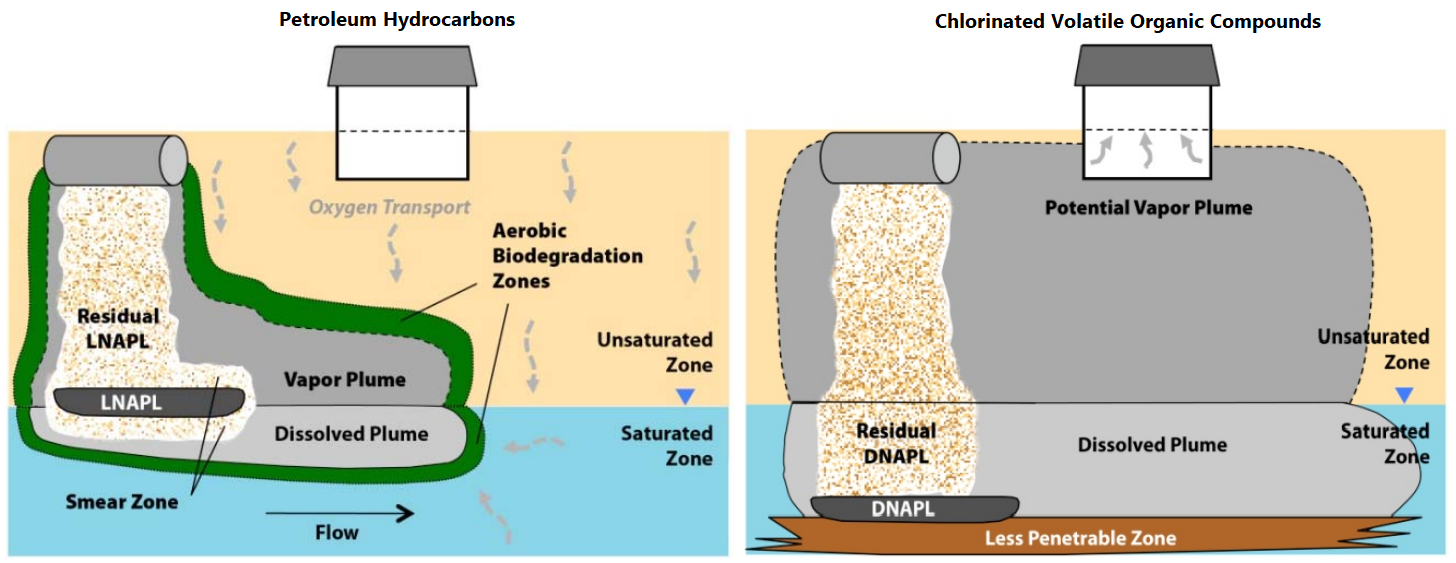
598 KB | Figure 1 Typical conceptual models for vapor intrusion from a release of petroleum hydrocarbons (such as a fuel spill) and for a release of chlorinated volatile organic compounds | 1 |
| 21:52, 22 January 2020 | Weaver1995 HSSMv1.pdf (file) | 2.01 MB | 21. Weaver, J.W., Charbeneau, R.J., Tauxe, J.D., Lien, B.K. and Provost, J.B., 1995. The Hydrocarbon Spill Screening Model (HSSM) Volume 1: User’s Guide. US EPA, publication EPA/600/R-94/039a, 229pp. | 1 | |
| 20:12, 11 November 2016 | Walsh-Article 1-Table 5.PNG (file) |  |
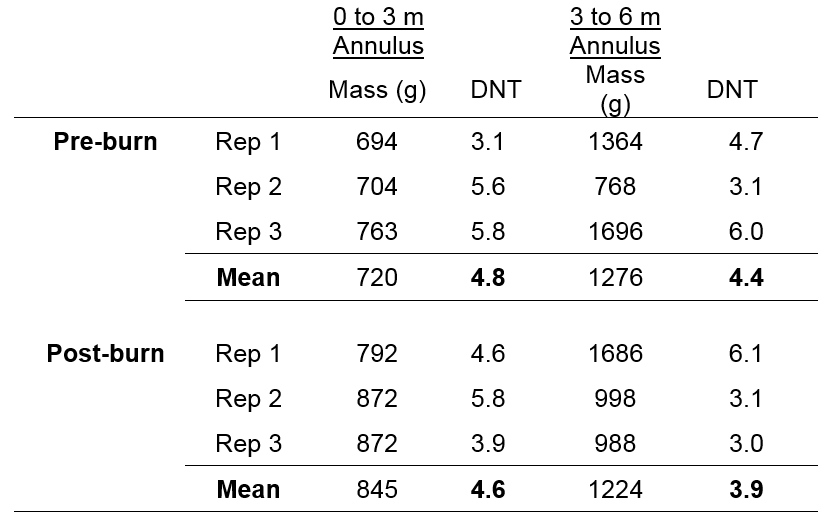
28 KB | Table 5: Soil concentrations of DNT for propellant burn (mg/kg) | 1 |
| 20:10, 11 November 2016 | Walsh-Article 1-Table 3.PNG (file) |  |
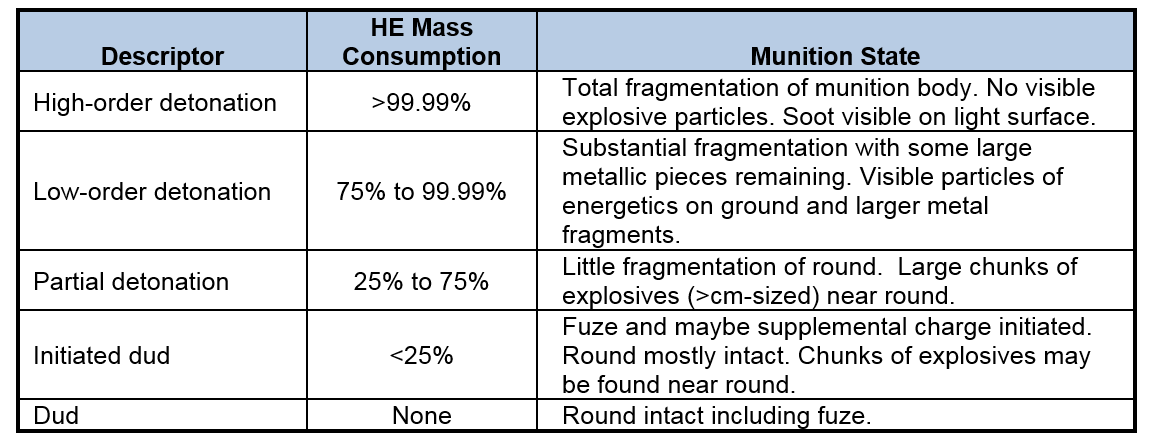
59 KB | Table 3. Detonation efficiency descriptors used by CRREL. | 1 |
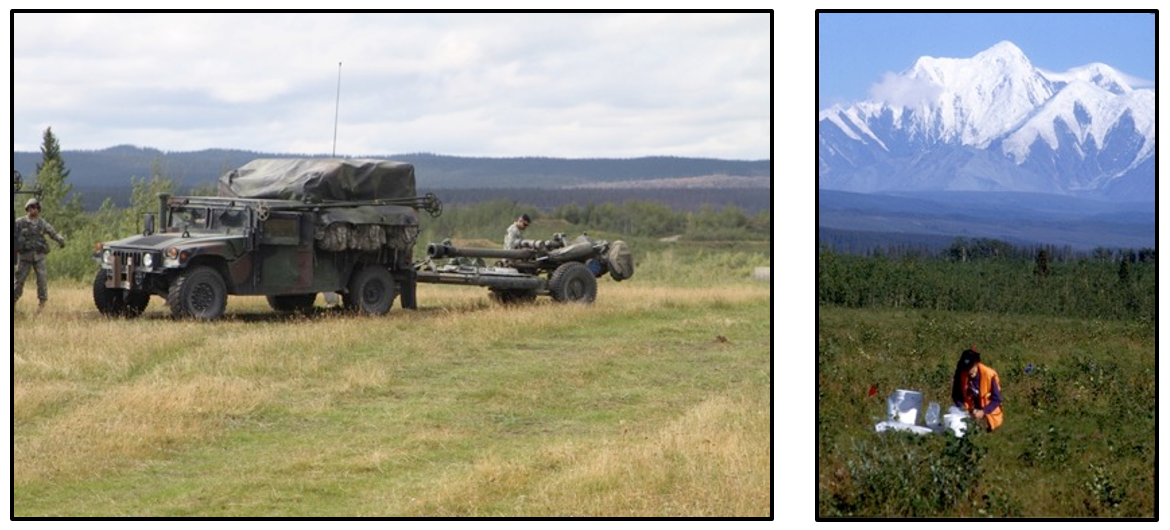
| 20:09, 11 November 2016 | Walsh-Article 1-Figure 5.PNG (file) |  |
1.25 MB | Figure 5. A towed howitzer at FP Sally, DTA. Soil sample labeling at FP Sally following artillery training. | 1 |