Difference between revisions of "User:Debra Tabron/sandbox"
Debra Tabron (talk | contribs) (→Implications for Remediation) |
Debra Tabron (talk | contribs) |
||
| (303 intermediate revisions by the same user not shown) | |||
| Line 1: | Line 1: | ||
| − | + | The heterogeneous distribution of munitions constituents, released as particles from munitions firing and detonations on military training ranges, presents challenges for representative soil sample collection and for defensible decision making. Military range characterization studies and the development of the incremental sampling methodology (ISM) have enabled the development of recommended methods for soil sampling that produce representative and reproducible concentration data for munitions constituents. This article provides a broad overview of recommended soil sampling and processing practices for analysis of munitions constituents on military ranges. | |
<div style="float:right;margin:0 0 2em 2em;">__TOC__</div> | <div style="float:right;margin:0 0 2em 2em;">__TOC__</div> | ||
| + | '''Related Article(s)''': | ||
| − | '''CONTRIBUTOR(S):''' [[Dr. | + | |
| + | '''CONTRIBUTOR(S):''' [[Dr. Samuel Beal]] | ||
'''Key Resource(s)''': | '''Key Resource(s)''': | ||
| − | *[ | + | *[[media:Taylor-2011 ERDC-CRREL TR-11-15.pdf| Guidance for Soil Sampling of Energetics and Metals]]<ref name= "Taylor2011">Taylor, S., Jenkins, T.F., Bigl, S., Hewitt, A.D., Walsh, M.E. and Walsh, M.R., 2011. Guidance for Soil Sampling for Energetics and Metals (No. ERDC/CRREL-TR-11-15). [[media:Taylor-2011 ERDC-CRREL TR-11-15.pdf| Report.pdf]]</ref> |
| + | *[[Media:Hewitt-2009 ERDC-CRREL TR-09-6.pdf| Report.pdf | Validation of Sampling Protocol and the Promulgation of Method Modifications for the Characterization of Energetic Residues on Military Testing and Training Ranges]]<ref name= "Hewitt2009">Hewitt, A.D., Jenkins, T.F., Walsh, M.E., Bigl, S.R. and Brochu, S., 2009. Validation of sampling protocol and the promulgation of method modifications for the characterization of energetic residues on military testing and training ranges (No. ERDC/CRREL-TR-09-6). Engineer Research and Development Center / Cold Regions Research and Engineering Lab (ERDC/CRREL) TR-09-6, Hanover, NH, USA. [[Media:Hewitt-2009 ERDC-CRREL TR-09-6.pdf | Report.pdf]]</ref> | ||
| + | *[[media:Epa-2006-method-8330b.pdf| U.S. EPA SW-846 Method 8330B: Nitroaromatics, Nitramines, and Nitrate Esters by High Performance Liquid Chromatography (HPLC)]]<ref name= "USEPA2006M">U.S. Environmental Protection Agency (USEPA), 2006. Method 8330B (SW-846): Nitroaromatics, Nitramines, and Nitrate Esters by High Performance Liquid Chromatography (HPLC), Rev. 2. Washington, D.C. [[media:Epa-2006-method-8330b.pdf | Report.pdf]]</ref> | ||
| + | *[[media:Epa-2007-method-8095.pdf | U.S. EPA SW-846 Method 8095: Explosives by Gas Chromatography.]]<ref name= "USEPA2007M">U.S. Environmental Protection Agency (US EPA), 2007. Method 8095 (SW-846): Explosives by Gas Chromatography. Washington, D.C. [[media:Epa-2007-method-8095.pdf| Report.pdf]]</ref> | ||
==Introduction== | ==Introduction== | ||
| − | + | [[File:Beal1w2 Fig1.png|thumb|200 px|left|Figure 1: Downrange distance of visible propellant plume on snow from the firing of different munitions. Note deposition behind firing line for the 84-mm rocket. Data from: Walsh et al.<ref>Walsh, M.R., Walsh, M.E., Ampleman, G., Thiboutot, S., Brochu, S. and Jenkins, T.F., 2012. Munitions propellants residue deposition rates on military training ranges. Propellants, Explosives, Pyrotechnics, 37(4), pp.393-406. [http://dx.doi.org/10.1002/prep.201100105 doi: 10.1002/prep.201100105]</ref><ref>Walsh, M.R., Walsh, M.E., Hewitt, A.D., Collins, C.M., Bigl, S.R., Gagnon, K., Ampleman, G., Thiboutot, S., Poulin, I. and Brochu, S., 2010. Characterization and Fate of Gun and Rocket Propellant Residues on Testing and Training Ranges: Interim Report 2. (ERDC/CRREL TR-10-13. Also: ESTCP Project ER-1481) [[media:Walsh-2010 ERDC-CRREL TR-11-15 ESTCP ER-1481.pdf| Report]]</ref>]] | |
| + | [[File:Beal1w2 Fig2.png|thumb|left|200 px|Figure 2: A low-order detonation mortar round (top) with surrounding discrete soil samples produced concentrations spanning six orders of magnitude within a 10m by 10m area (bottom). (Photo and data: A.D. Hewitt)]] | ||
| + | |||
| + | Munitions constituents are released on military testing and training ranges through several common mechanisms. Some are locally dispersed as solid particles from incomplete combustion during firing and detonation. Also, small residual particles containing propellant compounds (e.g., [[Wikipedia: Nitroglycerin | nitroglycerin [NG]]] and [[Wikipedia: 2,4-Dinitrotoluene | 2,4-dinitrotoluene [2,4-DNT]]]) are distributed in front of and surrounding target practice firing lines (Figure 1). At impact areas and demolition areas, high order detonations typically yield very small amounts (<1 to 10 mg/round) of residual high explosive compounds (e.g., [[Wikipedia: TNT | TNT ]], [[Wikipedia: RDX | RDX ]] and [[Wikipedia: HMX | HMX ]]) that are distributed up to and sometimes greater than) 24 m from the site of detonation<ref name= "Walsh2017">Walsh, M.R., Temple, T., Bigl, M.F., Tshabalala, S.F., Mai, N. and Ladyman, M., 2017. Investigation of Energetic Particle Distribution from High‐Order Detonations of Munitions. Propellants, Explosives, Pyrotechnics, 42(8), pp.932-941. [https://doi.org/10.1002/prep.201700089 doi: 10.1002/prep.201700089] [[media: Walsh-2017-High-Order-Detonation-Residues-Particle-Distribution-PEP.pdf| Report.pdf]]</ref>. | ||
| + | |||
| + | Low-order detonations and duds are thought to be the primary source of munitions constituents on ranges<ref>Hewitt, A.D., Jenkins, T.F., Walsh, M.E., Walsh, M.R. and Taylor, S., 2005. RDX and TNT residues from live-fire and blow-in-place detonations. Chemosphere, 61(6), pp.888-894. [https://doi.org/10.1016/j.chemosphere.2005.04.058 doi: 10.1016/j.chemosphere.2005.04.058]</ref><ref>Walsh, M.R., Walsh, M.E., Poulin, I., Taylor, S. and Douglas, T.A., 2011. Energetic residues from the detonation of common US ordnance. International Journal of Energetic Materials and Chemical Propulsion, 10(2). [https://doi.org/10.1615/intjenergeticmaterialschemprop.2012004956 doi: 10.1615/IntJEnergeticMaterialsChemProp.2012004956] [[media:Walsh-2011-Energetic-Residues-Common-US-Ordnance.pdf| Report.pdf]]</ref>. Duds are initially intact but may become perforated or fragmented into micrometer to centimeter;o0i0k-sized particles by nearby detonations<ref>Walsh, M.R., Thiboutot, S., Walsh, M.E., Ampleman, G., Martel, R., Poulin, I. and Taylor, S., 2011. Characterization and fate of gun and rocket propellant residues on testing and training ranges (No. ERDC/CRREL-TR-11-13). Engineer Research and Development Center / Cold Regions Research and Engineering Lab (ERDC/CRREL) TR-11-13, Hanover, NH, USA. [[media:Epa-2006-method-8330b.pdf| Report.pdf]]</ref>. Low-order detonations can scatter micrometer to centimeter-sized particles up to 20 m from the site of detonation<ref name= "Taylor2004">Taylor, S., Hewitt, A., Lever, J., Hayes, C., Perovich, L., Thorne, P. and Daghlian, C., 2004. TNT particle size distributions from detonated 155-mm howitzer rounds. Chemosphere, 55(3), pp.357-367.[[media:Taylor-2004 TNT PSDs.pdf| Report.pdf]]</ref> | ||
| + | |||
| + | The particulate nature of munitions constituents in the environment presents a distinct challenge to representative soil sampling. Figure 2 shows an array of discrete soil samples collected around the site of a low-order detonation – resultant soil concentrations vary by orders of magnitude within centimeters of each other. The inadequacy of discrete sampling is apparent in characterization studies from actual ranges which show wide-ranging concentrations and poor precision (Table 1). | ||
| − | + | In comparison to discrete sampling, incremental sampling tends to yield reproducible concentrations (low relative standard deviation [RSD]) that statistically better represent an area of interest<ref name= "Hewitt2009"/>. | |
| − | |||
| − | == | + | {| class="wikitable" style="float: right; text-align: center; margin-left: auto; margin-right: auto;" |
| − | + | |+ Table 1. Soil Sample Concentrations and Precision from Military Ranges Using Discrete and Incremental Sampling. (Data from Taylor et al. <ref name= "Taylor2011"/> and references therein.) | |
| + | |- | ||
| + | ! Military Range Type !! Analyte !! Range<br/>(mg/kg) !! Median<br/>(mg/kg) !! RSD<br/>(%) | ||
| + | |- | ||
| + | | colspan="5" style="text-align: left;" | '''Discrete Samples''' | ||
| + | |- | ||
| + | | Artillery FP || 2,4-DNT || <0.04 – 6.4 || 0.65 || 110 | ||
| + | |- | ||
| + | | Antitank Rocket || HMX || 5.8 – 1,200 || 200 || 99 | ||
| + | |- | ||
| + | | Bombing || TNT || 0.15 – 780 || 6.4 || 274 | ||
| + | |- | ||
| + | | Mortar || RDX || <0.04 – 2,400 || 1.7 || 441 | ||
| + | |- | ||
| + | | Artillery || RDX || <0.04 – 170 || <0.04 || 454 | ||
| + | |- | ||
| + | | colspan="5" style="text-align: left;" | '''Incremental Samples*''' | ||
| + | |- | ||
| + | | Artillery FP || 2,4-DNT || 0.60 – 1.4 || 0.92 || 26 | ||
| + | |- | ||
| + | | Bombing || TNT || 13 – 17 || 14 || 17 | ||
| + | |- | ||
| + | | Artillery/Bombing || RDX || 3.9 – 9.4 || 4.8 || 38 | ||
| + | |- | ||
| + | | Thermal Treatment || HMX || 3.96 – 4.26 || 4.16 || 4 | ||
| + | |- | ||
| + | | colspan="5" style="text-align: left; background-color: white;" | * For incremental samples, 30-100 increments and 3-10 replicate samples were collected. | ||
| + | |} | ||
| − | == | + | ==Incremental Sampling Approach== |
| − | + | ISM is a requisite for representative and reproducible sampling of training ranges, but it is an involved process that is detailed thoroughly elsewhere<ref name= "Hewitt2009"/><ref name= "Taylor2011"/><ref name= "USEPA2006M"/>. In short, ISM involves the collection of many (30 to >100) increments in a systematic pattern within a decision unit (DU). The DU may cover an area where releases are thought to have occurred or may represent an area relevant to ecological receptors (e.g., sensitive species). Figure 3 shows the ISM sampling pattern in a simplified (5x5 square) DU. Increments are collected at a random starting point with systematic distances between increments. Replicate samples can be collected by starting at a different random starting point, often at a different corner of the DU. Practically, this grid pattern can often be followed with flagging or lathe marking DU boundaries and/or sampling lanes and with individual pacing keeping systematic distances between increments. As an example, an artillery firing point might include a 100x100 m DU with 81 increments. | |
| + | [[File:Beal1w2 Fig3.png|thumb|200 px|left|Figure 3. Example ISM sampling pattern on a square decision unit. Replicates are collected in a systematic pattern from a random starting point at a corner of the DU. Typically more than the 25 increments shown are collected]] | ||
| − | + | DUs can vary in shape (Figure 4), size, number of increments, and number of replicates according to a project’s data quality objectives. | |
| − | |||
| − | + | [[File:Beal1w2 Fig4.png|thumb|right|250 px|Figure 4: Incremental sampling of a circular DU on snow shows sampling lanes with a two-person team in process of collecting the second replicate in a perpendicular path to the first replicate. (Photo: Matthew Bigl)]] | |
| − | + | ==Sampling Tools== | |
| + | In many cases, energetic compounds are expected to reside within the soil surface. Figure 5 shows soil depth profiles on some studied impact areas and firing points. Overall, the energetic compound concentrations below 5-cm soil depth are negligible relative to overlying soil concentrations. For conventional munitions, this is to be expected as the energetic particles are relatively insoluble, and any dissolved compounds readily adsorb to most soils<ref>Pennington, J.C., Jenkins, T.F., Ampleman, G., Thiboutot, S., Brannon, J.M., Hewitt, A.D., Lewis, J., Brochu, S., 2006. Distribution and fate of energetics on DoD test and training ranges: Final Report. ERDC TR-06-13, Vicksburg, MS, USA. Also: SERDP/ESTCP Project ER-1155. [[media:Pennington-2006_ERDC-TR-06-13_ESTCP-ER-1155-FR.pdf| Report.pdf]]</ref>. Physical disturbance, as on hand grenade ranges, may require deeper sampling either with a soil profile or a corer/auger. | ||
| − | + | [[File:Beal1w2 Fig5.png|thumb|left|200 px|Figure 5. Depth profiles of high explosive compounds at impact areas (bottom) and of propellant compounds at firing points (top). Data from: Hewitt et al. <ref>Hewitt, A.D., Jenkins, T.F., Ramsey, C.A., Bjella, K.L., Ranney, T.A. and Perron, N.M., 2005. Estimating energetic residue loading on military artillery ranges: Large decision units (No. ERDC/CRREL-TR-05-7). [[media:Hewitt-2005 ERDC-CRREL TR-05-7.pdf| Report.pdf]]</ref> and Jenkins et al. <ref>Jenkins, T.F., Ampleman, G., Thiboutot, S., Bigl, S.R., Taylor, S., Walsh, M.R., Faucher, D., Mantel, R., Poulin, I., Dontsova, K.M. and Walsh, M.E., 2008. Characterization and fate of gun and rocket propellant residues on testing and training ranges (No. ERDC-TR-08-1). [[media:Jenkins-2008 ERDC TR-08-1.pdf| Report.pdf]]</ref>]] | |
| − | + | Soil sampling with the Cold Regions Research and Engineering Laboratory (CRREL) Multi-Increment Sampling Tool (CMIST) or similar device is an easy way to collect ISM samples rapidly and reproducibly. This tool has an adjustable diameter size corer and adjustable depth to collect surface soil plugs (Figure 6). The CMIST can be used at almost a walking pace (Figure 7) using a two-person sampling team, with one person operating the CMIST and the other carrying the sample container and recording the number of increments collected. The CMIST with a small diameter tip works best in soils with low cohesion, otherwise conventional scoops may be used. Maintaining consistent soil increment dimensions is critical. | |
| − | + | The sampling tool should be cleaned between replicates and between DUs to minimize potential for cross-contamination<ref>Walsh, M.R., 2009. User’s manual for the CRREL Multi-Increment Sampling Tool. Engineer Research and Development Center / Cold Regions Research and Engineering Lab (ERDC/CRREL) SR-09-1, Hanover, NH, USA. [[media:Walsh-2009 ERDC-CRREL SR-09-1.pdf | Report.pdf]]</ref>. | |
| − | + | ==Sample Processing== | |
| + | While only 10 g of soil is typically used for chemical analysis, incremental sampling generates a sample weighing on the order of 1 kg. Splitting of a sample, either in the field or laboratory, seems like an easy way to reduce sample mass; however this approach has been found to produce high uncertainty for explosives and propellants, with a median RSD of 43.1%<ref name= "Hewitt2009"/>. Even greater error is associated with removing a discrete sub-sample from an unground sample. Appendix A in [https://www.epa.gov/sites/production/files/2015-07/documents/epa-8330b.pdf U.S. EPA Method 8330B]<ref name= "USEPA2006M"/> provides details on recommended ISM sample processing procedures. | ||
| − | + | Incremental soil samples are typically air dried over the course of a few days. Oven drying thermally degrades some energetic compounds and should be avoided<ref>Cragin, J.H., Leggett, D.C., Foley, B.T., and Schumacher, P.W., 1985. TNT, RDX and HMX explosives in soils and sediments: Analysis techniques and drying losses. (CRREL Report 85-15) Hanover, NH, USA. [[media:Cragin-1985 CRREL 85-15.pdf| Report.pdf]]</ref>. Once dry, the samples are sieved with a 2-mm screen, with only the less than 2-mm fraction processed further. This size fraction represents the USDA definition of soil. Aggregate soil particles should be broken up and vegetation shredded to pass through the sieve. Samples from impact or demolition areas may contain explosive particles from low order detonations that are greater than 2 mm and should be identified, given appropriate caution, and potentially weighed. | |
| − | |||
| − | + | The <2-mm soil fraction is typically still ≥1 kg and impractical to extract in full for analysis. However, subsampling at this stage is not possible due to compositional heterogeneity, with the energetic compounds generally present as <0.5 mm particles<ref name= "Walsh2017"/><ref name= "Taylor2004"/>. Particle size reduction is required to achieve a representative and precise measure of the sample concentration. Grinding in a puck mill to a soil particle size <75 µm has been found to be required for representative/reproducible sub-sampling (Figure 8). For samples thought to contain propellant particles, a prolonged milling time is required to break down these polymerized particles and achieve acceptable precision (Figure 9). Due to the multi-use nature of some ranges, a 5-minute puck milling period can be used for all soils. Cooling periods between 1-minute milling intervals are recommended to avoid thermal degradation. Similar to field sampling, sub-sampling is done incrementally by spreading the sample out to a thin layer and collecting systematic random increments of consistent volume to a total mass for extraction of 10 g (Figure 10). | |
| − | + | <li style="display: inline-block;">[[File:Beal1w2 Fig6.png|thumb|200 px|Figure 6: CMIST soil sampling tool (top) and with ejected increment core using a large diameter tip (bottom).]]</li> | |
| + | <li style="display: inline-block;">[[File:Beal1w2 Fig7.png|thumb|200 px|Figure 7: Two person sampling team using CMIST, bag-lined bucket, and increment counter. (Photos: Matthew Bigl)]]</li> | ||
| + | <li style="display: inline-block;">[[File:Beal1w2 Fig8.png|thumb|200 px|Figure 8: Effect of machine grinding on RDX and TNT concentration and precision in soil from a hand grenade range. Data from Walsh et al.<ref>Walsh, M.E., Ramsey, C.A. and Jenkins, T.F., 2002. The effect of particle size reduction by grinding on subsampling variance for explosives residues in soil. Chemosphere, 49(10), pp.1267-1273. [https://doi.org/10.1016/S0045-6535(02)00528-3 doi: 10.1016/S0045-6535(02)00528-3]</ref> ]]</li> | ||
| + | <li style="display: inline-block;">[[File:Beal1w2 Fig9.png|thumb|200 px|Figure 9: Effect of puck milling time on 2,4-DNT concentration and precision in soil from a firing point. Data from Walsh et al.<ref>Walsh, M.E., Ramsey, C.A., Collins, C.M., Hewitt, A.D., Walsh, M.R., Bjella, K.L., Lambert, D.J. and Perron, N.M., 2005. Collection methods and laboratory processing of samples from Donnelly Training Area Firing Points, Alaska, 2003 (No. ERDC/CRREL-TR-05-6). [[media:Walsh-2005 ERDC-CRREL TR-05-6.pdf| Report.pdf]]</ref>.]]</li> | ||
| + | <li style="display: inline-block;">[[File:Beal1w2 Fig10.png|thumb|200 px|center|Figure 10: Incremental sub-sampling of a milled soil sample spread out on aluminum foil.]]</li> | ||
| − | == | + | ==Analysis== |
| − | + | Soil sub-samples are extracted and analyzed following [[Media: epa-2006-method-8330b.pdf | EPA Method 8330B]]<ref name= "USEPA2006M"/> and [[Media:epa-2007-method-8095.pdf | Method 8095]]<ref name= "USEPA2007M"/> using [[Wikipedia: High-performance liquid chromatography | High Performance Liquid Chromatography (HPLC)]] and [[Wikipedia: Gas chromatography | Gas Chromatography (GC)]], respectively. Common estimated reporting limits for these analysis methods are listed in Table 2. | |
| + | |||
| + | {| class="wikitable" style="float: center; text-align: center; margin-left: auto; margin-right: auto;" | ||
| + | |+ Table 2. Typical Method Reporting Limits for Energetic Compounds in Soil. (Data from Hewitt et al.<ref>Hewitt, A., Bigl, S., Walsh, M., Brochu, S., Bjella, K. and Lambert, D., 2007. Processing of training range soils for the analysis of energetic compounds (No. ERDC/CRREL-TR-07-15). Hanover, NH, USA. [[media:Hewitt-2007 ERDC-CRREL TR-07-15.pdf| Report.pdf]]</ref>) | ||
| + | |- | ||
| + | ! rowspan="2" | Compound | ||
| + | ! colspan="2" | Soil Reporting Limit (mg/kg) | ||
| + | |- | ||
| + | ! HPLC (8330) | ||
| + | ! GC (8095) | ||
| + | |- | ||
| + | | HMX || 0.04 || 0.01 | ||
| + | |- | ||
| + | | RDX || 0.04 || 0.006 | ||
| + | |- | ||
| + | | [[Wikipedia: 1,3,5-Trinitrobenzene | TNB]] || 0.04 || 0.003 | ||
| + | |- | ||
| + | | TNT || 0.04 || 0.002 | ||
| + | |- | ||
| + | | [[Wikipedia: 2,6-Dinitrotoluene | 2,6-DNT]] || 0.08 || 0.002 | ||
| + | |- | ||
| + | | 2,4-DNT || 0.04 || 0.002 | ||
| + | |- | ||
| + | | 2-ADNT || 0.08 || 0.002 | ||
| + | |- | ||
| + | | 4-ADNT || 0.08 || 0.002 | ||
| + | |- | ||
| + | | NG || 0.1 || 0.01 | ||
| + | |- | ||
| + | | [[Wikipedia: Dinitrobenzene | DNB ]] || 0.04 || 0.002 | ||
| + | |- | ||
| + | | [[Wikipedia: Tetryl | Tetryl ]] || 0.04 || 0.01 | ||
| + | |- | ||
| + | | [[Wikipedia: Pentaerythritol tetranitrate | PETN ]] || 0.2 || 0.016 | ||
| + | |} | ||
==References== | ==References== | ||
| − | |||
<references/> | <references/> | ||
==See Also== | ==See Also== | ||
| + | *[https://itrcweb.org/ Interstate Technology and Regulatory Council] | ||
| + | *[http://www.hawaiidoh.org/tgm.aspx Hawaii Department of Health] | ||
| + | *[http://envirostat.org/ Envirostat] | ||
Latest revision as of 18:58, 29 April 2020
The heterogeneous distribution of munitions constituents, released as particles from munitions firing and detonations on military training ranges, presents challenges for representative soil sample collection and for defensible decision making. Military range characterization studies and the development of the incremental sampling methodology (ISM) have enabled the development of recommended methods for soil sampling that produce representative and reproducible concentration data for munitions constituents. This article provides a broad overview of recommended soil sampling and processing practices for analysis of munitions constituents on military ranges.
Related Article(s):
CONTRIBUTOR(S): Dr. Samuel Beal
Key Resource(s):
- Guidance for Soil Sampling of Energetics and Metals[1]
- Report.pdf | Validation of Sampling Protocol and the Promulgation of Method Modifications for the Characterization of Energetic Residues on Military Testing and Training Ranges[2]
- U.S. EPA SW-846 Method 8330B: Nitroaromatics, Nitramines, and Nitrate Esters by High Performance Liquid Chromatography (HPLC)[3]
- U.S. EPA SW-846 Method 8095: Explosives by Gas Chromatography.[4]
Introduction
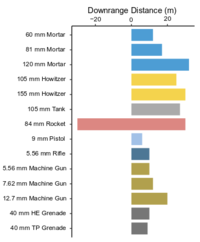
Munitions constituents are released on military testing and training ranges through several common mechanisms. Some are locally dispersed as solid particles from incomplete combustion during firing and detonation. Also, small residual particles containing propellant compounds (e.g., nitroglycerin [NG] and 2,4-dinitrotoluene [2,4-DNT]) are distributed in front of and surrounding target practice firing lines (Figure 1). At impact areas and demolition areas, high order detonations typically yield very small amounts (<1 to 10 mg/round) of residual high explosive compounds (e.g., TNT , RDX and HMX ) that are distributed up to and sometimes greater than) 24 m from the site of detonation[7].
Low-order detonations and duds are thought to be the primary source of munitions constituents on ranges[8][9]. Duds are initially intact but may become perforated or fragmented into micrometer to centimeter;o0i0k-sized particles by nearby detonations[10]. Low-order detonations can scatter micrometer to centimeter-sized particles up to 20 m from the site of detonation[11]
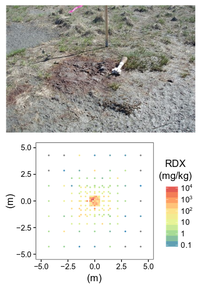
The particulate nature of munitions constituents in the environment presents a distinct challenge to representative soil sampling. Figure 2 shows an array of discrete soil samples collected around the site of a low-order detonation – resultant soil concentrations vary by orders of magnitude within centimeters of each other. The inadequacy of discrete sampling is apparent in characterization studies from actual ranges which show wide-ranging concentrations and poor precision (Table 1).
In comparison to discrete sampling, incremental sampling tends to yield reproducible concentrations (low relative standard deviation [RSD]) that statistically better represent an area of interest[2].
| Military Range Type | Analyte | Range (mg/kg) |
Median (mg/kg) |
RSD (%) |
|---|---|---|---|---|
| Discrete Samples | ||||
| Artillery FP | 2,4-DNT | <0.04 – 6.4 | 0.65 | 110 |
| Antitank Rocket | HMX | 5.8 – 1,200 | 200 | 99 |
| Bombing | TNT | 0.15 – 780 | 6.4 | 274 |
| Mortar | RDX | <0.04 – 2,400 | 1.7 | 441 |
| Artillery | RDX | <0.04 – 170 | <0.04 | 454 |
| Incremental Samples* | ||||
| Artillery FP | 2,4-DNT | 0.60 – 1.4 | 0.92 | 26 |
| Bombing | TNT | 13 – 17 | 14 | 17 |
| Artillery/Bombing | RDX | 3.9 – 9.4 | 4.8 | 38 |
| Thermal Treatment | HMX | 3.96 – 4.26 | 4.16 | 4 |
| * For incremental samples, 30-100 increments and 3-10 replicate samples were collected. | ||||
Incremental Sampling Approach
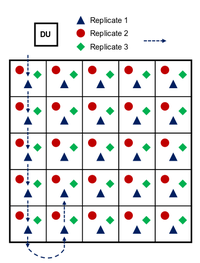
ISM is a requisite for representative and reproducible sampling of training ranges, but it is an involved process that is detailed thoroughly elsewhere[2][1][3]. In short, ISM involves the collection of many (30 to >100) increments in a systematic pattern within a decision unit (DU). The DU may cover an area where releases are thought to have occurred or may represent an area relevant to ecological receptors (e.g., sensitive species). Figure 3 shows the ISM sampling pattern in a simplified (5x5 square) DU. Increments are collected at a random starting point with systematic distances between increments. Replicate samples can be collected by starting at a different random starting point, often at a different corner of the DU. Practically, this grid pattern can often be followed with flagging or lathe marking DU boundaries and/or sampling lanes and with individual pacing keeping systematic distances between increments. As an example, an artillery firing point might include a 100x100 m DU with 81 increments.
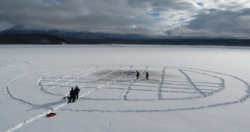
DUs can vary in shape (Figure 4), size, number of increments, and number of replicates according to a project’s data quality objectives.
Sampling Tools
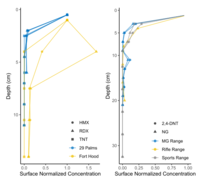
In many cases, energetic compounds are expected to reside within the soil surface. Figure 5 shows soil depth profiles on some studied impact areas and firing points. Overall, the energetic compound concentrations below 5-cm soil depth are negligible relative to overlying soil concentrations. For conventional munitions, this is to be expected as the energetic particles are relatively insoluble, and any dissolved compounds readily adsorb to most soils[12]. Physical disturbance, as on hand grenade ranges, may require deeper sampling either with a soil profile or a corer/auger.
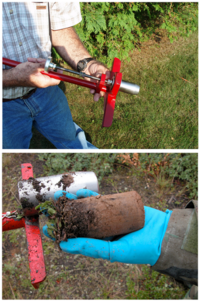
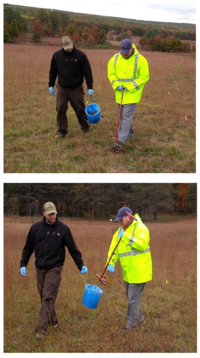
Soil sampling with the Cold Regions Research and Engineering Laboratory (CRREL) Multi-Increment Sampling Tool (CMIST) or similar device is an easy way to collect ISM samples rapidly and reproducibly. This tool has an adjustable diameter size corer and adjustable depth to collect surface soil plugs (Figure 6). The CMIST can be used at almost a walking pace (Figure 7) using a two-person sampling team, with one person operating the CMIST and the other carrying the sample container and recording the number of increments collected. The CMIST with a small diameter tip works best in soils with low cohesion, otherwise conventional scoops may be used. Maintaining consistent soil increment dimensions is critical.
The sampling tool should be cleaned between replicates and between DUs to minimize potential for cross-contamination[15].
Sample Processing
While only 10 g of soil is typically used for chemical analysis, incremental sampling generates a sample weighing on the order of 1 kg. Splitting of a sample, either in the field or laboratory, seems like an easy way to reduce sample mass; however this approach has been found to produce high uncertainty for explosives and propellants, with a median RSD of 43.1%[2]. Even greater error is associated with removing a discrete sub-sample from an unground sample. Appendix A in U.S. EPA Method 8330B[3] provides details on recommended ISM sample processing procedures.
Incremental soil samples are typically air dried over the course of a few days. Oven drying thermally degrades some energetic compounds and should be avoided[16]. Once dry, the samples are sieved with a 2-mm screen, with only the less than 2-mm fraction processed further. This size fraction represents the USDA definition of soil. Aggregate soil particles should be broken up and vegetation shredded to pass through the sieve. Samples from impact or demolition areas may contain explosive particles from low order detonations that are greater than 2 mm and should be identified, given appropriate caution, and potentially weighed.
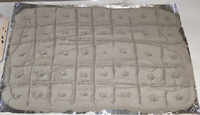
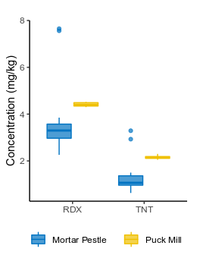
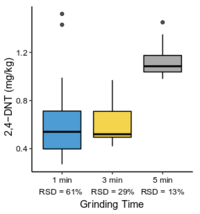
The <2-mm soil fraction is typically still ≥1 kg and impractical to extract in full for analysis. However, subsampling at this stage is not possible due to compositional heterogeneity, with the energetic compounds generally present as <0.5 mm particles[7][11]. Particle size reduction is required to achieve a representative and precise measure of the sample concentration. Grinding in a puck mill to a soil particle size <75 µm has been found to be required for representative/reproducible sub-sampling (Figure 8). For samples thought to contain propellant particles, a prolonged milling time is required to break down these polymerized particles and achieve acceptable precision (Figure 9). Due to the multi-use nature of some ranges, a 5-minute puck milling period can be used for all soils. Cooling periods between 1-minute milling intervals are recommended to avoid thermal degradation. Similar to field sampling, sub-sampling is done incrementally by spreading the sample out to a thin layer and collecting systematic random increments of consistent volume to a total mass for extraction of 10 g (Figure 10).
Analysis
Soil sub-samples are extracted and analyzed following EPA Method 8330B[3] and Method 8095[4] using High Performance Liquid Chromatography (HPLC) and Gas Chromatography (GC), respectively. Common estimated reporting limits for these analysis methods are listed in Table 2.
| Compound | Soil Reporting Limit (mg/kg) | |
|---|---|---|
| HPLC (8330) | GC (8095) | |
| HMX | 0.04 | 0.01 |
| RDX | 0.04 | 0.006 |
| TNB | 0.04 | 0.003 |
| TNT | 0.04 | 0.002 |
| 2,6-DNT | 0.08 | 0.002 |
| 2,4-DNT | 0.04 | 0.002 |
| 2-ADNT | 0.08 | 0.002 |
| 4-ADNT | 0.08 | 0.002 |
| NG | 0.1 | 0.01 |
| DNB | 0.04 | 0.002 |
| Tetryl | 0.04 | 0.01 |
| PETN | 0.2 | 0.016 |
References
- ^ 1.0 1.1 1.2 Taylor, S., Jenkins, T.F., Bigl, S., Hewitt, A.D., Walsh, M.E. and Walsh, M.R., 2011. Guidance for Soil Sampling for Energetics and Metals (No. ERDC/CRREL-TR-11-15). Report.pdf
- ^ 2.0 2.1 2.2 2.3 Hewitt, A.D., Jenkins, T.F., Walsh, M.E., Bigl, S.R. and Brochu, S., 2009. Validation of sampling protocol and the promulgation of method modifications for the characterization of energetic residues on military testing and training ranges (No. ERDC/CRREL-TR-09-6). Engineer Research and Development Center / Cold Regions Research and Engineering Lab (ERDC/CRREL) TR-09-6, Hanover, NH, USA. Report.pdf
- ^ 3.0 3.1 3.2 3.3 U.S. Environmental Protection Agency (USEPA), 2006. Method 8330B (SW-846): Nitroaromatics, Nitramines, and Nitrate Esters by High Performance Liquid Chromatography (HPLC), Rev. 2. Washington, D.C. Report.pdf
- ^ 4.0 4.1 U.S. Environmental Protection Agency (US EPA), 2007. Method 8095 (SW-846): Explosives by Gas Chromatography. Washington, D.C. Report.pdf
- ^ Walsh, M.R., Walsh, M.E., Ampleman, G., Thiboutot, S., Brochu, S. and Jenkins, T.F., 2012. Munitions propellants residue deposition rates on military training ranges. Propellants, Explosives, Pyrotechnics, 37(4), pp.393-406. doi: 10.1002/prep.201100105
- ^ Walsh, M.R., Walsh, M.E., Hewitt, A.D., Collins, C.M., Bigl, S.R., Gagnon, K., Ampleman, G., Thiboutot, S., Poulin, I. and Brochu, S., 2010. Characterization and Fate of Gun and Rocket Propellant Residues on Testing and Training Ranges: Interim Report 2. (ERDC/CRREL TR-10-13. Also: ESTCP Project ER-1481) Report
- ^ 7.0 7.1 Walsh, M.R., Temple, T., Bigl, M.F., Tshabalala, S.F., Mai, N. and Ladyman, M., 2017. Investigation of Energetic Particle Distribution from High‐Order Detonations of Munitions. Propellants, Explosives, Pyrotechnics, 42(8), pp.932-941. doi: 10.1002/prep.201700089 Report.pdf
- ^ Hewitt, A.D., Jenkins, T.F., Walsh, M.E., Walsh, M.R. and Taylor, S., 2005. RDX and TNT residues from live-fire and blow-in-place detonations. Chemosphere, 61(6), pp.888-894. doi: 10.1016/j.chemosphere.2005.04.058
- ^ Walsh, M.R., Walsh, M.E., Poulin, I., Taylor, S. and Douglas, T.A., 2011. Energetic residues from the detonation of common US ordnance. International Journal of Energetic Materials and Chemical Propulsion, 10(2). doi: 10.1615/IntJEnergeticMaterialsChemProp.2012004956 Report.pdf
- ^ Walsh, M.R., Thiboutot, S., Walsh, M.E., Ampleman, G., Martel, R., Poulin, I. and Taylor, S., 2011. Characterization and fate of gun and rocket propellant residues on testing and training ranges (No. ERDC/CRREL-TR-11-13). Engineer Research and Development Center / Cold Regions Research and Engineering Lab (ERDC/CRREL) TR-11-13, Hanover, NH, USA. Report.pdf
- ^ 11.0 11.1 Taylor, S., Hewitt, A., Lever, J., Hayes, C., Perovich, L., Thorne, P. and Daghlian, C., 2004. TNT particle size distributions from detonated 155-mm howitzer rounds. Chemosphere, 55(3), pp.357-367. Report.pdf
- ^ Pennington, J.C., Jenkins, T.F., Ampleman, G., Thiboutot, S., Brannon, J.M., Hewitt, A.D., Lewis, J., Brochu, S., 2006. Distribution and fate of energetics on DoD test and training ranges: Final Report. ERDC TR-06-13, Vicksburg, MS, USA. Also: SERDP/ESTCP Project ER-1155. Report.pdf
- ^ Hewitt, A.D., Jenkins, T.F., Ramsey, C.A., Bjella, K.L., Ranney, T.A. and Perron, N.M., 2005. Estimating energetic residue loading on military artillery ranges: Large decision units (No. ERDC/CRREL-TR-05-7). Report.pdf
- ^ Jenkins, T.F., Ampleman, G., Thiboutot, S., Bigl, S.R., Taylor, S., Walsh, M.R., Faucher, D., Mantel, R., Poulin, I., Dontsova, K.M. and Walsh, M.E., 2008. Characterization and fate of gun and rocket propellant residues on testing and training ranges (No. ERDC-TR-08-1). Report.pdf
- ^ Walsh, M.R., 2009. User’s manual for the CRREL Multi-Increment Sampling Tool. Engineer Research and Development Center / Cold Regions Research and Engineering Lab (ERDC/CRREL) SR-09-1, Hanover, NH, USA. Report.pdf
- ^ Cragin, J.H., Leggett, D.C., Foley, B.T., and Schumacher, P.W., 1985. TNT, RDX and HMX explosives in soils and sediments: Analysis techniques and drying losses. (CRREL Report 85-15) Hanover, NH, USA. Report.pdf
- ^ Walsh, M.E., Ramsey, C.A. and Jenkins, T.F., 2002. The effect of particle size reduction by grinding on subsampling variance for explosives residues in soil. Chemosphere, 49(10), pp.1267-1273. doi: 10.1016/S0045-6535(02)00528-3
- ^ Walsh, M.E., Ramsey, C.A., Collins, C.M., Hewitt, A.D., Walsh, M.R., Bjella, K.L., Lambert, D.J. and Perron, N.M., 2005. Collection methods and laboratory processing of samples from Donnelly Training Area Firing Points, Alaska, 2003 (No. ERDC/CRREL-TR-05-6). Report.pdf
- ^ Hewitt, A., Bigl, S., Walsh, M., Brochu, S., Bjella, K. and Lambert, D., 2007. Processing of training range soils for the analysis of energetic compounds (No. ERDC/CRREL-TR-07-15). Hanover, NH, USA. Report.pdf
