File list
This special page shows all uploaded files.
| Date | Name | Thumbnail | Size | User | Description | Versions |
|---|---|---|---|---|---|---|
| 13:58, 4 January 2019 | WH Picture13.PNG (file) |  |
2.09 MB | Admin | 1 | |
| 13:58, 4 January 2019 | WH Picture12.PNG (file) |  |
5.43 MB | Admin | 1 | |
| 13:58, 4 January 2019 | WH Picture11.PNG (file) |  |
3.89 MB | Admin | 1 | |
| 13:57, 4 January 2019 | WH Picture10.PNG (file) |  |
692 KB | Admin | 1 | |
| 13:57, 4 January 2019 | WH Picture9.PNG (file) |  |
2.16 MB | Admin | 1 | |
| 13:57, 4 January 2019 | WH Picture8.PNG (file) |  |
5.54 MB | Admin | 1 | |
| 13:57, 4 January 2019 | WH Picture7.PNG (file) |  |
7.75 MB | Admin | 1 | |
| 13:57, 4 January 2019 | WH Picture6.PNG (file) |  |
649 KB | Admin | 1 | |
| 13:57, 4 January 2019 | WH Picture5.PNG (file) |  |
1.9 MB | Admin | 1 | |
| 13:56, 4 January 2019 | WH Picture4.PNG (file) |  |
1.1 MB | Admin | 1 | |
| 13:56, 4 January 2019 | WH Picture3.PNG (file) |  |
1.07 MB | Admin | 1 | |
| 13:56, 4 January 2019 | WH Picture2.PNG (file) |  |
4.05 MB | Admin | 1 | |
| 13:56, 4 January 2019 | WH Picture1.PNG (file) |  |
4.45 MB | Admin | 1 | |
| 17:25, 17 December 2018 | Base Add Design Tool - Dec 2018.xlsx (file) | 105 KB | Admin | 1 | ||
| 09:32, 11 December 2018 | Base Add Design Tool - August 2018.xlsx (file) | 83 KB | Admin | 1 | ||
| 10:26, 6 December 2018 | Emulsion Design Tool Dec08.xls (file) | 1.32 MB | Admin | 1 | ||
| 10:25, 6 December 2018 | ER-0626-Emulsion Users Guide.pdf (file) | 1.05 MB | Admin | 1 | ||
| 10:24, 6 December 2018 | Emulsion Design Tool Readme.pdf (file) | 17 KB | Admin | 1 | ||
| 11:29, 15 November 2018 | EOS in the subsurface.gif (file) |  |
18.46 MB | Debra Tabron | 1 | |
| 16:18, 13 November 2018 | Borden3w2 Fig4.png (file) |  |
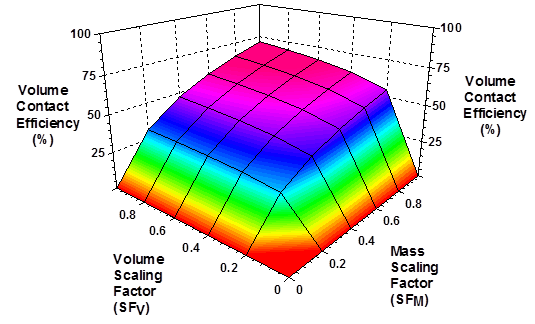
28 KB | Debra Tabron | Figure 4. Effect of volume scaling factor (SFV) and mass scaling factor (SFM) on volume contact efficiency for a moderately heterogeneous aquifer with well spacing approximately equal to row spacing (Borden et al., 2008). | 1 |
| 16:10, 13 November 2018 | Borden3w2 Fig3.png (file) |  |
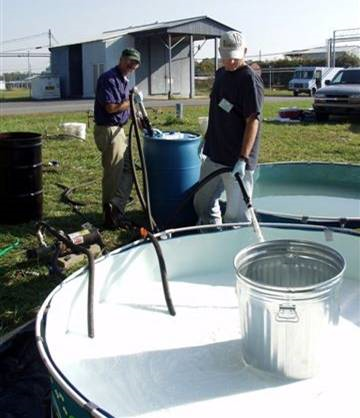
329 KB | Debra Tabron | Figure 3. EVO mixed in field during early pilot test. | 1 |
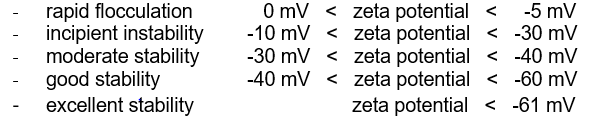
| 15:57, 13 November 2018 | Rules of thumb for negatively charged emulsions.PNG (file) | 15 KB | Debra Tabron | - rapid flocculation 0 mV < zeta potential < -5 mV - incipient instability -10 mV < zeta potential < -30 mV - moderate stability -30 mV < zeta potential < -40 mV - good stability -40 mV < zeta potential < -60 m... | 1 | |
| 15:09, 13 November 2018 | Borden3w2 Fig2.png (file) |  |
132 KB | Debra Tabron | Figure 2. animation illustrating oil droplet transport and retention in porous media. | 1 |
| 15:01, 13 November 2018 | Borden3w2 Fig1.PNG (file) |  |
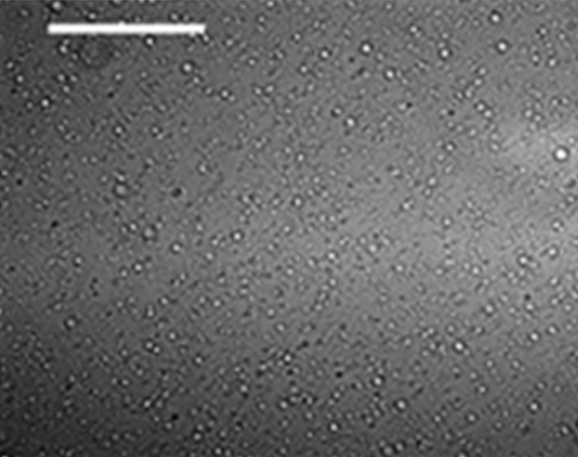
210 KB | Debra Tabron | Figure 1. Photo-micrograph of EVO (0.7 µm median diameter). White scale bar 25 µm. | 1 |
| 13:53, 12 November 2018 | 2008-Borden-Development of a design tool for injections.pdf (file) | 900 KB | Debra Tabron | Borden, R.C., Clayton, M., Weispfenning, A.M., Simpkin, T. and Lieberman, M.T., 2008. Development of a Design Tool for Planning Aqueous Amendment Injection Systems. Environmental Security Technology Certification Program, Arlington, Virginia. ESTCP P... | 1 | |
| 13:58, 9 November 2018 | USEPA-2017. How to Evaluate Alternative Cleanup tech for UST Sites.pdf (file) | 219 KB | Debra Tabron | U.S. Environmental Protection Agency (USEPA), 2017. How to Evaluate Alternative Cleanup Technologies for Underground Storage Tank Sites: A Guide for Corrective Action Plan Reviewers, Chapter V: Landfarming. , Land and Emergency Management 5401R, EPA 51... | 1 | |
| 13:57, 9 November 2018 | USEPA-2003-Landfarming-OSC-Aerobic Biodegradation of Oily Wastes.pdf (file) | 883 KB | Debra Tabron | U.S. Environmental Protection Agency (USEPA), 2003. Aerobic Biodegradation of Oily Wastes: A Field Guidance Book for Federal On-scene Coordinators, Version 1.0, October 2003. Region 6 South Central Response and Prevention Branch | 1 | |
| 13:54, 9 November 2018 | USEPA-2002. Exemption of Oil and Gas exploration and Production Wastes....pdf (file) | 1,010 KB | Debra Tabron | U.S. Environmental Protection Agency (USEPA), 2002. Exemption of Oil and Gas Exploration and Production Wastes from Federal Hazardous Waste Regulations. Office of Solid Waste, EPA530-K-01-004. | 1 | |
| 13:51, 9 November 2018 | USEPA-1993. bio using land treatment.pdf (file) | 2.01 MB | Debra Tabron | U.S. Environmental Protection Agency (USEPA), 1993. Bioremediation Using the Land Treatment Concept. Office of Research and Development, Washington, D.C. | 1 | |
| 13:48, 9 November 2018 | Kamath1w2 Fig9.png (file) |  |
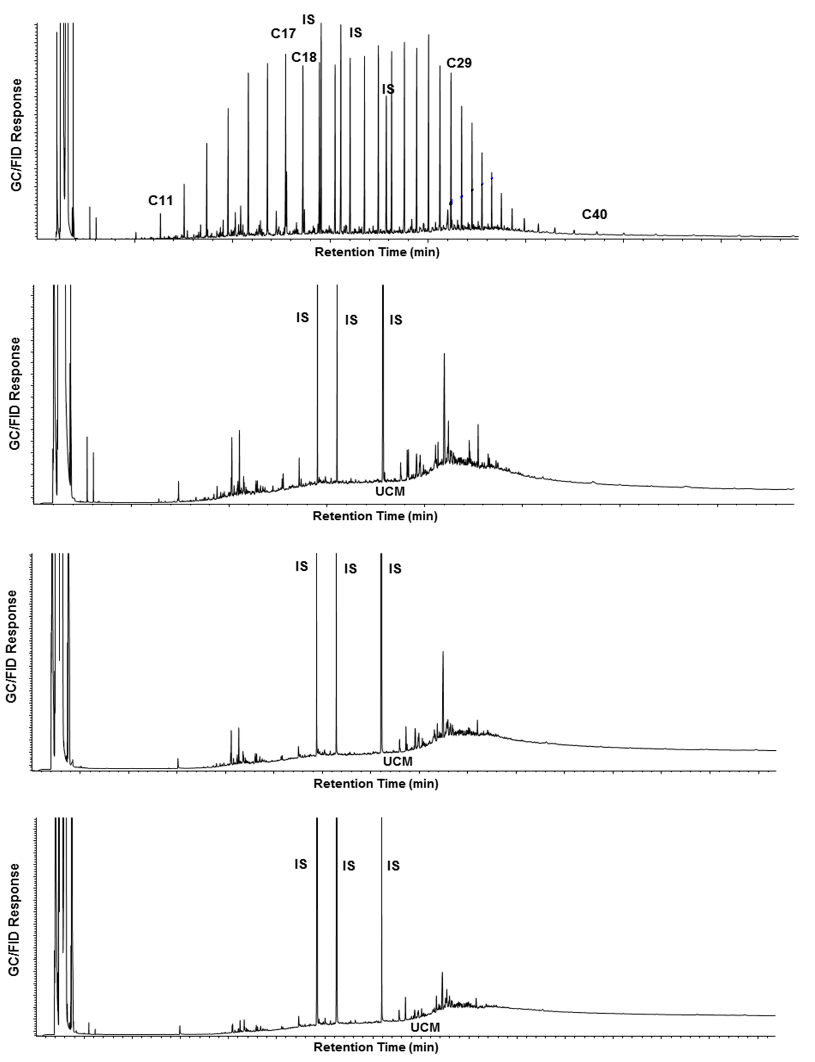
101 KB | Debra Tabron | Figure 9: Chromatogram Change illustrating a crude oil degradation with initial API gravity > 30 (week 0, 3, 7, and 15) | 1 |
| 13:47, 9 November 2018 | Kamath1w2 Fig8.png (file) |  |
81 KB | Debra Tabron | 1 | |
| 13:45, 9 November 2018 | Kamath1w2 Fig7.PNG (file) |  |
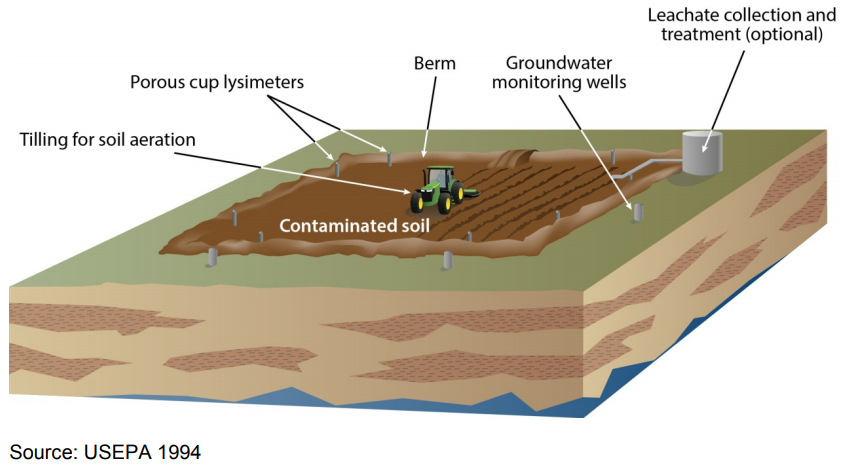
320 KB | Debra Tabron | Typical Landfarming Operation | 1 |
| 13:44, 9 November 2018 | Kamath1w2 Fig6b.png (file) |  |
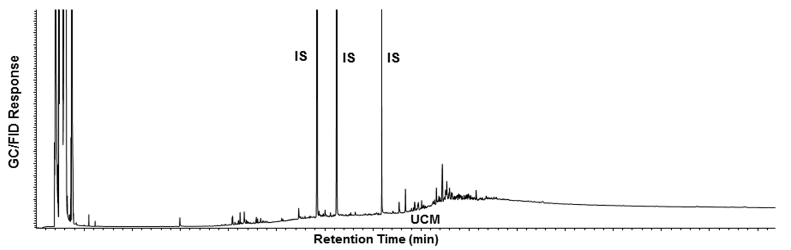
22 KB | Debra Tabron | Chromatogram of weathered crude oil | 1 |
| 13:43, 9 November 2018 | Kamath1w2 Fig6a.png (file) |  |
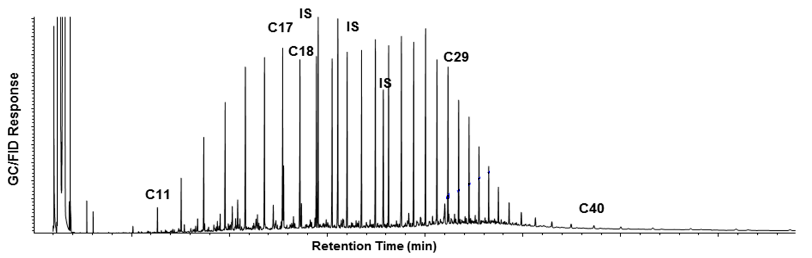
30 KB | Debra Tabron | Figure 6a: Chromatogram of fresh crude oil | 1 |
| 13:42, 9 November 2018 | Kamath1w2 Fig5.png (file) |  |
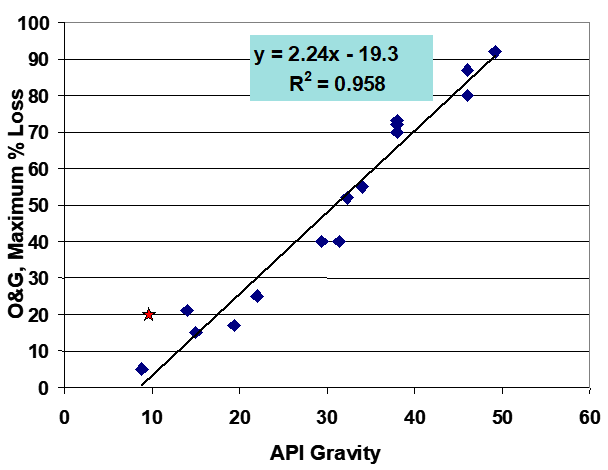
15 KB | Debra Tabron | Figure 5. Correlation between API gravity (specific weight of the crude) and the predicted extent of biodegradation as measured by oil and grease (O&G) (McMillen et al., 2004[5]) | 1 |
| 13:40, 9 November 2018 | Kamath1w2 Fig4.png (file) |  |
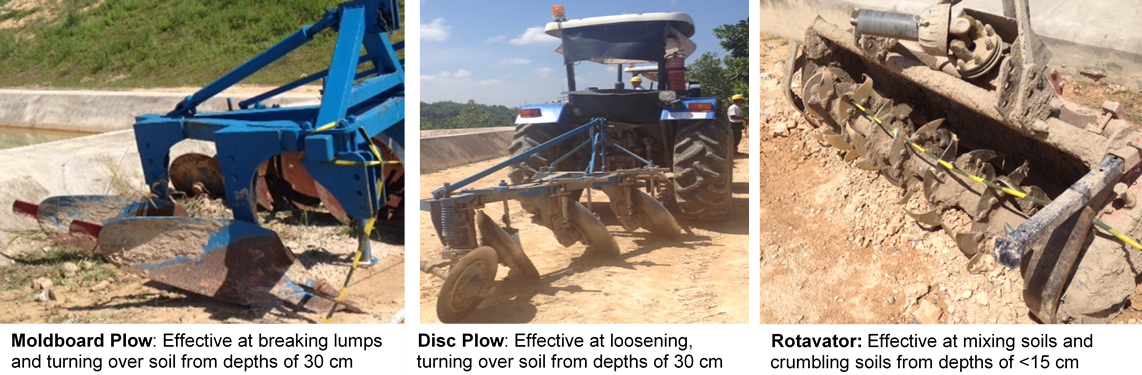
799 KB | Debra Tabron | Figure 4: Rotovator and Plows to till soils | 1 |
| 13:39, 9 November 2018 | Kamath1w2 Fig3.png (file) |  |
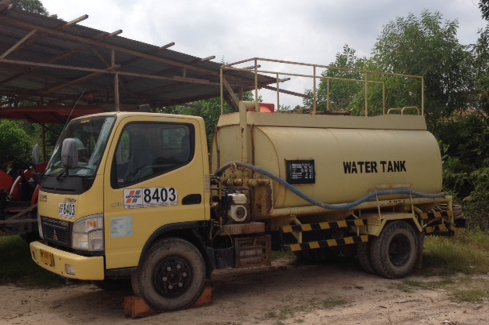
359 KB | Debra Tabron | Figure 3: Water truck to ensure optimal moisture content for microbial degradation in soils. | 1 |
| 13:39, 9 November 2018 | Kamath1w2 Fig2.png (file) |  |
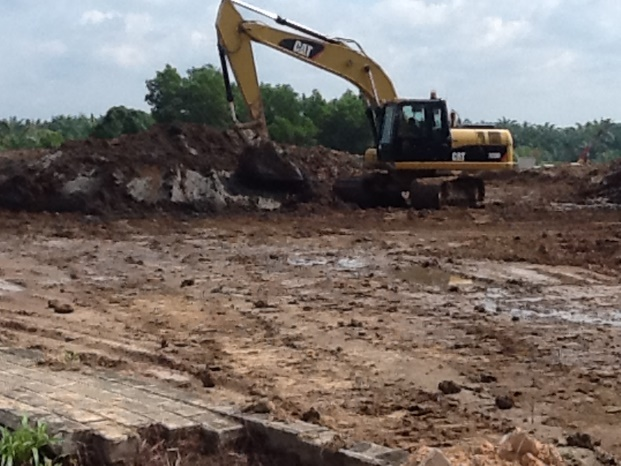
617 KB | Debra Tabron | Figure 2: Excavator to move soils | 1 |
| 13:36, 9 November 2018 | Kamath1w2 Fig1.png (file) |  |
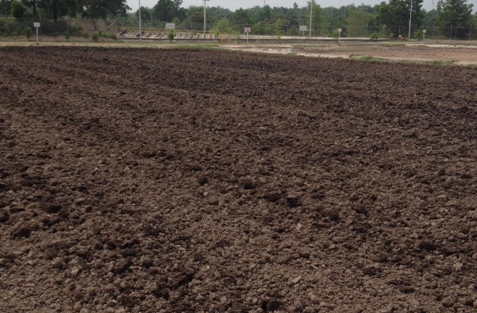
318 KB | Debra Tabron | Figure 1: Soils undergoing treatment at a Landfarming Facility | 1 |
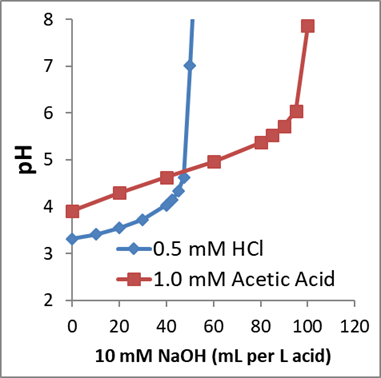
| 13:38, 19 October 2018 | Denham pH buffering Fig3c.PNG (file) |  |
35 KB | Jhurley | 1 | |
| 13:37, 19 October 2018 | Denham pH buffering Fig3.PNG (file) |  |
35 KB | Jhurley | corrected units | 5 |
| 11:35, 19 October 2018 | Borden2w2Fig1.png (file) |  |
1.47 MB | Debra Tabron | 1 | |
| 14:15, 17 October 2018 | Borden2w2Fig7.png (file) |  |
35 KB | Debra Tabron | Figure 7. Required base addition for PRB for different target pH values. | 1 |
| 14:14, 17 October 2018 | Borden2w2Fig6.png (file) |  |
16 KB | Debra Tabron | Figure 6. Fraction of H2CO3 not ionized (α) versus pH. | 1 |
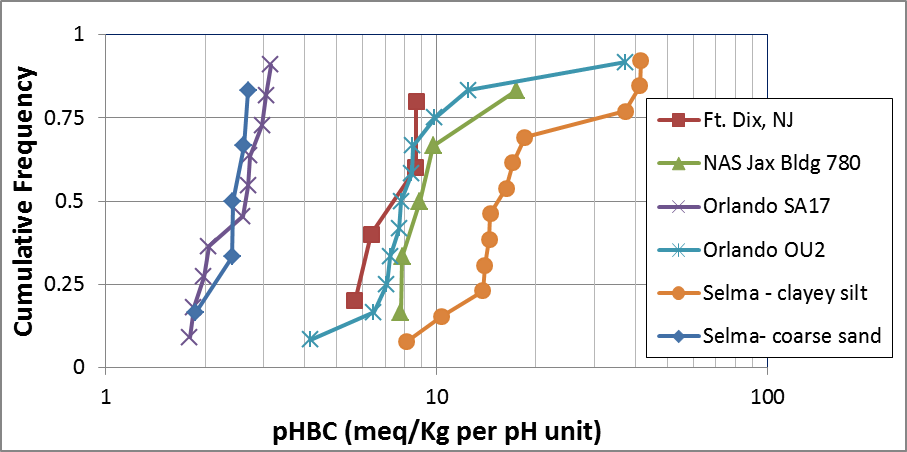
| 14:13, 17 October 2018 | Borden2w2Fig5.png (file) |  |
59 KB | Debra Tabron | Figure 5. Aquifer buffering capacity (pHBC) from multiple ERD sites | 1 |
| 14:11, 17 October 2018 | Borden2w2Fig4.png (file) |  |
61 KB | Debra Tabron | Figure 4. Buffering capacity of aquifer solids from SA-17 and OU-2 measured in DI water<ref name = "Borden2017EVO"/>. The legend shows depth below ground surface in feet for individual samples. | 1 |
| 14:10, 17 October 2018 | Borden2w2Fig3.png (file) |  |
33 KB | Debra Tabron | Figure 3. Distribution of H<sub>2</sub>CO<sub>3</sub>*, HCO<sub>3</sub><sup>-</sup> and CO<sub>3</sub><sup>2-</sup> as a function of pH. | 1 |
| 14:07, 17 October 2018 | Borden2w2Fig2.png (file) |  |
20 KB | Debra Tabron | Figure 2. Cumulative frequency distribution of groundwater pH measurements at site in eastern North Carolina where soil pH is approximately 5. | 1 |
| 12:14, 20 September 2018 | 2006-USEPA-Wadeable Streams Assessment.pdf (file) | 13.43 MB | Debra Tabron | US Environmental Protection Agency (EPA). 2006. Wadeable Streams Assessment: A Collaborative Survey of the Nation’s Streams. EPA 841-B-06-002. US EPA, Office of Research and Development, Office of Water, Washington DC 2046 | 1 | |
| 13:54, 19 September 2018 | 1999-Barbour-Rapid bioassessment protocols for use in streams and wadeable rivers.pdf (file) | 3.94 MB | Debra Tabron | Barbour, M.T., J. Gerritsen, B.D. Snyder, and J.B. Stribling. 1999. Rapid bioassessment protocols for use in streams and wadeable rivers: periphyton, benthic macroinvertebrates, and fish. Second edition. EPA 841-B-99-02. U.S. Environmental Protection A... | 1 |