Difference between revisions of "Dispersion and Diffusion"
(→Molecular Diffusion) |
(→Macrodispersion) |
||
| Line 104: | Line 104: | ||
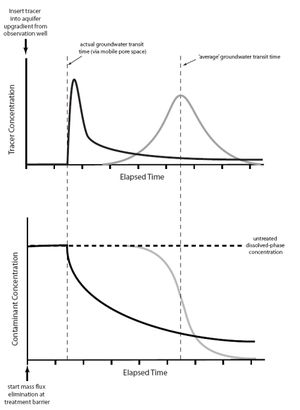
[[File:Fig4 dispanddiff.JPG|thumbnail|left|300px|Figure 4. Comparison of tracer breakthrough (upper graph) and cleanup curves from advection-dispersion based (gray lines) and advection-diffusion based (black lines) solute transport<ref name="ITRC2011" /> (adapted from Payne et al. (2008)<ref name="Payne2008" />).]] | [[File:Fig4 dispanddiff.JPG|thumbnail|left|300px|Figure 4. Comparison of tracer breakthrough (upper graph) and cleanup curves from advection-dispersion based (gray lines) and advection-diffusion based (black lines) solute transport<ref name="ITRC2011" /> (adapted from Payne et al. (2008)<ref name="Payne2008" />).]] | ||
| − | Recently, an alternate conceptual model for describing large-scale plume spreading has been proposed<ref name="Payne2008" /><ref name="ITRC2011" /><ref name="Hadley2014" />. In this approach, solute transport in the transmissive zones is reasonably well described by the advection-dispersion equation using relatively small dispersion coefficients representing mechanical dispersion. However, overtime, molecular diffusion slowly transports solutes into lower permeability zones (Figure 3). As the transmissive zones are remediated, these solutes slowly diffuse back out, causing a long extended tail to the flushout curve. This process is controlled by diffusion and the presence of geologic heterogeneity with sharp contrasts between transmissive and low permeability media<ref>Sale, T.C., Illangasekare, T., Zimbron, J., Rodriguez, D., Wilkins, B. and Marinelli, F., 2007. AFCEE source zone initiative. Report Prepared for the Air Force Center for Environmental Excellence by Colorado State University and Colorado School of Mines. [//www.enviro.wiki/images/0/08/AFCEE-2007-Sale.pdf Report pdf]</ref> as discussed in the [[Media:NewThinkingAboutDispersion.mp4 | video]] shown in Figure 3. | + | Recently, an alternate conceptual model for describing large-scale plume spreading in heterogeneous soils has been proposed<ref name="Payne2008" /><ref name="ITRC2011" /><ref name="Hadley2014" />. In this approach, solute transport in the transmissive zones is reasonably well described by the advection-dispersion equation using relatively small dispersion coefficients representing mechanical dispersion. However, overtime, molecular diffusion slowly transports solutes into lower permeability zones (Figure 3). As the transmissive zones are remediated, these solutes slowly diffuse back out, causing a long extended tail to the flushout curve. This process is controlled by diffusion and the presence of geologic heterogeneity with sharp contrasts between transmissive and low permeability media<ref>Sale, T.C., Illangasekare, T., Zimbron, J., Rodriguez, D., Wilkins, B. and Marinelli, F., 2007. AFCEE source zone initiative. Report Prepared for the Air Force Center for Environmental Excellence by Colorado State University and Colorado School of Mines. [//www.enviro.wiki/images/0/08/AFCEE-2007-Sale.pdf Report pdf]</ref> as discussed in the [[Media:NewThinkingAboutDispersion.mp4 | video]] shown in Figure 3. |
==Impacts on Breakthrough Curves== | ==Impacts on Breakthrough Curves== | ||
Revision as of 14:06, 15 September 2020
Dispersion of solutes in flowing groundwater results in the spreading of a contaminant plume from highly concentrated areas to less concentrated areas. In many groundwater transport models, solute transport is described by the advection-dispersion-reaction equation. The dispersion coefficient in this equation is the sum of the molecular diffusion coefficient, the mechanical dispersion coefficient and the macrodispersion effect.
Related Article(s):
CONTRIBUTOR(S):
Key Resource(s):
- Groundwater[1], Freeze and Cherry, 1979.
- Hydrogeologic Properties of Earth Materials and Principals of Groundwater Flow[2], Woessner and Poeter, 2020.
Molecular Diffusion

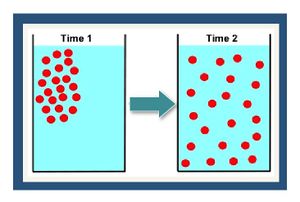
Molecular diffusion is the result of the thermal motion of individual molecules which causes a flux of dissolved solutes from areas of higher concentration to areas of lower concentration (Figure 1). The diffusion coefficient is a proportionality constant between the molar flux due to molecular diffusion and the concentration gradient and is a function of the temperature and molecular weight. In locations where advective flux is low (clayey aquitards and sedimentary rock), diffusion is often the dominant transport mechanism.
The diffusive flux J (M/L2/T) in groundwater is calculated using Fick’s Law:
|
J = -De dC/dx |
|---|---|
| Where De | is the effective diffusion coefficient and |
| dC/dx | is the concentration gradient. |
The effective diffusion coefficient for transport through the porous media, De, is estimated as:
|
De = Dm ne δ/Τ |
|---|---|
| Where Dm | is the diffusion coefficient of the solute in water, |
| ne | is the effective porosity (dimensionless), |
| δ | is the constrictivity (dimensionless) which reflects the restricted motion of particles in narrow pores[4], and |
| Τ | is the tortuosity (dimensionless) which reflects the longer diffusion path in porous media around sediment particles[5]. |
Dm is a function of the temperature, fluid viscosity and molecular weight. Values of Dm for common groundwater solutes are shown in Table 1.
| Aqueous Diffusion Coefficient | Temperature (°C) |
Dm (cm2/s) |
Reference |
|---|---|---|---|
| Acetone | 25 | 1.16x10⁻⁵ | Cussler 1997 |
| Benzene | 20 | 1.02x10⁻⁵ | Bonoli and Witherspoon 1968 |
| Carbon dioxide | 25 | 1.92x10⁻⁵ | Cussler 1997 |
| Carbon tetrachloride | 25 | 9.55x10⁻⁶ | Yaws 1995 |
| Chloroform | 25 | 1.08x10⁻⁵ | Yaws 1995 |
| Dichloroethene | 25 | 1.12x10⁻⁵ | Yaws 1995 |
| 1,4-Dioxane | 25 | 1.02x10⁻⁵ | Yaws 1995 |
| Ethane | 25 | 1.52x10⁻⁵ | Witherspoon and Saraf 1965 |
| Ethylbenzene | 20 | 8.10x10⁻⁶ | Bonoli and Witherspoon 1968 |
| Ethene | 25 | 1.87x10⁻⁵ | Cussler 1997 |
| Helium | 25 | 6.28x10⁻⁵ | Cussler 1997 |
| Hydrogen | 25 | 4.50x10⁻⁵ | Cussler 1997 |
| Methane | 25 | 1.88x10⁻⁵ | Witherspoon and Saraf 1965 |
| Nitrogen | 25 | 1.88x10⁻⁵ | Cussler 1997 |
| Oxygen | 25 | 2.10x10⁻⁵ | Cussler 1997 |
| Perfluorooctanoic acid (PFOA) | 20 | 4.80x10⁻⁶ | Schaefer et al. 2019 |
| Perfluorooctane sulfonic acid (PFOS) | 20 | 5.40x10⁻⁶ | Schaefer et al. 2019 |
| Tetrachloroethene | 25 | 8.99x10⁻⁶ | Yaws 1995 |
| Toluene | 20 | 8.50x10⁻⁶ | Bonoli and Witherspoon 1968 |
| Trichloroethene | 25 | 8.16x10⁻⁶ | Rossi et al. 2015 |
| Vinyl chloride | 25 | 1.34x10⁻⁵ | Yaws 1995 |
Mechanical Dispersion
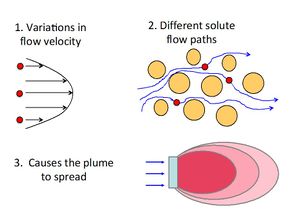
Mechanical dispersion (hydrodynamic dispersion) results from groundwater moving at rates both greater and less than the average linear velocity. This is due to: 1) fluids moving faster through the center of the pores than along the edges, 2) fluids traveling shorter pathways and/or splitting or branching to the sides, and 3) fluids traveling faster through larger pores than through smaller pores[6]. Because the invading solute-containing water does not travel at the same velocity everywhere, mixing occurs along flow paths. This mixing is called mechanical dispersion and results in distribution of the solute at the advancing edge of flow. The mixing that occurs in the direction of flow is called longitudinal dispersion. Spreading normal to the direction of flow from splitting and branching out to the sides is called transverse dispersion (Figure 2).
Macrodispersion
Macrodispersion is the name given to the plume spreading caused by large-scale heterogeneities and associated spatial variations in advective transport velocity. In some groundwater modeling projects, large values of the macrodispersion coefficient are used as an adjustment factor to help match the apparent large-scale spreading of the plume[3]. However, there is limited theoretical support for using large mechanical dispersion coefficients[7][8]. In transmissive zones, macrodispersion coefficients are often orders of magnitude greater than molecular diffusion coefficients, leading some to conclude that molecular diffusion can be ignored.
Recently, an alternate conceptual model for describing large-scale plume spreading in heterogeneous soils has been proposed[7][3][8]. In this approach, solute transport in the transmissive zones is reasonably well described by the advection-dispersion equation using relatively small dispersion coefficients representing mechanical dispersion. However, overtime, molecular diffusion slowly transports solutes into lower permeability zones (Figure 3). As the transmissive zones are remediated, these solutes slowly diffuse back out, causing a long extended tail to the flushout curve. This process is controlled by diffusion and the presence of geologic heterogeneity with sharp contrasts between transmissive and low permeability media[9] as discussed in the video shown in Figure 3.
Impacts on Breakthrough Curves
The impacts of matrix diffusion on the initial breakthrough of the solute plume and later cleanup can be visualized (Figure 4)[3]. Using a traditional advection-dispersion model, the breakthrough curve for a pulse tracer injection appears as a bell-shaped (Gaussian) curve (gray line on the right side of the upper graph; Figure 4) where the peak arrival time corresponds to the average groundwater velocity. Using an advection-diffusion approach, the breakthrough curve for a pulse injection is asymmetric (solid black line) with the peak tracer concentration arriving earlier than would be expected based on the average groundwater velocity, but with a long extended tail in the flushout curve indicating plume persistence and slow attenuation.
The lower graph of Figure 4 shows the predicted cleanup concentration profiles following complete elimination of a source area. The advection-dispersion model (gray line) predicts a clean-water front arriving at a time corresponding to the average groundwater velocity. The advection-diffusion model (black line) predicts that concentrations will start to decline more rapidly than expected (based on the average groundwater velocity) as clean water rapidly migrates through the highest-permeability strata. However, low but significant contaminant concentrations linger much longer (tailing) due to diffusive contaminant mass exchange between zones of high and low permeability, as demonstrated in the Matrix Diffusion Video (Figure 5). This video provides a visualization of the matrix diffusion process in groundwater. The key point of the video is that contaminants can diffuse into low-permeability zones rapidly from transmissive zones, but back diffuse out of the low permeability zones very slowly, much slower than diffusion into the low permeability zones.
The SERDP/ESTCP programs have funded several projects focusing on how matrix diffusion can impede progress towards reaching site closure, including:References
- ^ Freeze, A., and Cherry, J., 1979. Groundwater, Prentice-Hall, Englewood Cliffs, New Jersey, 604 pages. Free download from Hydrogeologists Without Borders.
- ^ Woessner, W.W., and Poeter, E.P., 2020. Properties of Earth Materials and Principals of Groundwater Flow, The Groundwater Project, Guelph, Ontario, 207 pages. Free download from The Groundwater Project.
- ^ 3.0 3.1 3.2 3.3 3.4 ITRC Integrated DNAPL Site Strategy Team, 2011. Integrated DNAPL Site Strategy. Technical/Regulatory Guidance Document, 209 pgs. Report pdf
- ^ Grathwohl, P., 1998. Diffusion in Natural Porous Media: Contaminant Transport, Sorption/Desorption and Dissolution Kinetics. Kluwer Academic Publishers, Boston. DOI: 10.1007/978-1-4615-5683-1 Available from: Springer.com
- ^ Carey, G.R., McBean, E.A. and Feenstra, S., 2016. Estimating Tortuosity Coefficients Based on Hydraulic Conductivity. Groundwater, 54(4), pp.476-487. DOI:10.1111/gwat.12406 Available from: NGWA
- ^ Fetter, C.W., 1994. Applied Hydrogeology: Macmillan College Publishing Company. New York New York. ISBN-13:978-0130882394
- ^ 7.0 7.1 7.2 Payne, F.C., Quinnan, J.A. and Potter, S.T., 2008. Remediation hydraulics. CRC Press. ISBN:978-1-4200-0684-1
- ^ 8.0 8.1 Hadley, P.W. and Newell, C., 2014. The new potential for understanding groundwater contaminant transport. Groundwater, 52(2), pp.174-186. doi:10.1111/gwat.12135
- ^ Sale, T.C., Illangasekare, T., Zimbron, J., Rodriguez, D., Wilkins, B. and Marinelli, F., 2007. AFCEE source zone initiative. Report Prepared for the Air Force Center for Environmental Excellence by Colorado State University and Colorado School of Mines. Report pdf
- ^ Sale, T., Parker, B.L., Newell, C.J. and Devlin, J.F., 2013. Management of Contaminants Stored in Low Permeability Zones-A State of the Science Review. ER-1740. Environmental Security Technology Certification Program by Colorado State University Fort Collins Department of Civil and Environmental Engineering. Project ER-1740. ER-1740
- ^ Farhat, S.K., Newell, C.J., Seyedabbasi, M.A., McDade, J.M., Mahler, N.T., Sale, T.C., Dandy, D.S. and Wahlberg, J.J., 2012. Matrix Diffusion Toolkit. ER-201126. Environmental Security Technology Certification Program by GSI Environmental Inc., Houston, Texas. ER-201126
- ^ Sale, T. and Newell, C., 2011. A Guide for Selecting Remedies for Subsurface Releases of Chlorinated Solvents. ER-200530. Environmental Security Technology Certification Program (ESTCP) by GSI Environmental Inc., Houston, Texas. ER-200530
- ^ Falta, R. 2016. A practical approach for modeling matrix diffusion effects in REMChlor. ER-201426
See Also
- International Water Management Institute Animations
- NAU Lecture Notes on Advective Transport
- MIT Open CourseWare Solute Transport: Advection with Dispersion Video
- Matrix Diffusion Webinar: Technical Challenges and Limitations to Site Closure
- Coursera Matrix Diffusion Online Lecture
- ESTCP Remediation and Matrix Diffusion Webinar
- Matrix Diffusion Movie
- Impact of Clay-DNAPL Interactions on Transport and Storage of Chlorinated Solvents in Low Permeability Zones
- Basic Research Addressing Contaminants in Low Permeability Zones
- Prediction of Groundwater Quality Improvement Down-Gradient of In Situ Permeable Treatment Barriers and Fully Remediated Source Zones
- Determining Source Attenuation History to Support Closure by Natural Attenuation
- Decision Support System for Matrix Diffusion Modeling
- Online Lecture Course - Matrix Diffusion
- Matrix Diffusion Video

